More Related Content
Similar to Carrollton TX - July 2010 - Market Report
Similar to Carrollton TX - July 2010 - Market Report (13)
More from Valarie Littles
More from Valarie Littles (20)
Carrollton TX - July 2010 - Market Report
- 1. Valarie Littles Median For Sale vs. Median Sold Ultima Real Estate
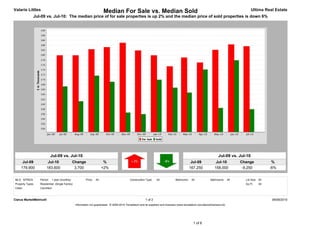
Jul-09 vs. Jul-10: The median price of for sale properties is up 2% and the median price of sold properties is down 6%
Jul-09 vs. Jul-10 Jul-09 vs. Jul-10
Jul-09 Jul-10 Change % Jul-09 Jul-10 Change %
179,900 183,600 3,700 +2% 167,250 158,000 -9,250 -6%
MLS: NTREIS Period: 1 year (monthly) Price: All Construction Type: All Bedrooms: All Bathrooms: All Lot Size: All
Property Types: Residential: (Single Family) Sq Ft: All
Cities: Carrollton
Clarus MarketMetrics® 1 of 2 08/08/2010
Information not guaranteed. © 2009-2010 Terradatum and its suppliers and licensors (www.terradatum.com/about/licensors.td).
1 of 6
- 2. Valarie Littles Median For Sale vs. Median Sold Ultima Real Estate
Jul-09 vs. Jul-10: The median price of for sale properties is up 2% and the median price of sold properties is down 6%
For Sale # Properties Sold # Properties Price
Time Period Median For Sale Median Sold Difference
Jul-10 183,600 664 158,000 58 -25,600
Jun-10 184,350 624 177,900 97 -6,450
May-10 182,150 562 158,500 100 -23,650
Apr-10 177,000 608 174,125 126 -2,875
Mar-10 179,000 560 164,750 98 -14,250
Feb-10 175,450 518 166,750 68 -8,700
Jan-10 179,900 488 170,000 41 -9,900
Dec-09 181,900 449 156,000 71 -25,900
Nov-09 185,000 470 156,625 92 -28,375
Oct-09 183,250 532 169,150 128 -14,100
Sep-09 182,400 570 171,625 99 -10,775
Aug-09 179,900 586 161,250 94 -18,650
Jul-09 179,900 590 167,250 116 -12,650
Clarus MarketMetrics® 2 of 2 08/08/2010
Information not guaranteed. © 2009-2010 Terradatum and its suppliers and licensors (www.terradatum.com/about/licensors.td).
2 of 6
- 3. Valarie Littles Supply & Demand by Month Ultima Real Estate
Jul-09 vs. Jul-10: The number of for sale properties is up 13% and the number of sold properties is down 50%
Jul-09 vs. Jul-10 Jul-09 vs. Jul-10
Jul-09 Jul-10 Change % Jul-09 Jul-10 Change %
590 664 74 +13% 116 58 -58 -50%
MLS: NTREIS Period: 1 year (monthly) Price: All Construction Type: All Bedrooms: All Bathrooms: All Lot Size: All
Property Types: Residential: (Single Family) Sq Ft: All
Cities: Carrollton
Clarus MarketMetrics® 1 of 2 08/08/2010
Information not guaranteed. © 2009-2010 Terradatum and its suppliers and licensors (www.terradatum.com/about/licensors.td).
3 of 6
- 4. Valarie Littles Supply & Demand by Month Ultima Real Estate
Jul-09 vs. Jul-10: The number of for sale properties is up 13% and the number of sold properties is down 50%
# Properties Average DOM # Properties Average DOM
Time Period For Sale For Sale Sold Sold
Jul-10 664 92 58 63
Jun-10 624 110 97 73
May-10 562 122 100 63
Apr-10 608 123 126 57
Mar-10 560 132 98 58
Feb-10 518 142 68 67
Jan-10 488 151 41 60
Dec-09 449 164 71 76
Nov-09 470 161 92 59
Oct-09 532 152 128 65
Sep-09 570 143 99 63
Aug-09 586 140 94 51
Jul-09 590 136 116 71
Clarus MarketMetrics® 2 of 2 08/08/2010
Information not guaranteed. © 2009-2010 Terradatum and its suppliers and licensors (www.terradatum.com/about/licensors.td).
4 of 6
- 5. Valarie Littles Months Supply of Inventory Ultima Real Estate
Jul-09 vs. Jul-10: The average months supply of inventory is up 172%
Jul-09 vs. Jul-10
Jul-09 Jul-10 Change %
3.6 9.9 6.3 +172%
MLS: NTREIS Period: 1 year (monthly) Price: All Construction Type: All Bedrooms: All Bathrooms: All Lot Size: All
Property Types: Residential: (Single Family) Sq Ft: All
Cities: Carrollton
Clarus MarketMetrics® 1 of 2 08/08/2010
Information not guaranteed. © 2009-2010 Terradatum and its suppliers and licensors (www.terradatum.com/about/licensors.td).
5 of 6
- 6. Valarie Littles Months Supply of Inventory Ultima Real Estate
Jul-09 vs. Jul-10: The average months supply of inventory is up 172%
# Units For Sale # UC Units UC Average
Time Period Last Day of Month During Month MSI DOM
Jul-10 534 54 10 66
Jun-10 482 73 7 61
May-10 459 51 9 65
Apr-10 422 148 3 57
Mar-10 388 131 3 65
Feb-10 375 100 4 67
Jan-10 373 66 6 67
Dec-09 337 49 7 73
Nov-09 364 57 6 60
Oct-09 369 107 3 69
Sep-09 398 118 3 60
Aug-09 425 100 4 66
Jul-09 418 115 4 52
Clarus MarketMetrics® 2 of 2 08/08/2010
Information not guaranteed. © 2009-2010 Terradatum and its suppliers and licensors (www.terradatum.com/about/licensors.td).
6 of 6