SlideShare a Scribd company logo
1 of 6
Download to read offline
NTPC Ltd.
Electric Utilities
BUY
Relative Capital Market Strength
NTPC Ltd. (NTPC), reported a mixed set of numbers for Q2 FY16 quarter. The
company reported a top-line of Rs. 178,985.1mn, which was in-line to our
expectation. EBITDA too came in-line with our expectation. However, lower
other income and tax income of Rs. 7,296.8mn (in contrast to our expectation
of a tax expenses of Rs. 1,176mn) led to a bottom-line of Rs. 28,982.8mn,
which was significantly above our expectation.
Q2 FY16 Result Analysis:
Higher power generation led to a rise in top-line: Higher commercial power
generation capacity coupled with expansion in the plant load factor (PLF) level,
led to a 6.9% Y-o-Y rise in total operating income to Rs. 178,985.1mn. Over a
year (i.e. between Q2 FY15 to Q2 FY16), NTPC’s commercial generation
capacity increased by 4.7% Y-o-Y to 43,943MW. At the same time, with an
improving economic scenario, the company witnessed over 4ppts rise in the
PLF to 77.3%. As a result, power sales volume increased by 8.6% Y-o-Y to
55.9bn units. However, the positive impact of increased sales volume was
partially offset by lower power sales realization, which declined by 0.9% Y-o-Y
to Rs. 3.3 per unit. Sequentially, top-line increased by 4.8%.
Lower fuel cost led to an expansion in EBITDA margin: On the back of lower
fuel cost, total operating expenditure increased at a lower rate (+2.8% Y-o-Y) as
compared to the top-line growth rate. Consequently, as a percent of total
operating income, operating expenditure stood at 77.5% in Q2 FY16 as
compared to 80.6% in the same quarter of the previous year. Thus, EBITDA
increased by 24.3% Y-o-Y to Rs. 40,306.5mn, with 315bps Y-o-Y expansion in
the margin. Sequentially, EBITDA increased by 17.2%, while margin expanded
by 240bps.
Higher tax credit rocketed bottom-line: With capacity expansion over a year,
depreciation charge and interest expenses increased by 14.9% and 22% Y-o-Y.
Moreover, other income declined by 48.1% Y-o-Y, mainly due to redemption of
bonds and reduction in investment levels. As a result, profit before tax
increased by 11% Y-o-Y. The company reported a tax credit of Rs. 7,296.8mn in
Q2 FY16 as compared to Rs. 1,176mn in Q2 FY15. Accordingly, bottom-line
increased by 39.9% Y-o-Y to Rs. 28,982.8mn, with 382bps expansion in the PAT
margin. Sequentially, bottom-line increased by 35.7%.
Valuation: NTPC is likely to benefit from the revival in domestic economy,
which in turn is expected to increase the demand of power. We anticipate, the
company to report an expansion in the PLF levels, thereby driving the top-line
growth. On operating cost front, NTPC is likely to benefit from the lower fuel
cost and usage of captive coal. At CMP of Rs. 135, NTPC is trading at a P/E
multiple of 12.3x and 9.6x to its FY16E and FY17E earnings, respectively, which
we feel is inexpensive taking into consideration its project addition schedule,
profitability and RoE of 10-13%. Based on a P/E multiple of 12x to its FY17E
earnings, we arrive at a target price of Rs. 169 per share, reflecting a return of
26%. Thus we reiterate our “BUY” recommendation on the stock.
Q2 FY16 Snapshot:
Rajnath Yadav | Board line: +91 22 6707 9999; Ext. 975 | rajnath.yadav@choiceindia.com
1
Nov. 07, 2015
Rating Matrix
CMP (Rs.) 135
Rating Buy
Target price (Rs.) 169
Target period 12 months
Upside potential 25.3%
52 week H/L (Rs.) 164.7 / 107.2
Face value (Rs.) 10
Category Large Cap
Sector Electric Utilities
Shareholding Pattern as on 30th Sept. 2015
Particulars Sept-15 Jun-15 Mar-15 Sep-14
Promoters 75.0% 75.0% 75.0% 75.0%
FIIs 9.2% 10.0% 10.3% 10.4%
DIIs 13.5% 12.7% 12.3% 12.1%
Non institutions 2.3% 2.3% 2.4% 2.5%
Q2 FY16 Result Update
Financial Snapshot (Rs. bn)
Projections FY12 FY13 FY14 FY15 FY16E FY17E
Revenue 621 657 720 732 730 854
EBITDA 140 171 178 161 176 213
Adjusted PAT 92 109 110 103 91 116
EBITDA (%) 22.6% 26.0% 24.7% 22.0% 24.1% 25.0%
PAT (%) 14.9% 16.6% 15.2% 14.0% 12.5% 13.6%
EPS 11 13 13 12 11 14
BVPS 89 97 104 99 108 118
RONW (%) 13.1% 14.2% 13.2% 12.3% 10.7% 12.5%
P/E 12.3 9.6
P / BVPS 1.3 1.1
Source: Choice Broking Research, Company
75
80
85
90
95
100
105
110
115
07-Nov-14
07-Dec-14
07-Jan-15
07-Feb-15
07-Mar-15
07-Apr-15
07-May-15
07-Jun-15
07-Jul-15
07-Aug-15
07-Sep-15
07-Oct-15
NTPC Ltd. Sensex
Particular (Rs. mn) Q2 FY16 Q1 FY16 Q2 FY15 Q-o-Q (%) Y-o-Y (%)
Total Operating Revenue 178,985.1 170,845.8 167,366.3 4.8% 6.9%
EBITDA 40,306.5 34,376.7 32,423.3 17.2% 24.3%
Reported PAT 28,982.8 21,353.5 20,716.3 35.7% 39.9%
EBITDA Margin (%) 22.5% 20.1% 19.4% 240 bps 315 bps
PAT Margin (%) 16.2% 12.5% 12.4% 369 bps 382 bps
BUY
2
Q2 FY16 Quarter Performance:
Source: Choice Broking Research, Company
Q2 FY16 Segmental Details:
Source: Choice Broking Research, Company
NTPC Ltd.
Electric Utilities
Nov. 07, 2015
Q2 FY16 Result Update
Particulars (Rs. mn) Q2 FY16 Q1 FY16 Q2 FY15 Q-o-Q (%) Y-o-Y (%)
Total Operating Income 178,985.1 170,845.8 167,366.3 4.8% 6.9%
Total Operating Expenditure (138,678.6) (136,469.1) (134,943.0) 1.6% 2.8%
EBITDA 40,306.5 34,376.7 32,423.3 17.2% 24.3%
Depreciation (13,229.1) (12,379.5) (11,515.8) 6.9% 14.9%
EBIT 27,077.4 21,997.2 20,907.5 23.1% 29.5%
Interest Expenses (8,145.3) (7,308.8) (6,674.1) 11.4% 22.0%
Other Income 2,753.9 2,387.2 5,306.9 15.4% -48.1%
Profit Before Tax (PBT) 21,686.0 17,075.6 19,540.3 27.0% 11.0%
Tax Expenses 7,296.8 4,277.9 1,176.0 70.6% 520.5%
Adjusted PAT 28,982.8 21,353.5 20,716.3 35.7% 39.9%
Basic EPS (Rs.) 3.5 2.6 2.5 35.5% 39.8%
Diluted EPS (Rs.) 3.5 2.6 2.5 35.5% 39.8%
EBITDA Margin (%) 22.5% 20.1% 19.4% 240 bps 315 bps
Reported PAT Margin (%) 16.2% 12.5% 12.4% 369 bps 382 bps
Q2 FY16 Q1 FY16 Q2 FY15 Q-o-Q (%) Y-o-Y (%)
Segmental Revenue (Rs. mn)
Generation 179,502.8 171,173.1 167,828.7 4.9% 7.0%
Others 270.1 237.1 228.6 13.9% 18.2%
Total Revenue 179,772.9 171,410.2 168,057.3 4.9% 7.0%
Segmental EBIT Break-up (Rs. mn)
Generation 31,093.0 25,249.6 24,240.5 23.1% 28.3%
Others (270.2) (20.7) 36.7 1205.3% -836.2%
Total EBIT 30,822.8 25,228.9 24,277.2 22.2% 27.0%
BUY
3
Q1 FY16 Other Operating Parameters:
Source: Choice Broking Research, Company
NTPC Ltd.
Electric Utilities
Nov. 07, 2015
Q2 FY16 Result Update
Other Operating Parameters
Particular (Rs. mn) Q2 FY15 Q3 FY15 Q4 FY15 Q1 FY16 Q2 FY16 Q-o-Q (%) Y-o-Y (%)
Group Installed Capacity (MW) 43,128 43,143 44,398 45,048 45,548 1.1% 5.6%
NTPC Commercial Capacity (MW) 36,467 37,142 37,142 37,142 37,942 2.2% 4.0%
Group Commercial Capacity (MW) 41,968 42,643 43,143 43,143 43,943 1.9% 4.7%
NTPC Coal PLF (%) 73.2% 80.8% 82.7% 77.6% 77.3% (31) bps 407 bps
NTPC Gas PLF (%) 33.4% 31.8% 26.7% 28.5% 25.7% (274) bps (765) bps
NTPC Coal PAF (%) 76.8% 91.0% 97.2% 91.6% 88.1% (352) bps 1,130 bps
NTPC Gas PAF (%) 89.1% 93.2% 96.5% 96.6% 97.6% 100 bps 851 bps
Gross Generation (mn Units) 55,421 61,310 61,313 58,696 60,159 2.5% 8.5%
Commercial Generation (mn Units) 55,252 61,139 61,313 58,482 59,847 2.3% 8.3%
Energy Sent Out (mn Units) 51,465 57,216 57,385 54,475 55,891 2.6% 8.6%
Domestic Coal Supply (mn tonnes) 33.92 39.61 41.06 38.39 34.62 -9.8% 2.1%
Imported Coal Supply (mn tonnes) 2.88 4.93 4.89 3.86 2.56 -33.7% -11.1%
Total Coal Consumption (mn tonnes) 36.80 44.54 45.95 42.25 37.18 -12.0% 1.0%
Gas Consumption (mmscmd) 6.68 6.12 5.62 5.88 5.13 -12.8% -23.2%
Average Tariff (Rs. per Unit) 3.32 3.26 3.34 3.26 3.29 0.9% -0.9%
Average Fuel Cost (Rs. Per unit) 2.22 2.12 2.18 2.11 2.06 -2.3% -7.1%
Regulated Equity (Rs. mn) 352,075 366,177 369,163 369,000 389,120 5.5% 10.5%
Conference Call Highlights:
• During the quarter, NTPC commercialized 800MW of its hydro power generation capacity and operated it at 83.3% PLF
level. Moreover, in Oct. 2015, the company commercialized 500MW generation capacity at Vindhyachal Super Thermal
Power Station. This thermal power plant is entitled to earn additional return on equity of 0.5% (i.e. 16%), as it was
synchronized and commissioned well before the commercial date of operations.
• In Sept. 2015, the company appointed M/s. Thriveni- Sainik JV as mine developer cum operator for Pakri Barwadih Coal
Mining Project for a period of 27 years. Peak annual production from the mine is likely to be 15mn tonnes. Commercial
mining operations is expected to start in current fiscal.
• Adjusted profit for the quarter increased by 24.2% Y-o-Y to Rs. 22,165.2mn as against Rs. 17844mn in Q2 FY15.
• Regulated equity during the quarter stood at Rs. 3,89,120mn. NTPC has raised the standalone capex guidance for FY16
from Rs. 230bn to Rs. 250bn.
4
Financial Statement
Source: Choice Broking Research
BUYNTPC Ltd.
Electric Utilities
Profit and Loss Statement
Projections (Rs. mn) FY12 FY13 FY14 FY15 FY16E FY17E
Total Operating Income 620,522 656,916 720,193 732,461 729,972 853,692
Revenue Growth Rate (%) 9.0% 5.9% 9.6% 1.7% -0.3% 16.9%
Total Expenditure (480,124) (485,947) (542,275) (571,605) (554,122) (640,249)
EBITDA 140,399 170,969 177,918 160,856 175,851 213,442
EBITDA Growth Rate (%) 2.9% 21.8% 4.1% -9.6% 9.3% 21.4%
EBITDA Margin (%) 22.6% 26.0% 24.7% 22.0% 24.1% 25.0%
Depreciation (27,917) (33,968) (41,422) (49,117) (54,417) (61,787)
EBIT 112,482 137,001 136,496 111,740 121,434 151,656
Interest (17,116) (19,244) (24,066) (27,436) (29,432) (32,547)
Other Income 27,897 31,188 26,620 21,163 19,809 20,360
Exceptional Item 0 16,841 0 0 0 0
PBT 123,262 165,786 139,050 105,467 111,811 139,469
Income Tax Expenses (31,024) (39,592) (29,299) (2,558) (20,794) (23,061)
PAT 92,237 126,194 109,751 102,909 91,018 116,408
PAT Growth Rate (%) 1.3% 18.6% 0.4% -6.2% -11.6% 27.9%
PAT Margin (%) 14.9% 16.6% 15.2% 14.0% 12.5% 13.6%
Balance Sheet
Projections (Rs. mn) FY12 FY13 FY14 FY15 FY16E FY17E
Share Capital 82,455 82,455 82,455 82,455 82,455 82,455
Reserves And Surplus 650,457 721,421 775,699 734,119 804,203 893,837
Deferred Revenue 14,301 12,441 16,099 13,942 13,942 13,942
Long-Term Borrowings 459,083 532,537 624,058 785,323 820,470 869,711
Deferred Tax Liabilities (Net) 6,369 9,153 10,516 9,791 8,163 9,547
Other Long-Term Liabilities 17,291 19,698 25,125 28,866 28,866 28,866
Long-Term Provisions 6,037 7,399 8,794 11,157 8,512 9,955
Short-Term Borrowings 0 0 0 0 141,772 165,800
Trade Payables 44,607 51,324 64,296 59,532 37,747 44,385
Other Current Liabilities 95,372 104,693 115,476 168,076 122,522 143,287
Short-Term Provisions 32,337 70,045 73,026 77,588 76,392 89,340
Total Liabilities 1,408,307 1,611,165 1,795,542 1,970,847 2,145,042 2,351,124
Tangilble Assets 450,445 626,874 718,659 742,393 993,055 1,222,216
Intangible Assets 2,119 2,487 2,450 46,097 0 0
CWIP 418,278 371,094 448,867 564,935 488,447 410,844
Intangible Assets Under Development 0 0 19 0 0 0
Non-Current Investments 95,839 91,376 81,209 71,541 71,541 71,541
Long Term Loans And Advances 53,944 96,334 127,773 155,279 155,279 155,279
Other Non Current Assets 13,719 14,912 17,868 16,968 16,968 16,968
Current Investments 16,225 16,225 16,370 18,781 18,781 18,781
Inventories 37,029 40,572 53,734 74,530 69,997 77,183
Trade Receivables 58,325 53,650 52,201 76,044 77,997 86,539
Cash And Bank Balances 161,418 168,677 153,114 128,788 141,772 165,800
Short-Term Loans And Advances 15,433 17,456 31,160 24,076 24,076 24,076
Other Current Assets 85,534 111,508 92,120 51,416 87,131 101,898
Total Assets 1,408,307 1,611,165 1,795,542 1,970,847 2,145,042 2,351,124
Nov. 07, 2015
Q2 FY16 Result Update
5
Financial Statement (Contd…)
Source: Choice Broking Research
BUYNTPC Ltd.
Electric Utilities
Cash Flow Statement
Projections (Rs. mn) FY12 FY13 FY14 FY15 FY16E FY17E
Profit Before Tax 123,262 165,786 139,050 105,467 111,811 139,469
Depreciation and Amortization 27,917 33,968 41,422 49,117 54,417 61,787
Other Adjustments (11,286) (9,875) 5,335 14,629 12,869 15,937
Change in Working Capital (22,071) (5,971) (2,919) (7,665) (105,942) 12,683
Income Tax Paid (10,723) (28,956) (25,563) (19,199) (20,794) (23,061)
Cash Flow from Operating Activities 107,099 154,952 157,325 142,347 52,362 206,815
CAPEX (107,944) (162,967) (167,397) (171,283) (182,493) (213,423)
Change in Investments 18,039 16,225 16,225 16,370 0 0
Others 11,100 6,573 11,375 9,287 16,563 16,563
Cash Flow from Investing Activities (78,805) (140,169) (139,797) (145,626) (165,930) (196,860)
Net Change in Borrowings 52,135 72,624 73,732 186,092 176,918 73,270
Interest Expenses (38,851) (38,315) (47,414) (55,863) (29,432) (32,547)
Dividend & Dividend Tax (41,146) (40,688) (57,881) (147,968) (20,934) (26,774)
Others (829) (1,146) (1,527) (1,042) 0 124
Cash Flow from Financing Activities (28,691) (7,524) (33,090) (18,781) 126,552 14,073
Net Cash Inflow / Outflow (398) 7,259 (15,562) (22,060) 12,984 24,028
Opening Cash & Cash Equivalents 161,853 161,418 168,677 153,114 128,788 141,772
Closing Cash & Cash Equivalent 161,455 168,677 153,115 131,054 141,772 165,800
Financial Ratios
Particulars FY12 FY13 FY14 FY15 FY16E FY17E
Profitability & Return Ratios
EBITDA Margin (%) 22.6% 26.0% 24.7% 22.0% 24.1% 25.0%
PAT Margin (%) 14.9% 16.6% 15.2% 14.0% 12.5% 13.6%
RONW (%) 13.1% 14.2% 13.2% 12.3% 10.7% 12.5%
RoCE (%) 9.6% 10.5% 9.3% 7.0% 6.8% 7.6%
Working Capital & Liquidity Ratios
Payables (Days) 26.6 29.1 32.8 29.9 29.1 29.5
Inventory (Days) 22.1 23.0 27.4 37.5 35.0 33.0
Receivables (Days) 34.8 30.4 26.6 38.2 39.0 37.0
Current Ratio (X) 2.1 1.7 1.5 1.2 1.7 1.6
Turnover & Leverage Ratios
Fixed Asset Turnover (X) 0.8 0.7 0.7 0.6 0.5 0.5
Total Asset Turnover (X) 0.5 0.4 0.4 0.4 0.4 0.4
Debt Equity Ratio (X) 0.6 0.7 0.7 1 1.1 1.1
Dividend Pay Out Ratio 38.4% 32.0% 45.1% 120.2% 20.0% 20.0%
DuPont Analysis 13.1% 16.4% 13.2% 12.3% 10.7% 12.5%
Tax Burden (PAT / PBT) 0.7 0.8 0.8 1.0 0.8 0.8
Interest Burden (PBT / PBIT) 1.1 1.2 1.0 0.9 0.9 0.9
EBIT Margin 18.1% 20.9% 19.0% 15.3 16.6% 17.8%
Total Asset Turnover Ratio (Net Sales / Total Asset) 0.5 0.4 0.4 0.4 0.4 0.4
Leverage Ratio (Total Asset / Total Equity) 1.9 2.0 2.0 2.2 2.4 2.4
Valuation Ratios
DPS (Rs.) 4.3 4.2 6.0 15.0 2.2 2.8
BVPS (Rs.) 88.9 97.5 104.1 99.0 107.5 118.4
EPS (Rs. Cr) 11.2 13.3 13.3 12.5 11.0 14.1
P / E (X) 12.1 10.2 10.2 10.8 12.3 9.6
P / BVPS (X) 1.5 1.4 1.3 1.4 1.3 1.1
Nov. 07, 2015
Q2 FY16 Result Update
e
6
Disclaimer
This is solely for information of clients of Choice Broking and does not construe to be an investment advice. It is also not intended as an offer or solicitation
for the purchase and sale of any financial instruments. Any action taken by you on the basis of the information contained herein is your responsibility alone
and Choice Broking its subsidiaries or its employees or associates will not be liable in any manner for the consequences of such action taken by you. We have
exercised due diligence in checking the correctness and authenticity of the information contained in this recommendation, but Choice Broking or any of its
subsidiaries or associates or employees shall not be in any way responsible for any loss or damage that may arise to any person from any inadvertent error in
the information contained in this recommendation or any action taken on basis of this information. This report is based on the fundamental analysis with a
view to forecast future price. The Research analysts for this report certifies that all of the views expressed in this report accurately reflect his or her personal
views about the subject company or companies and its or their securities, and no part of his or her compensation was, is or will be, directly or indirectly
related to specific recommendations or views expressed in this report. Choice Broking has based this document on information obtained from sources it
believes to be reliable but which it has not independently verified; Choice Broking makes no guarantee, representation or warranty and accepts no
responsibility or liability as to its accuracy or completeness. The opinions contained within the report are based upon publicly available information at the
time of publication and are subject to change without notice. The information and any disclosures provided herein are in summary form and have been
prepared for informational purposes. The recommendations and suggested price levels are intended purely for stock market investment purposes. The
recommendations are valid for the day of the report and will remain valid till the target period. The information and any disclosures provided herein may be
considered confidential. Any use, distribution, modification, copying, forwarding or disclosure by any person is strictly prohibited. The information and any
disclosures provided herein do not constitute a solicitation or offer to purchase or sell any security or other financial product or instrument. The current
performance may be unaudited. Past performance does not guarantee future returns. There can be no assurance that investments will achieve any targeted
rates of return, and there is no guarantee against the loss of your entire investment.
POTENTIAL CONFLICT OF INTEREST DISCLOSURE (as on date of report) Disclosure of interest statement – • Analyst interest of the stock /Instrument(s): - No. •
Firm interest of the stock / Instrument (s): - No.
Choice’s Rating Rationale
The price target for a large cap stock represents the value the analyst expects the stock to reach over next 12 months. For a
stock to be classified as Outperform, the expected return must exceed the local risk free return by at least 5% over the next
12 months. For a stock to be classified as Underperform, the stock return must be below the local risk free return by at least
5% over the next 12 months. Stocks between these bands are classified as Neutral.
Choice Equity Broking Pvt. Ltd.
Choice House, Shree Shakambhari Corporate Park, Plt No: -156-158,
J.B. Nagar, Andheri (East), Mumbai - 400 099.
+91-022-6707 9999
+91-022-6707 9959
www.choiceindia.com
Q2 FY16 Result Update
Rating Legend
Rating Upside
BUY Absolute Return >15%
Accumulate Absolute Return Between 10-15%
Hold Absolute Return Between 0-10%
Reduce Absolute Return 0 To Negative 10%
Sell Absolute Return > Negative 10%
Institutional Equity Team
Name Designation Email id Contact No.
Ajay Kejriwal President ajay@choiceindia.com 022- 6707 9850
Sumeet Bagadia Head of Research sumeet.bagadia@choiceindia.com 022 - 6707 9830
Amit Singh VP - Institutional Sales amit.singh@choiceindia.com 022 - 6707 9852
Devendra Gaikwad Sr. Manager - Institutional Sales devendra.gaikwad@choiceindia.com 022 - 6707 9877
Rajnath Yadav Research Analyst rajnath.yadav@choiceindia.com 022 - 6707 9975
Satish Kumar Research Analyst satish.kumar@choiceindia.com 022 - 6707 9974
Kunal Parmar Research Associate kunal.parmar@choiceindia.com 022 - 6707 9982
Amit Pathania Research Associate amit.pathania@choiceindia.com 022 - 6707 9979
Vikas Chaudhari Research Associate vikas.chaudhari@choiceindia.com 022 - 6707 9988
Trirashmi Ghoderao Research Advisor trirashmi.ghoderao@choiceindia.com 022 - 6707 9972
Neeraj Yadav Research Advisor Neeraj.yadav@choiceindia.com 022 - 6707 9988
NTPC Ltd.
Date Recommendation CMP (Rs.) Target Price (Rs.)
07-Nov-2015 BUY 135 169
01-Aug-2015 BUY 135 169
23-Jul-2015 BUY 137 169

More Related Content

What's hot

2008 Q4 Google Earnings Slides
2008 Q4 Google Earnings Slides2008 Q4 Google Earnings Slides
2008 Q4 Google Earnings Slidesguest3f8836
 
Motherson Sumi Systems - Result Update
Motherson Sumi Systems - Result UpdateMotherson Sumi Systems - Result Update
Motherson Sumi Systems - Result UpdateAngel Broking
 
Half-Year Financial Report 2018/19
Half-Year Financial Report 2018/19Half-Year Financial Report 2018/19
Half-Year Financial Report 2018/19AT&S_IR
 
Presentation Material for 3Q / Mar. 2020
Presentation Material for 3Q / Mar. 2020Presentation Material for 3Q / Mar. 2020
Presentation Material for 3Q / Mar. 2020RicohLease
 
FY2014 and 2015-2019 Strategic Plan (26 marzo 2015)
FY2014 and 2015-2019 Strategic Plan (26 marzo 2015)FY2014 and 2015-2019 Strategic Plan (26 marzo 2015)
FY2014 and 2015-2019 Strategic Plan (26 marzo 2015)Terna SpA
 
Ril ru2 qfy2011-301010
Ril   ru2 qfy2011-301010Ril   ru2 qfy2011-301010
Ril ru2 qfy2011-301010Angel Broking
 
Third Quarter of Fiscal Year Ending March 2018(FY2017) Financial Highlights
Third Quarter of Fiscal Year Ending March 2018(FY2017) Financial HighlightsThird Quarter of Fiscal Year Ending March 2018(FY2017) Financial Highlights
Third Quarter of Fiscal Year Ending March 2018(FY2017) Financial HighlightsRicohLease
 
energy future holindings driving2
energy future holindings driving2energy future holindings driving2
energy future holindings driving2finance29
 
4 q'15 earnings presentation final
4 q'15 earnings presentation final4 q'15 earnings presentation final
4 q'15 earnings presentation finalq4curtisswright
 
Q1 2017 Earnings Presentation
Q1 2017 Earnings PresentationQ1 2017 Earnings Presentation
Q1 2017 Earnings Presentationingersollrand2016
 
Enea 2016 Q3 - financial results (english)
Enea 2016 Q3 - financial results (english) Enea 2016 Q3 - financial results (english)
Enea 2016 Q3 - financial results (english) Enea
 
TCS Q1FY15: Results in-line, buy on dips
TCS Q1FY15: Results in-line, buy on dipsTCS Q1FY15: Results in-line, buy on dips
TCS Q1FY15: Results in-line, buy on dipsIndiaNotes.com
 
Jagran prakashan ru2 qfy2011-291010
Jagran prakashan ru2 qfy2011-291010Jagran prakashan ru2 qfy2011-291010
Jagran prakashan ru2 qfy2011-291010Angel Broking
 
Bruker q1 2014 earnings presentation final
Bruker q1 2014 earnings presentation finalBruker q1 2014 earnings presentation final
Bruker q1 2014 earnings presentation finalInvestorBruker
 

What's hot (20)

2008 Q4 Google Earnings Slides
2008 Q4 Google Earnings Slides2008 Q4 Google Earnings Slides
2008 Q4 Google Earnings Slides
 
Apar Industries_Q2FY15_Nov'14_Eisec
Apar Industries_Q2FY15_Nov'14_EisecApar Industries_Q2FY15_Nov'14_Eisec
Apar Industries_Q2FY15_Nov'14_Eisec
 
Motherson Sumi Systems - Result Update
Motherson Sumi Systems - Result UpdateMotherson Sumi Systems - Result Update
Motherson Sumi Systems - Result Update
 
Half-Year Financial Report 2018/19
Half-Year Financial Report 2018/19Half-Year Financial Report 2018/19
Half-Year Financial Report 2018/19
 
Presentation Material for 3Q / Mar. 2020
Presentation Material for 3Q / Mar. 2020Presentation Material for 3Q / Mar. 2020
Presentation Material for 3Q / Mar. 2020
 
Ntpc
NtpcNtpc
Ntpc
 
PIRELLI 1Q 2011 RESULTS
PIRELLI 1Q 2011 RESULTSPIRELLI 1Q 2011 RESULTS
PIRELLI 1Q 2011 RESULTS
 
FY2014 and 2015-2019 Strategic Plan (26 marzo 2015)
FY2014 and 2015-2019 Strategic Plan (26 marzo 2015)FY2014 and 2015-2019 Strategic Plan (26 marzo 2015)
FY2014 and 2015-2019 Strategic Plan (26 marzo 2015)
 
Ril ru2 qfy2011-301010
Ril   ru2 qfy2011-301010Ril   ru2 qfy2011-301010
Ril ru2 qfy2011-301010
 
Third Quarter of Fiscal Year Ending March 2018(FY2017) Financial Highlights
Third Quarter of Fiscal Year Ending March 2018(FY2017) Financial HighlightsThird Quarter of Fiscal Year Ending March 2018(FY2017) Financial Highlights
Third Quarter of Fiscal Year Ending March 2018(FY2017) Financial Highlights
 
energy future holindings driving2
energy future holindings driving2energy future holindings driving2
energy future holindings driving2
 
4 q'15 earnings presentation final
4 q'15 earnings presentation final4 q'15 earnings presentation final
4 q'15 earnings presentation final
 
Q1 2017 Earnings Presentation
Q1 2017 Earnings PresentationQ1 2017 Earnings Presentation
Q1 2017 Earnings Presentation
 
Webcast 1 q14 eng
Webcast 1 q14 engWebcast 1 q14 eng
Webcast 1 q14 eng
 
Enea 2016 Q3 - financial results (english)
Enea 2016 Q3 - financial results (english) Enea 2016 Q3 - financial results (english)
Enea 2016 Q3 - financial results (english)
 
TCS Q1FY15: Results in-line, buy on dips
TCS Q1FY15: Results in-line, buy on dipsTCS Q1FY15: Results in-line, buy on dips
TCS Q1FY15: Results in-line, buy on dips
 
Jagran prakashan ru2 qfy2011-291010
Jagran prakashan ru2 qfy2011-291010Jagran prakashan ru2 qfy2011-291010
Jagran prakashan ru2 qfy2011-291010
 
Bruker q1 2014 earnings presentation final
Bruker q1 2014 earnings presentation finalBruker q1 2014 earnings presentation final
Bruker q1 2014 earnings presentation final
 
Company Profile Presentation
Company Profile Presentation Company Profile Presentation
Company Profile Presentation
 
Webcast 2 q14 eng
Webcast 2 q14 engWebcast 2 q14 eng
Webcast 2 q14 eng
 

Viewers also liked

Viewers also liked (17)

Akzo Nobel India- Result Analysis Q2FY16
Akzo Nobel India- Result Analysis Q2FY16Akzo Nobel India- Result Analysis Q2FY16
Akzo Nobel India- Result Analysis Q2FY16
 
Choice - Morning Tea
Choice - Morning TeaChoice - Morning Tea
Choice - Morning Tea
 
Choice - Morning Tea
Choice - Morning TeaChoice - Morning Tea
Choice - Morning Tea
 
Choice - Morning Tea
Choice - Morning TeaChoice - Morning Tea
Choice - Morning Tea
 
Eqr210820150828321
Eqr210820150828321Eqr210820150828321
Eqr210820150828321
 
Morning tea 13-11-2015
Morning tea 13-11-2015Morning tea 13-11-2015
Morning tea 13-11-2015
 
M&M- Q3FY16 Result Update
M&M- Q3FY16 Result UpdateM&M- Q3FY16 Result Update
M&M- Q3FY16 Result Update
 
Choice - Morning Tea
Choice - Morning TeaChoice - Morning Tea
Choice - Morning Tea
 
Choice - Morning Tea
Choice - Morning TeaChoice - Morning Tea
Choice - Morning Tea
 
Morning Tea
Morning TeaMorning Tea
Morning Tea
 
Morning tea 20 10-2015
Morning tea 20 10-2015Morning tea 20 10-2015
Morning tea 20 10-2015
 
Morning tea 02 12-2015
Morning tea 02 12-2015Morning tea 02 12-2015
Morning tea 02 12-2015
 
Choice Morning-Tea
Choice Morning-TeaChoice Morning-Tea
Choice Morning-Tea
 
Morning Tea 07/09/2015
Morning Tea 07/09/2015Morning Tea 07/09/2015
Morning Tea 07/09/2015
 
Choice - Morning Tea
Choice - Morning TeaChoice - Morning Tea
Choice - Morning Tea
 
Morning Tea 11-09-15
Morning Tea 11-09-15Morning Tea 11-09-15
Morning Tea 11-09-15
 
Morning Tea 28.08.15
Morning Tea 28.08.15Morning Tea 28.08.15
Morning Tea 28.08.15
 

Similar to NTPC Ltd.Q2FY Result Update

EISEC - Grauer and weil (India) Ltd_Q2FY15
EISEC - Grauer and weil (India) Ltd_Q2FY15EISEC - Grauer and weil (India) Ltd_Q2FY15
EISEC - Grauer and weil (India) Ltd_Q2FY15Pushkaraj Jamsandekar
 
Mahindra Financial result update: 4QFY15 PAT up 7% YoY and 144% QoQ
Mahindra Financial result update: 4QFY15 PAT up 7% YoY and 144% QoQMahindra Financial result update: 4QFY15 PAT up 7% YoY and 144% QoQ
Mahindra Financial result update: 4QFY15 PAT up 7% YoY and 144% QoQIndiaNotes.com
 
Ceat Q1FY15: Higher opex impact margins; Book profits
 Ceat Q1FY15: Higher opex impact margins; Book profits Ceat Q1FY15: Higher opex impact margins; Book profits
Ceat Q1FY15: Higher opex impact margins; Book profitsIndiaNotes.com
 
ENIL 1QFY18
ENIL 1QFY18ENIL 1QFY18
ENIL 1QFY18Mohit Jn
 
Entertainment Network Ltd: Stock Price & Q4 Results Of Entertainment Network ...
Entertainment Network Ltd: Stock Price & Q4 Results Of Entertainment Network ...Entertainment Network Ltd: Stock Price & Q4 Results Of Entertainment Network ...
Entertainment Network Ltd: Stock Price & Q4 Results Of Entertainment Network ...hdfcsecurities1
 
Q2FY15: Hold Mahindra & Mahindra Financial Services - Nirmal Bang
Q2FY15: Hold Mahindra & Mahindra Financial Services - Nirmal BangQ2FY15: Hold Mahindra & Mahindra Financial Services - Nirmal Bang
Q2FY15: Hold Mahindra & Mahindra Financial Services - Nirmal BangIndiaNotes.com
 
Ongc ru2 qfy2011-291010
Ongc ru2 qfy2011-291010Ongc ru2 qfy2011-291010
Ongc ru2 qfy2011-291010Angel Broking
 
Zydus Wellness reports a subdued quarter, hold - Nirmal Bang
Zydus Wellness reports a subdued quarter, hold - Nirmal BangZydus Wellness reports a subdued quarter, hold - Nirmal Bang
Zydus Wellness reports a subdued quarter, hold - Nirmal BangIndiaNotes.com
 
Vaibhav Global Q1FY15: Outlook continues to remain positive; Hold
 Vaibhav Global Q1FY15: Outlook continues to remain positive; Hold Vaibhav Global Q1FY15: Outlook continues to remain positive; Hold
Vaibhav Global Q1FY15: Outlook continues to remain positive; HoldIndiaNotes.com
 
CTEEP Results Presentation 2T15
CTEEP Results Presentation 2T15CTEEP Results Presentation 2T15
CTEEP Results Presentation 2T15Cteep_ri
 
Stock Market Report For Investors -Sai Proficient
Stock Market Report For Investors -Sai ProficientStock Market Report For Investors -Sai Proficient
Stock Market Report For Investors -Sai Proficientsai proficient research
 
HeidelbergCement Q2 2018 Presentation
HeidelbergCement Q2 2018 PresentationHeidelbergCement Q2 2018 Presentation
HeidelbergCement Q2 2018 PresentationHeidelbergCement
 
Analyst presentation H1 2016
Analyst presentation H1 2016Analyst presentation H1 2016
Analyst presentation H1 2016Hera Group
 
Britannia Industries 1QFY15 results ahead of estimate; buy - Motilal Oswal
Britannia Industries 1QFY15 results ahead of estimate; buy - Motilal OswalBritannia Industries 1QFY15 results ahead of estimate; buy - Motilal Oswal
Britannia Industries 1QFY15 results ahead of estimate; buy - Motilal OswalIndiaNotes.com
 
Colgate ru2 qfy2011-281010
Colgate  ru2 qfy2011-281010Colgate  ru2 qfy2011-281010
Colgate ru2 qfy2011-281010Angel Broking
 
JSW Energy Ltd. Q3 FY16 Result Update
JSW Energy Ltd. Q3 FY16 Result UpdateJSW Energy Ltd. Q3 FY16 Result Update
JSW Energy Ltd. Q3 FY16 Result Updatechoice broking
 
Global Digital Transformation Partner 2019
Global Digital Transformation Partner 2019Global Digital Transformation Partner 2019
Global Digital Transformation Partner 2019Mr Nyak
 
Marico ru2 qfy2011-261010
Marico ru2 qfy2011-261010Marico ru2 qfy2011-261010
Marico ru2 qfy2011-261010Angel Broking
 
Ntpc 2 qfy11 result update - 271010
Ntpc   2 qfy11 result update - 271010Ntpc   2 qfy11 result update - 271010
Ntpc 2 qfy11 result update - 271010Angel Broking
 

Similar to NTPC Ltd.Q2FY Result Update (20)

EISEC - Grauer and weil (India) Ltd_Q2FY15
EISEC - Grauer and weil (India) Ltd_Q2FY15EISEC - Grauer and weil (India) Ltd_Q2FY15
EISEC - Grauer and weil (India) Ltd_Q2FY15
 
Mahindra Financial result update: 4QFY15 PAT up 7% YoY and 144% QoQ
Mahindra Financial result update: 4QFY15 PAT up 7% YoY and 144% QoQMahindra Financial result update: 4QFY15 PAT up 7% YoY and 144% QoQ
Mahindra Financial result update: 4QFY15 PAT up 7% YoY and 144% QoQ
 
Ceat Q1FY15: Higher opex impact margins; Book profits
 Ceat Q1FY15: Higher opex impact margins; Book profits Ceat Q1FY15: Higher opex impact margins; Book profits
Ceat Q1FY15: Higher opex impact margins; Book profits
 
ENIL 1QFY18
ENIL 1QFY18ENIL 1QFY18
ENIL 1QFY18
 
Entertainment Network Ltd: Stock Price & Q4 Results Of Entertainment Network ...
Entertainment Network Ltd: Stock Price & Q4 Results Of Entertainment Network ...Entertainment Network Ltd: Stock Price & Q4 Results Of Entertainment Network ...
Entertainment Network Ltd: Stock Price & Q4 Results Of Entertainment Network ...
 
Q2FY15: Hold Mahindra & Mahindra Financial Services - Nirmal Bang
Q2FY15: Hold Mahindra & Mahindra Financial Services - Nirmal BangQ2FY15: Hold Mahindra & Mahindra Financial Services - Nirmal Bang
Q2FY15: Hold Mahindra & Mahindra Financial Services - Nirmal Bang
 
Ongc ru2 qfy2011-291010
Ongc ru2 qfy2011-291010Ongc ru2 qfy2011-291010
Ongc ru2 qfy2011-291010
 
Zydus Wellness reports a subdued quarter, hold - Nirmal Bang
Zydus Wellness reports a subdued quarter, hold - Nirmal BangZydus Wellness reports a subdued quarter, hold - Nirmal Bang
Zydus Wellness reports a subdued quarter, hold - Nirmal Bang
 
Vaibhav Global Q1FY15: Outlook continues to remain positive; Hold
 Vaibhav Global Q1FY15: Outlook continues to remain positive; Hold Vaibhav Global Q1FY15: Outlook continues to remain positive; Hold
Vaibhav Global Q1FY15: Outlook continues to remain positive; Hold
 
CTEEP Results Presentation 2T15
CTEEP Results Presentation 2T15CTEEP Results Presentation 2T15
CTEEP Results Presentation 2T15
 
Stock Market Report For Investors -Sai Proficient
Stock Market Report For Investors -Sai ProficientStock Market Report For Investors -Sai Proficient
Stock Market Report For Investors -Sai Proficient
 
HeidelbergCement Q2 2018 Presentation
HeidelbergCement Q2 2018 PresentationHeidelbergCement Q2 2018 Presentation
HeidelbergCement Q2 2018 Presentation
 
Transnet annual results 2015
Transnet annual results 2015Transnet annual results 2015
Transnet annual results 2015
 
Analyst presentation H1 2016
Analyst presentation H1 2016Analyst presentation H1 2016
Analyst presentation H1 2016
 
Britannia Industries 1QFY15 results ahead of estimate; buy - Motilal Oswal
Britannia Industries 1QFY15 results ahead of estimate; buy - Motilal OswalBritannia Industries 1QFY15 results ahead of estimate; buy - Motilal Oswal
Britannia Industries 1QFY15 results ahead of estimate; buy - Motilal Oswal
 
Colgate ru2 qfy2011-281010
Colgate  ru2 qfy2011-281010Colgate  ru2 qfy2011-281010
Colgate ru2 qfy2011-281010
 
JSW Energy Ltd. Q3 FY16 Result Update
JSW Energy Ltd. Q3 FY16 Result UpdateJSW Energy Ltd. Q3 FY16 Result Update
JSW Energy Ltd. Q3 FY16 Result Update
 
Global Digital Transformation Partner 2019
Global Digital Transformation Partner 2019Global Digital Transformation Partner 2019
Global Digital Transformation Partner 2019
 
Marico ru2 qfy2011-261010
Marico ru2 qfy2011-261010Marico ru2 qfy2011-261010
Marico ru2 qfy2011-261010
 
Ntpc 2 qfy11 result update - 271010
Ntpc   2 qfy11 result update - 271010Ntpc   2 qfy11 result update - 271010
Ntpc 2 qfy11 result update - 271010
 

Recently uploaded

The Economic History of the U.S. Lecture 30.pdf
The Economic History of the U.S. Lecture 30.pdfThe Economic History of the U.S. Lecture 30.pdf
The Economic History of the U.S. Lecture 30.pdfGale Pooley
 
(DIYA) Bhumkar Chowk Call Girls Just Call 7001035870 [ Cash on Delivery ] Pun...
(DIYA) Bhumkar Chowk Call Girls Just Call 7001035870 [ Cash on Delivery ] Pun...(DIYA) Bhumkar Chowk Call Girls Just Call 7001035870 [ Cash on Delivery ] Pun...
(DIYA) Bhumkar Chowk Call Girls Just Call 7001035870 [ Cash on Delivery ] Pun...ranjana rawat
 
Booking open Available Pune Call Girls Talegaon Dabhade 6297143586 Call Hot ...
Booking open Available Pune Call Girls Talegaon Dabhade  6297143586 Call Hot ...Booking open Available Pune Call Girls Talegaon Dabhade  6297143586 Call Hot ...
Booking open Available Pune Call Girls Talegaon Dabhade 6297143586 Call Hot ...Call Girls in Nagpur High Profile
 
The Economic History of the U.S. Lecture 25.pdf
The Economic History of the U.S. Lecture 25.pdfThe Economic History of the U.S. Lecture 25.pdf
The Economic History of the U.S. Lecture 25.pdfGale Pooley
 
Top Rated Pune Call Girls Viman Nagar ⟟ 6297143586 ⟟ Call Me For Genuine Sex...
Top Rated  Pune Call Girls Viman Nagar ⟟ 6297143586 ⟟ Call Me For Genuine Sex...Top Rated  Pune Call Girls Viman Nagar ⟟ 6297143586 ⟟ Call Me For Genuine Sex...
Top Rated Pune Call Girls Viman Nagar ⟟ 6297143586 ⟟ Call Me For Genuine Sex...Call Girls in Nagpur High Profile
 
Call Girls Service Nagpur Maya Call 7001035870 Meet With Nagpur Escorts
Call Girls Service Nagpur Maya Call 7001035870 Meet With Nagpur EscortsCall Girls Service Nagpur Maya Call 7001035870 Meet With Nagpur Escorts
Call Girls Service Nagpur Maya Call 7001035870 Meet With Nagpur Escortsranjana rawat
 
Call US 📞 9892124323 ✅ Kurla Call Girls In Kurla ( Mumbai ) secure service
Call US 📞 9892124323 ✅ Kurla Call Girls In Kurla ( Mumbai ) secure serviceCall US 📞 9892124323 ✅ Kurla Call Girls In Kurla ( Mumbai ) secure service
Call US 📞 9892124323 ✅ Kurla Call Girls In Kurla ( Mumbai ) secure servicePooja Nehwal
 
High Class Call Girls Nagpur Grishma Call 7001035870 Meet With Nagpur Escorts
High Class Call Girls Nagpur Grishma Call 7001035870 Meet With Nagpur EscortsHigh Class Call Girls Nagpur Grishma Call 7001035870 Meet With Nagpur Escorts
High Class Call Girls Nagpur Grishma Call 7001035870 Meet With Nagpur Escortsranjana rawat
 
WhatsApp 📞 Call : 9892124323 ✅Call Girls In Chembur ( Mumbai ) secure service
WhatsApp 📞 Call : 9892124323  ✅Call Girls In Chembur ( Mumbai ) secure serviceWhatsApp 📞 Call : 9892124323  ✅Call Girls In Chembur ( Mumbai ) secure service
WhatsApp 📞 Call : 9892124323 ✅Call Girls In Chembur ( Mumbai ) secure servicePooja Nehwal
 
06_Joeri Van Speybroek_Dell_MeetupDora&Cybersecurity.pdf
06_Joeri Van Speybroek_Dell_MeetupDora&Cybersecurity.pdf06_Joeri Van Speybroek_Dell_MeetupDora&Cybersecurity.pdf
06_Joeri Van Speybroek_Dell_MeetupDora&Cybersecurity.pdfFinTech Belgium
 
CALL ON ➥8923113531 🔝Call Girls Gomti Nagar Lucknow best sexual service
CALL ON ➥8923113531 🔝Call Girls Gomti Nagar Lucknow best sexual serviceCALL ON ➥8923113531 🔝Call Girls Gomti Nagar Lucknow best sexual service
CALL ON ➥8923113531 🔝Call Girls Gomti Nagar Lucknow best sexual serviceanilsa9823
 
Instant Issue Debit Cards - School Designs
Instant Issue Debit Cards - School DesignsInstant Issue Debit Cards - School Designs
Instant Issue Debit Cards - School Designsegoetzinger
 
05_Annelore Lenoir_Docbyte_MeetupDora&Cybersecurity.pptx
05_Annelore Lenoir_Docbyte_MeetupDora&Cybersecurity.pptx05_Annelore Lenoir_Docbyte_MeetupDora&Cybersecurity.pptx
05_Annelore Lenoir_Docbyte_MeetupDora&Cybersecurity.pptxFinTech Belgium
 
Log your LOA pain with Pension Lab's brilliant campaign
Log your LOA pain with Pension Lab's brilliant campaignLog your LOA pain with Pension Lab's brilliant campaign
Log your LOA pain with Pension Lab's brilliant campaignHenry Tapper
 
The Economic History of the U.S. Lecture 18.pdf
The Economic History of the U.S. Lecture 18.pdfThe Economic History of the U.S. Lecture 18.pdf
The Economic History of the U.S. Lecture 18.pdfGale Pooley
 
The Economic History of the U.S. Lecture 23.pdf
The Economic History of the U.S. Lecture 23.pdfThe Economic History of the U.S. Lecture 23.pdf
The Economic History of the U.S. Lecture 23.pdfGale Pooley
 
TEST BANK For Corporate Finance, 13th Edition By Stephen Ross, Randolph Weste...
TEST BANK For Corporate Finance, 13th Edition By Stephen Ross, Randolph Weste...TEST BANK For Corporate Finance, 13th Edition By Stephen Ross, Randolph Weste...
TEST BANK For Corporate Finance, 13th Edition By Stephen Ross, Randolph Weste...ssifa0344
 
Call Girls Koregaon Park Call Me 7737669865 Budget Friendly No Advance Booking
Call Girls Koregaon Park Call Me 7737669865 Budget Friendly No Advance BookingCall Girls Koregaon Park Call Me 7737669865 Budget Friendly No Advance Booking
Call Girls Koregaon Park Call Me 7737669865 Budget Friendly No Advance Bookingroncy bisnoi
 

Recently uploaded (20)

The Economic History of the U.S. Lecture 30.pdf
The Economic History of the U.S. Lecture 30.pdfThe Economic History of the U.S. Lecture 30.pdf
The Economic History of the U.S. Lecture 30.pdf
 
(DIYA) Bhumkar Chowk Call Girls Just Call 7001035870 [ Cash on Delivery ] Pun...
(DIYA) Bhumkar Chowk Call Girls Just Call 7001035870 [ Cash on Delivery ] Pun...(DIYA) Bhumkar Chowk Call Girls Just Call 7001035870 [ Cash on Delivery ] Pun...
(DIYA) Bhumkar Chowk Call Girls Just Call 7001035870 [ Cash on Delivery ] Pun...
 
Booking open Available Pune Call Girls Talegaon Dabhade 6297143586 Call Hot ...
Booking open Available Pune Call Girls Talegaon Dabhade  6297143586 Call Hot ...Booking open Available Pune Call Girls Talegaon Dabhade  6297143586 Call Hot ...
Booking open Available Pune Call Girls Talegaon Dabhade 6297143586 Call Hot ...
 
The Economic History of the U.S. Lecture 25.pdf
The Economic History of the U.S. Lecture 25.pdfThe Economic History of the U.S. Lecture 25.pdf
The Economic History of the U.S. Lecture 25.pdf
 
(INDIRA) Call Girl Mumbai Call Now 8250077686 Mumbai Escorts 24x7
(INDIRA) Call Girl Mumbai Call Now 8250077686 Mumbai Escorts 24x7(INDIRA) Call Girl Mumbai Call Now 8250077686 Mumbai Escorts 24x7
(INDIRA) Call Girl Mumbai Call Now 8250077686 Mumbai Escorts 24x7
 
Top Rated Pune Call Girls Viman Nagar ⟟ 6297143586 ⟟ Call Me For Genuine Sex...
Top Rated  Pune Call Girls Viman Nagar ⟟ 6297143586 ⟟ Call Me For Genuine Sex...Top Rated  Pune Call Girls Viman Nagar ⟟ 6297143586 ⟟ Call Me For Genuine Sex...
Top Rated Pune Call Girls Viman Nagar ⟟ 6297143586 ⟟ Call Me For Genuine Sex...
 
Call Girls Service Nagpur Maya Call 7001035870 Meet With Nagpur Escorts
Call Girls Service Nagpur Maya Call 7001035870 Meet With Nagpur EscortsCall Girls Service Nagpur Maya Call 7001035870 Meet With Nagpur Escorts
Call Girls Service Nagpur Maya Call 7001035870 Meet With Nagpur Escorts
 
Call US 📞 9892124323 ✅ Kurla Call Girls In Kurla ( Mumbai ) secure service
Call US 📞 9892124323 ✅ Kurla Call Girls In Kurla ( Mumbai ) secure serviceCall US 📞 9892124323 ✅ Kurla Call Girls In Kurla ( Mumbai ) secure service
Call US 📞 9892124323 ✅ Kurla Call Girls In Kurla ( Mumbai ) secure service
 
High Class Call Girls Nagpur Grishma Call 7001035870 Meet With Nagpur Escorts
High Class Call Girls Nagpur Grishma Call 7001035870 Meet With Nagpur EscortsHigh Class Call Girls Nagpur Grishma Call 7001035870 Meet With Nagpur Escorts
High Class Call Girls Nagpur Grishma Call 7001035870 Meet With Nagpur Escorts
 
WhatsApp 📞 Call : 9892124323 ✅Call Girls In Chembur ( Mumbai ) secure service
WhatsApp 📞 Call : 9892124323  ✅Call Girls In Chembur ( Mumbai ) secure serviceWhatsApp 📞 Call : 9892124323  ✅Call Girls In Chembur ( Mumbai ) secure service
WhatsApp 📞 Call : 9892124323 ✅Call Girls In Chembur ( Mumbai ) secure service
 
06_Joeri Van Speybroek_Dell_MeetupDora&Cybersecurity.pdf
06_Joeri Van Speybroek_Dell_MeetupDora&Cybersecurity.pdf06_Joeri Van Speybroek_Dell_MeetupDora&Cybersecurity.pdf
06_Joeri Van Speybroek_Dell_MeetupDora&Cybersecurity.pdf
 
Commercial Bank Economic Capsule - April 2024
Commercial Bank Economic Capsule - April 2024Commercial Bank Economic Capsule - April 2024
Commercial Bank Economic Capsule - April 2024
 
CALL ON ➥8923113531 🔝Call Girls Gomti Nagar Lucknow best sexual service
CALL ON ➥8923113531 🔝Call Girls Gomti Nagar Lucknow best sexual serviceCALL ON ➥8923113531 🔝Call Girls Gomti Nagar Lucknow best sexual service
CALL ON ➥8923113531 🔝Call Girls Gomti Nagar Lucknow best sexual service
 
Instant Issue Debit Cards - School Designs
Instant Issue Debit Cards - School DesignsInstant Issue Debit Cards - School Designs
Instant Issue Debit Cards - School Designs
 
05_Annelore Lenoir_Docbyte_MeetupDora&Cybersecurity.pptx
05_Annelore Lenoir_Docbyte_MeetupDora&Cybersecurity.pptx05_Annelore Lenoir_Docbyte_MeetupDora&Cybersecurity.pptx
05_Annelore Lenoir_Docbyte_MeetupDora&Cybersecurity.pptx
 
Log your LOA pain with Pension Lab's brilliant campaign
Log your LOA pain with Pension Lab's brilliant campaignLog your LOA pain with Pension Lab's brilliant campaign
Log your LOA pain with Pension Lab's brilliant campaign
 
The Economic History of the U.S. Lecture 18.pdf
The Economic History of the U.S. Lecture 18.pdfThe Economic History of the U.S. Lecture 18.pdf
The Economic History of the U.S. Lecture 18.pdf
 
The Economic History of the U.S. Lecture 23.pdf
The Economic History of the U.S. Lecture 23.pdfThe Economic History of the U.S. Lecture 23.pdf
The Economic History of the U.S. Lecture 23.pdf
 
TEST BANK For Corporate Finance, 13th Edition By Stephen Ross, Randolph Weste...
TEST BANK For Corporate Finance, 13th Edition By Stephen Ross, Randolph Weste...TEST BANK For Corporate Finance, 13th Edition By Stephen Ross, Randolph Weste...
TEST BANK For Corporate Finance, 13th Edition By Stephen Ross, Randolph Weste...
 
Call Girls Koregaon Park Call Me 7737669865 Budget Friendly No Advance Booking
Call Girls Koregaon Park Call Me 7737669865 Budget Friendly No Advance BookingCall Girls Koregaon Park Call Me 7737669865 Budget Friendly No Advance Booking
Call Girls Koregaon Park Call Me 7737669865 Budget Friendly No Advance Booking
 

NTPC Ltd.Q2FY Result Update

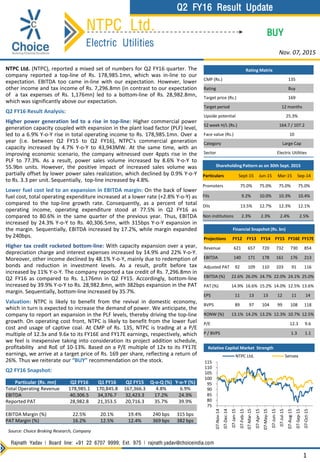
  • 1. NTPC Ltd. Electric Utilities BUY Relative Capital Market Strength NTPC Ltd. (NTPC), reported a mixed set of numbers for Q2 FY16 quarter. The company reported a top-line of Rs. 178,985.1mn, which was in-line to our expectation. EBITDA too came in-line with our expectation. However, lower other income and tax income of Rs. 7,296.8mn (in contrast to our expectation of a tax expenses of Rs. 1,176mn) led to a bottom-line of Rs. 28,982.8mn, which was significantly above our expectation. Q2 FY16 Result Analysis: Higher power generation led to a rise in top-line: Higher commercial power generation capacity coupled with expansion in the plant load factor (PLF) level, led to a 6.9% Y-o-Y rise in total operating income to Rs. 178,985.1mn. Over a year (i.e. between Q2 FY15 to Q2 FY16), NTPC’s commercial generation capacity increased by 4.7% Y-o-Y to 43,943MW. At the same time, with an improving economic scenario, the company witnessed over 4ppts rise in the PLF to 77.3%. As a result, power sales volume increased by 8.6% Y-o-Y to 55.9bn units. However, the positive impact of increased sales volume was partially offset by lower power sales realization, which declined by 0.9% Y-o-Y to Rs. 3.3 per unit. Sequentially, top-line increased by 4.8%. Lower fuel cost led to an expansion in EBITDA margin: On the back of lower fuel cost, total operating expenditure increased at a lower rate (+2.8% Y-o-Y) as compared to the top-line growth rate. Consequently, as a percent of total operating income, operating expenditure stood at 77.5% in Q2 FY16 as compared to 80.6% in the same quarter of the previous year. Thus, EBITDA increased by 24.3% Y-o-Y to Rs. 40,306.5mn, with 315bps Y-o-Y expansion in the margin. Sequentially, EBITDA increased by 17.2%, while margin expanded by 240bps. Higher tax credit rocketed bottom-line: With capacity expansion over a year, depreciation charge and interest expenses increased by 14.9% and 22% Y-o-Y. Moreover, other income declined by 48.1% Y-o-Y, mainly due to redemption of bonds and reduction in investment levels. As a result, profit before tax increased by 11% Y-o-Y. The company reported a tax credit of Rs. 7,296.8mn in Q2 FY16 as compared to Rs. 1,176mn in Q2 FY15. Accordingly, bottom-line increased by 39.9% Y-o-Y to Rs. 28,982.8mn, with 382bps expansion in the PAT margin. Sequentially, bottom-line increased by 35.7%. Valuation: NTPC is likely to benefit from the revival in domestic economy, which in turn is expected to increase the demand of power. We anticipate, the company to report an expansion in the PLF levels, thereby driving the top-line growth. On operating cost front, NTPC is likely to benefit from the lower fuel cost and usage of captive coal. At CMP of Rs. 135, NTPC is trading at a P/E multiple of 12.3x and 9.6x to its FY16E and FY17E earnings, respectively, which we feel is inexpensive taking into consideration its project addition schedule, profitability and RoE of 10-13%. Based on a P/E multiple of 12x to its FY17E earnings, we arrive at a target price of Rs. 169 per share, reflecting a return of 26%. Thus we reiterate our “BUY” recommendation on the stock. Q2 FY16 Snapshot: Rajnath Yadav | Board line: +91 22 6707 9999; Ext. 975 | rajnath.yadav@choiceindia.com 1 Nov. 07, 2015 Rating Matrix CMP (Rs.) 135 Rating Buy Target price (Rs.) 169 Target period 12 months Upside potential 25.3% 52 week H/L (Rs.) 164.7 / 107.2 Face value (Rs.) 10 Category Large Cap Sector Electric Utilities Shareholding Pattern as on 30th Sept. 2015 Particulars Sept-15 Jun-15 Mar-15 Sep-14 Promoters 75.0% 75.0% 75.0% 75.0% FIIs 9.2% 10.0% 10.3% 10.4% DIIs 13.5% 12.7% 12.3% 12.1% Non institutions 2.3% 2.3% 2.4% 2.5% Q2 FY16 Result Update Financial Snapshot (Rs. bn) Projections FY12 FY13 FY14 FY15 FY16E FY17E Revenue 621 657 720 732 730 854 EBITDA 140 171 178 161 176 213 Adjusted PAT 92 109 110 103 91 116 EBITDA (%) 22.6% 26.0% 24.7% 22.0% 24.1% 25.0% PAT (%) 14.9% 16.6% 15.2% 14.0% 12.5% 13.6% EPS 11 13 13 12 11 14 BVPS 89 97 104 99 108 118 RONW (%) 13.1% 14.2% 13.2% 12.3% 10.7% 12.5% P/E 12.3 9.6 P / BVPS 1.3 1.1 Source: Choice Broking Research, Company 75 80 85 90 95 100 105 110 115 07-Nov-14 07-Dec-14 07-Jan-15 07-Feb-15 07-Mar-15 07-Apr-15 07-May-15 07-Jun-15 07-Jul-15 07-Aug-15 07-Sep-15 07-Oct-15 NTPC Ltd. Sensex Particular (Rs. mn) Q2 FY16 Q1 FY16 Q2 FY15 Q-o-Q (%) Y-o-Y (%) Total Operating Revenue 178,985.1 170,845.8 167,366.3 4.8% 6.9% EBITDA 40,306.5 34,376.7 32,423.3 17.2% 24.3% Reported PAT 28,982.8 21,353.5 20,716.3 35.7% 39.9% EBITDA Margin (%) 22.5% 20.1% 19.4% 240 bps 315 bps PAT Margin (%) 16.2% 12.5% 12.4% 369 bps 382 bps
  • 2. BUY 2 Q2 FY16 Quarter Performance: Source: Choice Broking Research, Company Q2 FY16 Segmental Details: Source: Choice Broking Research, Company NTPC Ltd. Electric Utilities Nov. 07, 2015 Q2 FY16 Result Update Particulars (Rs. mn) Q2 FY16 Q1 FY16 Q2 FY15 Q-o-Q (%) Y-o-Y (%) Total Operating Income 178,985.1 170,845.8 167,366.3 4.8% 6.9% Total Operating Expenditure (138,678.6) (136,469.1) (134,943.0) 1.6% 2.8% EBITDA 40,306.5 34,376.7 32,423.3 17.2% 24.3% Depreciation (13,229.1) (12,379.5) (11,515.8) 6.9% 14.9% EBIT 27,077.4 21,997.2 20,907.5 23.1% 29.5% Interest Expenses (8,145.3) (7,308.8) (6,674.1) 11.4% 22.0% Other Income 2,753.9 2,387.2 5,306.9 15.4% -48.1% Profit Before Tax (PBT) 21,686.0 17,075.6 19,540.3 27.0% 11.0% Tax Expenses 7,296.8 4,277.9 1,176.0 70.6% 520.5% Adjusted PAT 28,982.8 21,353.5 20,716.3 35.7% 39.9% Basic EPS (Rs.) 3.5 2.6 2.5 35.5% 39.8% Diluted EPS (Rs.) 3.5 2.6 2.5 35.5% 39.8% EBITDA Margin (%) 22.5% 20.1% 19.4% 240 bps 315 bps Reported PAT Margin (%) 16.2% 12.5% 12.4% 369 bps 382 bps Q2 FY16 Q1 FY16 Q2 FY15 Q-o-Q (%) Y-o-Y (%) Segmental Revenue (Rs. mn) Generation 179,502.8 171,173.1 167,828.7 4.9% 7.0% Others 270.1 237.1 228.6 13.9% 18.2% Total Revenue 179,772.9 171,410.2 168,057.3 4.9% 7.0% Segmental EBIT Break-up (Rs. mn) Generation 31,093.0 25,249.6 24,240.5 23.1% 28.3% Others (270.2) (20.7) 36.7 1205.3% -836.2% Total EBIT 30,822.8 25,228.9 24,277.2 22.2% 27.0%
  • 3. BUY 3 Q1 FY16 Other Operating Parameters: Source: Choice Broking Research, Company NTPC Ltd. Electric Utilities Nov. 07, 2015 Q2 FY16 Result Update Other Operating Parameters Particular (Rs. mn) Q2 FY15 Q3 FY15 Q4 FY15 Q1 FY16 Q2 FY16 Q-o-Q (%) Y-o-Y (%) Group Installed Capacity (MW) 43,128 43,143 44,398 45,048 45,548 1.1% 5.6% NTPC Commercial Capacity (MW) 36,467 37,142 37,142 37,142 37,942 2.2% 4.0% Group Commercial Capacity (MW) 41,968 42,643 43,143 43,143 43,943 1.9% 4.7% NTPC Coal PLF (%) 73.2% 80.8% 82.7% 77.6% 77.3% (31) bps 407 bps NTPC Gas PLF (%) 33.4% 31.8% 26.7% 28.5% 25.7% (274) bps (765) bps NTPC Coal PAF (%) 76.8% 91.0% 97.2% 91.6% 88.1% (352) bps 1,130 bps NTPC Gas PAF (%) 89.1% 93.2% 96.5% 96.6% 97.6% 100 bps 851 bps Gross Generation (mn Units) 55,421 61,310 61,313 58,696 60,159 2.5% 8.5% Commercial Generation (mn Units) 55,252 61,139 61,313 58,482 59,847 2.3% 8.3% Energy Sent Out (mn Units) 51,465 57,216 57,385 54,475 55,891 2.6% 8.6% Domestic Coal Supply (mn tonnes) 33.92 39.61 41.06 38.39 34.62 -9.8% 2.1% Imported Coal Supply (mn tonnes) 2.88 4.93 4.89 3.86 2.56 -33.7% -11.1% Total Coal Consumption (mn tonnes) 36.80 44.54 45.95 42.25 37.18 -12.0% 1.0% Gas Consumption (mmscmd) 6.68 6.12 5.62 5.88 5.13 -12.8% -23.2% Average Tariff (Rs. per Unit) 3.32 3.26 3.34 3.26 3.29 0.9% -0.9% Average Fuel Cost (Rs. Per unit) 2.22 2.12 2.18 2.11 2.06 -2.3% -7.1% Regulated Equity (Rs. mn) 352,075 366,177 369,163 369,000 389,120 5.5% 10.5% Conference Call Highlights: • During the quarter, NTPC commercialized 800MW of its hydro power generation capacity and operated it at 83.3% PLF level. Moreover, in Oct. 2015, the company commercialized 500MW generation capacity at Vindhyachal Super Thermal Power Station. This thermal power plant is entitled to earn additional return on equity of 0.5% (i.e. 16%), as it was synchronized and commissioned well before the commercial date of operations. • In Sept. 2015, the company appointed M/s. Thriveni- Sainik JV as mine developer cum operator for Pakri Barwadih Coal Mining Project for a period of 27 years. Peak annual production from the mine is likely to be 15mn tonnes. Commercial mining operations is expected to start in current fiscal. • Adjusted profit for the quarter increased by 24.2% Y-o-Y to Rs. 22,165.2mn as against Rs. 17844mn in Q2 FY15. • Regulated equity during the quarter stood at Rs. 3,89,120mn. NTPC has raised the standalone capex guidance for FY16 from Rs. 230bn to Rs. 250bn.
  • 4. 4 Financial Statement Source: Choice Broking Research Source: Choice Broking Research BUYNTPC Ltd. Electric Utilities Profit and Loss Statement Projections (Rs. mn) FY12 FY13 FY14 FY15 FY16E FY17E Total Operating Income 620,522 656,916 720,193 732,461 729,972 853,692 Revenue Growth Rate (%) 9.0% 5.9% 9.6% 1.7% -0.3% 16.9% Total Expenditure (480,124) (485,947) (542,275) (571,605) (554,122) (640,249) EBITDA 140,399 170,969 177,918 160,856 175,851 213,442 EBITDA Growth Rate (%) 2.9% 21.8% 4.1% -9.6% 9.3% 21.4% EBITDA Margin (%) 22.6% 26.0% 24.7% 22.0% 24.1% 25.0% Depreciation (27,917) (33,968) (41,422) (49,117) (54,417) (61,787) EBIT 112,482 137,001 136,496 111,740 121,434 151,656 Interest (17,116) (19,244) (24,066) (27,436) (29,432) (32,547) Other Income 27,897 31,188 26,620 21,163 19,809 20,360 Exceptional Item 0 16,841 0 0 0 0 PBT 123,262 165,786 139,050 105,467 111,811 139,469 Income Tax Expenses (31,024) (39,592) (29,299) (2,558) (20,794) (23,061) PAT 92,237 126,194 109,751 102,909 91,018 116,408 PAT Growth Rate (%) 1.3% 18.6% 0.4% -6.2% -11.6% 27.9% PAT Margin (%) 14.9% 16.6% 15.2% 14.0% 12.5% 13.6% Balance Sheet Projections (Rs. mn) FY12 FY13 FY14 FY15 FY16E FY17E Share Capital 82,455 82,455 82,455 82,455 82,455 82,455 Reserves And Surplus 650,457 721,421 775,699 734,119 804,203 893,837 Deferred Revenue 14,301 12,441 16,099 13,942 13,942 13,942 Long-Term Borrowings 459,083 532,537 624,058 785,323 820,470 869,711 Deferred Tax Liabilities (Net) 6,369 9,153 10,516 9,791 8,163 9,547 Other Long-Term Liabilities 17,291 19,698 25,125 28,866 28,866 28,866 Long-Term Provisions 6,037 7,399 8,794 11,157 8,512 9,955 Short-Term Borrowings 0 0 0 0 141,772 165,800 Trade Payables 44,607 51,324 64,296 59,532 37,747 44,385 Other Current Liabilities 95,372 104,693 115,476 168,076 122,522 143,287 Short-Term Provisions 32,337 70,045 73,026 77,588 76,392 89,340 Total Liabilities 1,408,307 1,611,165 1,795,542 1,970,847 2,145,042 2,351,124 Tangilble Assets 450,445 626,874 718,659 742,393 993,055 1,222,216 Intangible Assets 2,119 2,487 2,450 46,097 0 0 CWIP 418,278 371,094 448,867 564,935 488,447 410,844 Intangible Assets Under Development 0 0 19 0 0 0 Non-Current Investments 95,839 91,376 81,209 71,541 71,541 71,541 Long Term Loans And Advances 53,944 96,334 127,773 155,279 155,279 155,279 Other Non Current Assets 13,719 14,912 17,868 16,968 16,968 16,968 Current Investments 16,225 16,225 16,370 18,781 18,781 18,781 Inventories 37,029 40,572 53,734 74,530 69,997 77,183 Trade Receivables 58,325 53,650 52,201 76,044 77,997 86,539 Cash And Bank Balances 161,418 168,677 153,114 128,788 141,772 165,800 Short-Term Loans And Advances 15,433 17,456 31,160 24,076 24,076 24,076 Other Current Assets 85,534 111,508 92,120 51,416 87,131 101,898 Total Assets 1,408,307 1,611,165 1,795,542 1,970,847 2,145,042 2,351,124 Nov. 07, 2015 Q2 FY16 Result Update
  • 5. 5 Financial Statement (Contd…) Source: Choice Broking Research Source: Choice Broking Research BUYNTPC Ltd. Electric Utilities Cash Flow Statement Projections (Rs. mn) FY12 FY13 FY14 FY15 FY16E FY17E Profit Before Tax 123,262 165,786 139,050 105,467 111,811 139,469 Depreciation and Amortization 27,917 33,968 41,422 49,117 54,417 61,787 Other Adjustments (11,286) (9,875) 5,335 14,629 12,869 15,937 Change in Working Capital (22,071) (5,971) (2,919) (7,665) (105,942) 12,683 Income Tax Paid (10,723) (28,956) (25,563) (19,199) (20,794) (23,061) Cash Flow from Operating Activities 107,099 154,952 157,325 142,347 52,362 206,815 CAPEX (107,944) (162,967) (167,397) (171,283) (182,493) (213,423) Change in Investments 18,039 16,225 16,225 16,370 0 0 Others 11,100 6,573 11,375 9,287 16,563 16,563 Cash Flow from Investing Activities (78,805) (140,169) (139,797) (145,626) (165,930) (196,860) Net Change in Borrowings 52,135 72,624 73,732 186,092 176,918 73,270 Interest Expenses (38,851) (38,315) (47,414) (55,863) (29,432) (32,547) Dividend & Dividend Tax (41,146) (40,688) (57,881) (147,968) (20,934) (26,774) Others (829) (1,146) (1,527) (1,042) 0 124 Cash Flow from Financing Activities (28,691) (7,524) (33,090) (18,781) 126,552 14,073 Net Cash Inflow / Outflow (398) 7,259 (15,562) (22,060) 12,984 24,028 Opening Cash & Cash Equivalents 161,853 161,418 168,677 153,114 128,788 141,772 Closing Cash & Cash Equivalent 161,455 168,677 153,115 131,054 141,772 165,800 Financial Ratios Particulars FY12 FY13 FY14 FY15 FY16E FY17E Profitability & Return Ratios EBITDA Margin (%) 22.6% 26.0% 24.7% 22.0% 24.1% 25.0% PAT Margin (%) 14.9% 16.6% 15.2% 14.0% 12.5% 13.6% RONW (%) 13.1% 14.2% 13.2% 12.3% 10.7% 12.5% RoCE (%) 9.6% 10.5% 9.3% 7.0% 6.8% 7.6% Working Capital & Liquidity Ratios Payables (Days) 26.6 29.1 32.8 29.9 29.1 29.5 Inventory (Days) 22.1 23.0 27.4 37.5 35.0 33.0 Receivables (Days) 34.8 30.4 26.6 38.2 39.0 37.0 Current Ratio (X) 2.1 1.7 1.5 1.2 1.7 1.6 Turnover & Leverage Ratios Fixed Asset Turnover (X) 0.8 0.7 0.7 0.6 0.5 0.5 Total Asset Turnover (X) 0.5 0.4 0.4 0.4 0.4 0.4 Debt Equity Ratio (X) 0.6 0.7 0.7 1 1.1 1.1 Dividend Pay Out Ratio 38.4% 32.0% 45.1% 120.2% 20.0% 20.0% DuPont Analysis 13.1% 16.4% 13.2% 12.3% 10.7% 12.5% Tax Burden (PAT / PBT) 0.7 0.8 0.8 1.0 0.8 0.8 Interest Burden (PBT / PBIT) 1.1 1.2 1.0 0.9 0.9 0.9 EBIT Margin 18.1% 20.9% 19.0% 15.3 16.6% 17.8% Total Asset Turnover Ratio (Net Sales / Total Asset) 0.5 0.4 0.4 0.4 0.4 0.4 Leverage Ratio (Total Asset / Total Equity) 1.9 2.0 2.0 2.2 2.4 2.4 Valuation Ratios DPS (Rs.) 4.3 4.2 6.0 15.0 2.2 2.8 BVPS (Rs.) 88.9 97.5 104.1 99.0 107.5 118.4 EPS (Rs. Cr) 11.2 13.3 13.3 12.5 11.0 14.1 P / E (X) 12.1 10.2 10.2 10.8 12.3 9.6 P / BVPS (X) 1.5 1.4 1.3 1.4 1.3 1.1 Nov. 07, 2015 Q2 FY16 Result Update
  • 6. e 6 Disclaimer This is solely for information of clients of Choice Broking and does not construe to be an investment advice. It is also not intended as an offer or solicitation for the purchase and sale of any financial instruments. Any action taken by you on the basis of the information contained herein is your responsibility alone and Choice Broking its subsidiaries or its employees or associates will not be liable in any manner for the consequences of such action taken by you. We have exercised due diligence in checking the correctness and authenticity of the information contained in this recommendation, but Choice Broking or any of its subsidiaries or associates or employees shall not be in any way responsible for any loss or damage that may arise to any person from any inadvertent error in the information contained in this recommendation or any action taken on basis of this information. This report is based on the fundamental analysis with a view to forecast future price. The Research analysts for this report certifies that all of the views expressed in this report accurately reflect his or her personal views about the subject company or companies and its or their securities, and no part of his or her compensation was, is or will be, directly or indirectly related to specific recommendations or views expressed in this report. Choice Broking has based this document on information obtained from sources it believes to be reliable but which it has not independently verified; Choice Broking makes no guarantee, representation or warranty and accepts no responsibility or liability as to its accuracy or completeness. The opinions contained within the report are based upon publicly available information at the time of publication and are subject to change without notice. The information and any disclosures provided herein are in summary form and have been prepared for informational purposes. The recommendations and suggested price levels are intended purely for stock market investment purposes. The recommendations are valid for the day of the report and will remain valid till the target period. The information and any disclosures provided herein may be considered confidential. Any use, distribution, modification, copying, forwarding or disclosure by any person is strictly prohibited. The information and any disclosures provided herein do not constitute a solicitation or offer to purchase or sell any security or other financial product or instrument. The current performance may be unaudited. Past performance does not guarantee future returns. There can be no assurance that investments will achieve any targeted rates of return, and there is no guarantee against the loss of your entire investment. POTENTIAL CONFLICT OF INTEREST DISCLOSURE (as on date of report) Disclosure of interest statement – • Analyst interest of the stock /Instrument(s): - No. • Firm interest of the stock / Instrument (s): - No. Choice’s Rating Rationale The price target for a large cap stock represents the value the analyst expects the stock to reach over next 12 months. For a stock to be classified as Outperform, the expected return must exceed the local risk free return by at least 5% over the next 12 months. For a stock to be classified as Underperform, the stock return must be below the local risk free return by at least 5% over the next 12 months. Stocks between these bands are classified as Neutral. Choice Equity Broking Pvt. Ltd. Choice House, Shree Shakambhari Corporate Park, Plt No: -156-158, J.B. Nagar, Andheri (East), Mumbai - 400 099. +91-022-6707 9999 +91-022-6707 9959 www.choiceindia.com Q2 FY16 Result Update Rating Legend Rating Upside BUY Absolute Return >15% Accumulate Absolute Return Between 10-15% Hold Absolute Return Between 0-10% Reduce Absolute Return 0 To Negative 10% Sell Absolute Return > Negative 10% Institutional Equity Team Name Designation Email id Contact No. Ajay Kejriwal President ajay@choiceindia.com 022- 6707 9850 Sumeet Bagadia Head of Research sumeet.bagadia@choiceindia.com 022 - 6707 9830 Amit Singh VP - Institutional Sales amit.singh@choiceindia.com 022 - 6707 9852 Devendra Gaikwad Sr. Manager - Institutional Sales devendra.gaikwad@choiceindia.com 022 - 6707 9877 Rajnath Yadav Research Analyst rajnath.yadav@choiceindia.com 022 - 6707 9975 Satish Kumar Research Analyst satish.kumar@choiceindia.com 022 - 6707 9974 Kunal Parmar Research Associate kunal.parmar@choiceindia.com 022 - 6707 9982 Amit Pathania Research Associate amit.pathania@choiceindia.com 022 - 6707 9979 Vikas Chaudhari Research Associate vikas.chaudhari@choiceindia.com 022 - 6707 9988 Trirashmi Ghoderao Research Advisor trirashmi.ghoderao@choiceindia.com 022 - 6707 9972 Neeraj Yadav Research Advisor Neeraj.yadav@choiceindia.com 022 - 6707 9988 NTPC Ltd. Date Recommendation CMP (Rs.) Target Price (Rs.) 07-Nov-2015 BUY 135 169 01-Aug-2015 BUY 135 169 23-Jul-2015 BUY 137 169