1. Anand Rathi Share and Stock Brokers Limited (hereinafter “ARSSBL”) is a full-service brokerage and equities-research firm and the views expressed therein are solely of
ARSSBL and not of the companies which have been covered in the Research Report. This report is intended for the sole use of the Recipient. Disclosures and analyst
certifications are present in the Appendix.
Anand Rathi Research India Equities
Technology
Company Update
India I Equities
Mohit Jain
Research Analyst
+9122 6626 6531
mohitjain@rathi.com
Shobit Singhal
Research Associate
+9122 6626 6511
shobitsinghal@rathi.com
Key financials (YE Mar) FY15 FY16 FY17 FY18e FY19e
Sales (` m) 10,126 5,253 5,609 7,537 8,213
Net profit (` m) 178 137 369 558 606
EPS (`) 7.6 5.6 15.2 22.4 24.4
Growth (%) -63.7 -26.1 172.7 47.5 8.6
PE (x) 46 60 22 15 14
PBV (x) 1 3 2 2 2
RoE (%) 3 3 11 15 15
RoCE (%) 4 4 13 17 18
Dividend yield (%) 1 1 1 1 1
Net debt/equity (x) 0 0 0 0 0
Source: Company, Anand Rathi Research
`
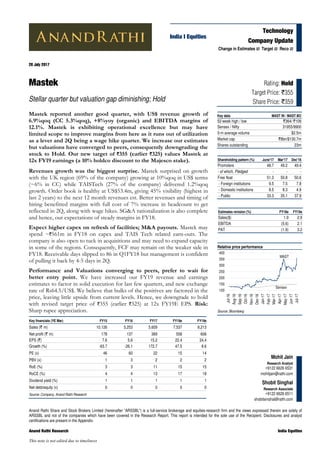
Rating: Hold
Target Price: `355
Share Price: `359
Key data MAST IN / MAST.BO
52-week high / low `364/ `109
Sensex / Nifty 31955/9900
3-m average volume $2.5m
Market cap `8bn/$130.7m
Shares outstanding 23m
Shareholding pattern (%) June'17 Mar'17 Dec'16
Promoters 48.7 49.2 49.4
- of which, Pledged - - -
Free float 51.3 50.8 50.6
- Foreign institutions 9.5 7.5 7.8
- Domestic institutions 8.5 8.3 4.9
- Public 33.3 35.1 37.9
20 July 2017
Mastek
Stellar quarter but valuation gap diminishing; Hold
Mastek reported another good quarter, with US$ revenue growth of
6.9%qoq (CC 5.3%qoq), +8%yoy (organic) and EBITDA margins of
12.1%. Mastek is exhibiting operational excellence but may have
limited scope to improve margins from here as it runs out of utilization
as a lever and 2Q being a wage hike quarter. We increase our estimates
but valuations have converged to peers, consequently downgrading the
stock to Hold. Our new target of `355 (earlier `325) values Mastek at
12x FY19 earnings (a 10% holdco discount to the Majesco stake).
Revenues growth was the biggest surprise. Mastek surprised on growth
with the UK region (69% of the company) growing at 10%qoq in US$ terms
(~6% in CC) while TAISTech (27% of the company) delivered 1.2%qoq
growth. Order book is healthy at US$53.4m, giving 45% visibility (highest in
last 2 years) to the next 12 month revenues est. Better revenues and timing of
hiring benefitted margins with full cost of 7% increase in headcount to get
reflected in 2Q, along with wage hikes. SG&A rationalization is also complete
and hence, our expectations of steady margins in FY18.
Expect higher capex on refresh of facilities; M&A payouts. Mastek may
spend ~`561m in FY18 on capex and TAIS Tech related earn-outs. The
company is also open to tuck in acquisitions and may need to expand capacity
in some of the regions. Consequently, FCF may remain on the weaker side in
FY18. Receivable days slipped to 86 in Q1FY18 but management is confident
of pulling it back by 4-5 days in 2Q.
Performance and Valuations converging to peers, prefer to wait for
better entry point. We have increased our FY19 revenue and earnings
estimates to factor in solid execution for last few quarters, and new exchange
rate of Rs64.5/US$. We believe that bulks of the positives are factored in the
price, leaving little upside from current levels. Hence, we downgrade to hold
with revised target price of `355 (earlier `325) at 12x FY19E EPS. Risk:
Sharp rupee appreciation.
Relative price performance
Source: Bloomberg
MAST
Sensex
100
150
200
250
300
350
400
Jul-16
Aug-16
Sep-16
Oct-16
Nov-16
Dec-16
Jan-17
Feb-17
Mar-17
Apr-17
May-17
Jun-17
Jul-17
Estimates revision (%) FY18e FY19e
Sales($) 1.9 2.9
EBITDA (5.6) 2.1
PAT (1.9) 3.2
Change in Estimates Target Reco
This note is not edited due to timeliness
4. 20 July 2017 Mastek – Stellar quarter but valuation gap diminishing; Hold
Anand Rathi Research 4
Conference Call Takeaways
Company
Implementing vision 2020-Targeting to be the leader in digital
transformation
Company continues to invest in digital space and endeavour to
maintain the momentum in coming quarters as well.
Fully invested with respect to cost structure and expect returns in next
3-5 quarters.
India business revenue is very miniscule for the company (contributed
~`63m in Q1FY18) and limited to only profitable segment.
Receivables days were higher in this quarter at 86 days mainly because
of timings and have already reverted back to normal levels.
Wage hike will happen in 2 phases, 1st phase from 1st July, 2017 has
been already done and will see impact in Q2FY18 margins. 2nd phase
will start from October onwards for senior management and have
impact on Q3FY18 margins.
Capex guidance for FY18- Investment in innovation and expansion
apart from normal capex on refresh and up gradation.
TAIS Tech rate of growth is very healthy in digital transformation
space. Current order book includes TAIS Tech orders as well.
Notes from the last two quarter conference calls
From Q4FY17
Organic growth can be maintained in FY18 as the two businesses have
a strong customer base in their regions. Mastek (excl. TAIS Tech) has a
very high repeat customer base and business, which can be leveraged
for growth.
From Q3FY17
New CEO John Cowen (UK-based) believes that growth can come
from all verticals and regions, given Mastek’s size and penetration.
There are no further step costs expected and management sees scope
for further margin expansion
5. 20 July 2017 Mastek – Stellar quarter but valuation gap diminishing; Hold
Anand Rathi Research 5
Factsheet
Fig 9 – Revenue by geography
(%) Q1FY17 Q2FY17 Q3FY17 Q4FY17 Q1FY18
North America 0 0 3 29 27
Continental Europe 95 92 91 68 69
India 5 8 6 4 3
APAC (RotW) 0 0 0 0 0
Source: Company
Fig 10 – Revenue by vertical
(%) Q1FY17 Q2FY17 Q3FY17 Q4FY17 Q1FY18
BFSI 27 29 27 16 19
Government 48 43 48 36 35
IT & Others 14 14 7 9 9
Retail 12 15 19 39 38
Source: Company
Fig 11 – Client Concentration
(%) Q1FY17 Q2FY17 Q3FY17 Q4FY17 Q1FY18
Top-5 Clients 53 52 53 38 41
Top-10 Clients 72 73 71 53 54
Source: Company
Fig 12 – Workforce
(%) Q1FY17 Q2FY17 Q3FY17 Q4FY17 Q1FY18
Technical 1,074 1,075 1,078 1,336 1,423
Technical Support 89 102 98 94 107
Marketing 43 43 44 45 47
Support 96 97 106 102 107
Utilization % (gross) 80 82 82 87 86
12 m Order Backlog ($ m) 32.4 32.9 33.6 49.7 53.4
Active Clients 92 91 87 159 161
Revenue per Active Client ($ m) 0.2 0.2 0.2 0.2 0.2
Source: Company
6. 20 July 2017 Mastek – Stellar quarter but valuation gap diminishing; Hold
Anand Rathi Research 6
Valuations
The stock trades at 12x FY19e EPS, adjusted for the value of
Mastek’s13.84% stake in the US-listed Majesco, at a 10% holdco discount.
We find this attractive, given the improvement in financial performance
over the last few quarters.
Mastek’s IT services division has suffered in the past, perhaps because of
the management’s twin focus on building the products and services
businesses. After the split, the company has focused on growing the IT
services business, though business concentration in terms of UK and the
Government business were key concerns. These got offset with the TAIS
acquisition; therefore, performance and consistency are expected to
improve in FY18 and beyond.
In Q1FY18, Mastek continued to raise its profitability and is now at 12.1%
margins (much ahead of KPIT, not too far from Mindtree at 11.1% for
1QFY18).
We value the core business at 12x FY19e EPS (compared to 10.5x earlier,
reflecting consistency in performance, improvement in profitability, and
less dependence on one region. We value Mastek’s investment in Majesco
at a 10% discount (from 15% earlier) to derive our target price of `355 (of
which `61 come from the Majesco stake).
Fig 13 – Change in estimates
FY18 FY19
New Old Chg % New Old Chg %
Revenues ($m) 117 115 1.9 127 124 2.9
Revenues (`m) 7,537 7,685 (1.9) 8,213 8,292 (0.9)
EBITDA (`m) 874 926 (5.6) 1,009 989 2.1
EBITDA Margin % 11.6% 12.1% -45 bps 12.3% 11.9% 36 bps
EBIT (`m) 665 791 (16.0) 765 831 (8.0)
EBIT Margin % 8.8% 10.3% -147 bps 9.3% 10.0% -71 bps
PBT 712 837 (14.9) 799 864 (7.4)
Net profit 558 569 (1.9) 606 587 3.2
Source: Anand Rathi Research
Fig 14 – PE band
Source: Bloomberg, Anand Rathi Research
Risks
Sharp rupee appreciation.
5.0
7.0
9.0
11.0
13.0
15.0
Mar-16
Apr-16
May-16
Jun-16
Jul-16
Aug-16
Sep-16
Oct-16
Nov-16
Dec-16
Jan-17
Feb-17
Mar-17
Apr-17
May-17
Jun-17
Jul-17
PERatio(1yearforward)
7. Appendix
Analyst Certification
The views expressed in this Research Report accurately reflect the personal views of the analyst(s) about the subject securities or issuers and no part of the
compensation of the research analyst(s) was, is, or will be directly or indirectly related to the specific recommendations or views expressed by the research
analyst(s) in this report. The research analysts are bound by stringent internal regulations and also legal and statutory requirements of the Securities and Exchange
Board of India (hereinafter “SEBI”) and the analysts’ compensation are completely delinked from all the other companies and/or entities of Anand Rathi, and have
no bearing whatsoever on any recommendation that they have given in the Research Report.
Important Disclosures on subject companies
Rating and Target Price History (as of 19 July 2017)
Date Rating
TP
(`)
Share
Price (`)
1 30-Dec-14 Buy 170 135
2 20-Apr-16 Hold 170 148
3 15-Jul-16 Hold 160 140
4 19-Oct-16 Hold 170 149
5 19-Dec-16 Buy 220 176
6 17-Jan-17 Buy 235 192
7 25-Apr-17 Buy 325 282
Anand Rathi Ratings Definitions
Analysts’ ratings and the corresponding expected returns take into account our definitions of Large Caps (>US$1bn) and Mid/Small Caps (<US$1bn) as described
in the Ratings Table below:
Ratings Guide (12 months)
Buy Hold Sell
Large Caps (>US$1bn) >15% 5-15% <5%
Mid/Small Caps (<US$1bn) >25% 5-25% <5%
Research Disclaimer and Disclosure inter-alia as required under Securities and Exchange Board of India (Research Analysts) Regulations, 2014
Anand Rathi Share and Stock Brokers Ltd. (hereinafter refer as ARSSBL) (Research Entity) is a subsidiary of Anand Rathi Financial Services Ltd. ARSSBL is a
corporate trading and clearing member of Bombay Stock Exchange Ltd, National Stock Exchange of India Ltd. (NSEIL), Multi Stock Exchange of India Ltd (MCX-
SX), United Stock Exchange and also depository participant with National Securities Depository Ltd (NSDL) and Central Depository Services Ltd. ARSSBL is
engaged in the business of Stock Broking, Depository Participant and Mutual Fund distributor.
The research analysts, strategists, or research associates principally responsible for the preparation of Anand Rathi research have received compensation based
upon various factors, including quality of research, investor client feedback, stock picking, competitive factors and firm revenues.
General Disclaimer: This Research Report (hereinafter called “Report”) is meant solely for use by the recipient and is not for circulation. This Report does not
constitute a personal recommendation or take into account the particular investment objectives, financial situations, or needs of individual clients. The
recommendations, if any, made herein are expression of views and/or opinions and should not be deemed or construed to be neither advice for the purpose of
purchase or sale of any security, derivatives or any other security through ARSSBL nor any solicitation or offering of any investment /trading opportunity on behalf
of the issuer(s) of the respective security (ies) referred to herein. These information / opinions / views are not meant to serve as a professional investment guide for
the readers. No action is solicited based upon the information provided herein. Recipients of this Report should rely on information/data arising out of their own
investigations. Readers are advised to seek independent professional advice and arrive at an informed trading/investment decision before executing any trades or
making any investments. This Report has been prepared on the basis of publicly available information, internally developed data and other sources believed by
ARSSBL to be reliable. ARSSBL or its directors, employees, affiliates or representatives do not assume any responsibility for, or warrant the accuracy,
completeness, adequacy and reliability of such information / opinions / views. While due care has been taken to ensure that the disclosures and opinions given are
fair and reasonable, none of the directors, employees, affiliates or representatives of ARSSBL shall be liable for any direct, indirect, special, incidental,
consequential, punitive or exemplary damages, including lost profits arising in any way whatsoever from the information / opinions / views contained in this Report.
The price and value of the investments referred to in this Report and the income from them may go down as well as up, and investors may realize losses on any
investments. Past performance is not a guide for future performance. ARSSBL does not provide tax advice to its clients, and all investors are strongly advised to
consult with their tax advisers regarding taxation aspects of any potential investment.
Opinions expressed are our current opinions as of the date appearing on this Research only. We do not undertake to advise you as to any change of our views
expressed in this Report. Research Report may differ between ARSSBL’s RAs and/ or ARSSBL’s associate companies on account of differences in research
methodology, personal judgment and difference in time horizons for which recommendations are made. User should keep this risk in mind and not hold ARSSBL,
its employees and associates responsible for any losses, damages of any type whatsoever.
Mastek
7
1
2 3 4
5
6
80
130
180
230
280
330
380
Dec-14
Jan-15
Mar-15
May-15
Jul-15
Sep-15
Nov-15
Jan-16
Mar-16
May-16
Jul-16
Sep-16
Nov-16
Jan-17
Mar-17
May-17
Jul-17