The Triple Threat | Article on Global Resession | Harsh Kumar
Exide 2 qfy2011ru-121010
1. 2QFY2011 Result Update | Auto Ancillary
October 12, 2010
Exide Industries NEUTRAL
CMP `172
Performance Highlights Target Price -
Y/E March (` cr) 2QFY2011 2QFY2010 % chg (yoy) Angel est. % diff. Investment Period -
Net sales 1,127.2 950.7 18.6 1,198.7 (6.0)
Other income 19.1 1.1 1,574.6 5.0 281.8 Stock Info
EBITDA 245.5 247.1 (0.7) 261.5 (6.1) Sector Auto Ancillary
EBITDA margin (%) 21.8 26.0 (421)bp 21.8 (4)bp Market Cap (` cr) 14,620
Reported PAT 212.9 149.7 42.3 0.0 0.0
Beta 0.74
Adjusted PAT 166.0 149.7 10.9 161.4 2.8
52 Week High / Low 180/96
For 2QFY2011, Exide reported a decent top-line performance, though it was Avg. Daily Volume 363,603
below our expectations. However, the company’s operating margins and net Face Value (`) 1
profit adjusted for one-time gains came largely in line with our estimates. BSE Sensex 20,203
We maintain our positive outlook on the battery industry due to changing
Nifty 6,091
demographics, which in turn will support secular consumption growth in Indian
Reuters Code EXID.BO
markets. However, owing to the recent run up in the stock price, we recommend
Neutral on the stock. Investors with a long-term perspective can consider investing Bloomberg Code EXID@IN
in the stock at lower levels.
Net sales up 18.6%; adj. net profit up 10.9%: For 2QFY2011, Exide reported
Shareholding Pattern (%)
below-expectation yoy growth of 18.6% in net sales to `1,127.2cr. Growth was
Promoters 46.0
aided by ~15% yoy growth in volumes. EBITDA margins declined by 421bp yoy,
MF / Banks / Indian Fls 26.6
which was in line with our estimate of 21.8%. Margins fell due to higher
raw-material costs and other expenditure. However, higher other income and FII / NRIs / OCBs 15.9
one-time gains of `46.9cr from transfer of leasehold land helped net profit to Indian Public / Others 11.5
grow by 42.3% yoy to `212.9cr (`149.7cr). Thus, adjusting for the one-time gain,
the bottom line grew 10.9% yoy to `166cr as against our estimate of `161.4cr.
Abs. (%) 3m 1yr 3yr
Outlook and valuation: We estimate Exide to post 22.5% revenue CAGR over
FY2010–12E, leading to a substantial 19.7% CAGR in the bottom line. At `172, Sensex 12.6 18.7 7.4
the stock is quoting at 21.5x FY2011E and 19x FY2012E earnings. Our fair value Exide Industries 29.8 78.5 158.5
for Exide works out to `174. Hence, we recommend Neutral on the stock. Owing
to Exide’s defensive appeal and healthy and consistent fundamentals, we value its
core operations at 17.3x (20% premium to historical average of 14.4x) its
FY2012E earnings at `157. We have valued Exide’s stake in ING Vysya at
`11/share on FY2012E NBAP and have assigned a value of `6/share to its lead
smelters (8x FY2012E PAT).
Key financials
Y/E March (` cr) FY2009 FY2010 FY2011E FY2012E
Net sales 3,393 3,794 4,768 5,697
% chg 19.3 11.8 25.7 19.5
Net profit 284 537 679 769
% chg 13.6 88.9 26.3 13.4
EBITDA (%) 16.1 23.5 21.9 21.6
EPS (`) 3.6 6.3 8.0 9.1 Vaishali Jajoo
P/E (x) 48.4 27.2 21.5 19.0 022-4040 3800 Ext: 344
P/BV (x) 11.3 6.7 5.4 4.3 vaishali.jajoo@angeltrade.com
RoE (%) 24.9 31.0 25.4 25.0
RoCE (%) 31.7 40.8 36.0 34.9 Yaresh Kothari
EV/Sales (x) 4.2 3.5 2.7 2.2 022-4040 3800 Ext: 313
EV/EBITDA (x) 26.0 15.0 12.5 10.3 yareshb.kothari@angeltrade.com
Source: Company, Angel Research
Please refer to important disclosures at the end of this report 1
2. Exide Industries | 2QFY2011 Result Update
Exhibit 1: 2QFY2011 performance
Y/E March (`cr) 2QFY11 2QFY10 % chg 1HFY11 1HFY10 % chg
Net sales 1,127 951 18.6 2,279 1,854 22.9
Consumption of RM 643 519 23.8 1,319 1,043 26.4
(% of sales) 57.0 54.6 57.9 56.3
Staff costs 66.0 59.2 11.6 133.8 112.9 18.6
(% of sales) 5.9 6.2 5.9 6.1
Purchases of TG 25.7 2.1 1,151.7 36.3 4.0 809.3
(% of sales) 2.3 0.2 1.6 0.2
Other expenses 147.1 123.0 19.6 281.9 237.7 18.6
(% of sales) 13.0 12.9 12.4 12.8
Total expenditure 882 704 25.3 1,771 1,398 26.7
Operating profit 245.5 247.1 (0.7) 508.7 456.6 11.4
OPM (%) 21.8 26.0 22.3 24.6
Interest 1.7 4.4 (61.6) 3.0 4.8 (36.9)
Depreciation 20.1 22.2 (9.1) 39.6 41.0 (3.4)
Other income 19.1 1.1 1,574.6 25.3 2.0 1,143.8
PBT (excl. extr. items) 242.8 221.7 9.5 491.3 412.8 19.0
Extr. Income/(Expense) 46.9 - - 46.9 - -
PBT (incl. extr. items) 195.8 221.7 (11.7) 444.4 412.8 7.7
(% of sales) 17.4 23.3 19.5 22.3
Provision for taxation 76.8 72.0 6.6 160.0 140.8 13.7
(% of PBT) 39.2 32.5 36.0 34.1
Reported PAT 212.9 149.7 42.3 378.3 272.1 39.0
PATM 18.9 15.7 16.6 14.7
Adj PAT 166.0 149.7 10.9 331.3 272.1 21.8
Adj. PATM 14.7 15.7 14.5 14.7
Equity capital (cr) 85.0 80.0 6.3 85.0 80.0 6.3
EPS (`) 2.5 1.9 33.9 4.5 3.4 30.9
Source: Company, Angel Research
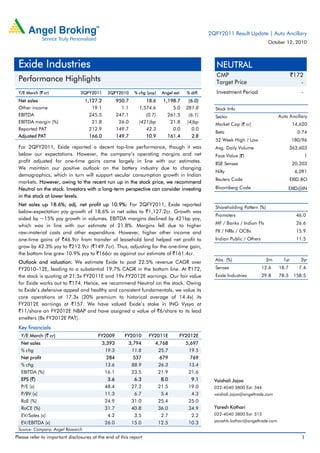
Net sales up 18.6%, lower than expectations: For 2QFY2011, Exide reported
18.6% yoy growth in net sales to `1,127.2cr (`950.7cr), which was below our
estimates of `1,198.7cr. Net sales growth was aided by ~15% yoy jump in
volumes. However, overall growth was restricted as the company was unable to
keep pace with the unprecedented surge in demand for auto batteries, mainly in
the motorcycle battery segment. Moreover, due to inadequate production capacity,
Exide channelised its production volumes to cater to the robust demand from
OEMs at the cost of reduced supplies in the replacement market, which impacted
its market share in the replacement segment. However, with the commissioning of
the Ahmednagar plant for motorcycle batteries and additional production lines at
Shamnagar and Haldia factories for four-wheeler batteries in September 2010,
Exide plans to meet the strong demand seen in the auto battery segment.
In the industrial battery segment, demand for telecom batteries continues to
remain subdued.
October 12, 2010 2
3. Exide Industries | 2QFY2011 Result Update
Exhibit 2: Net sales up 18.6%
(` cr) Net sales (LHS) yoy growth (RHS) (%)
1,400 35
27.5 30
1,200
28.9
25
1,000
20
800 18.6
15.9 15
600
10
400 5.6 5
200 (0.3) 0
0 (5)
1QFY10 2QFY10 3QFY10 4QFY10 1QFY11 2QFY11
Source: Company, Angel Research
EBITDA margins at 21.8%, down 421bp: During 2QFY2011, Exide witnessed a
421bp yoy decline in EBITDA margins owing to the 447bp yoy rise in raw-material
costs, which accounted for around 59.3% of sales (54.8% in 2QFY2010).
Raw-material costs were impacted, to a certain extent, by the increase in average
lead prices, which were up 6.1% yoy to US $2039/tonne. Margins were also down
due to the product mix, which was inclined towards OEMs during the quarter.
Priority given to OEM customers had a negative impact on the company’s margins,
as margins in the OEM segment are lower than the replacement segment’s
margins. Moreover, subdued realisation from telecom batteries affected operating
margins as industrial batteries command higher margins for the company.
However, with additional capacities in the two-wheeler and four-wheeler segments
likely to cater to the replacement segment, margins are expected to improve
going ahead.
Exhibit 3: Average lead prices up 6.1% yoy Exhibit 4: Raw-material cost and EBITDA margin trend
(US $/tonne) Lead inventory (RHS) Lead prices (LHS) (tonne) (%) EBITDA margin Raw material cost/sales
4,500 250,000 100
4,000
3,500 200,000
75
3,000 58.2 59.9 59.6 59.3
150,000 54.9 56.7
2,500
2,000 50
100,000
1,500 26.0
23.2 24.0 21.2 22.8 21.8
1,000 50,000 25
500
0 0
0
Sep- Sep- Sep- Sep- Sep- Sep- Sep- Sep- Sep- Sep-
01 02 03 04 05 06 07 08 09 10 1QFY10 2QFY10 3QFY10 4QFY10 1QFY11 2QFY11
Source: Company, Bloomberg, Angel Research Source: Company, Angel Research
During 2QFY2011, Exide acquired the remaining 49% stake in Leadage Alloys to
increase its stake to 100%. Total lead supplied by the captive smelter increased to
~50% in FY2010 and management plans to further increase sourcing from its
smelters to ~55% in FY2011E and ~70% by FY2012E.
October 12, 2010 3
4. Exide Industries | 2QFY2011 Result Update
Adjusted net profit grows 10.9%: Exide reported a 42.3% yoy increase in net profit
to `212.9cr (`149.7cr) during the quarter. Net profit growth was driven by higher
other income of `19.1cr (`1.1cr) and one-time gains of `46.9cr from transfer of
leasehold land. However, adjusting for the one-time gains of `46.9cr, net profit
grew 10.9% to `166cr marginally ahead of our estimates of `161.4cr. Lower
depreciation and tax rate also led to the increase in the bottom line
during the quarter.
Exhibit 5: Net profit up 10.9% yoy
(`cr) Net profit (LHS) Net profit margin (RHS) (%)
180 18
15.7
160 14.3 14.4 14.7 16
13.5 13.1
140 14
120 12
100 10
80 8
60 6
40 4
20 2
0 0
1QFY10 2QFY10 3QFY10 4QFY10 1QFY11 2QFY11
Source: Company, Angel Research
October 12, 2010 4
5. Exide Industries | 2QFY2011 Result Update
Investment arguments
Robust demand scenario for auto and industrial batteries: The auto and
industrial battery segments have been witnessing strong growth post the
economic downturn, driven by robust demand-pull on account of higher auto
and industrial production and increased consumer spending. We expect the
auto and industrial battery segments to continue to grow, generating robust
revenue CAGRs of ~21.3% and ~20.2%, respectively, over FY2010–12E.
Hence, we forecast Exide to register strong revenue CAGRs of 22.9% and
23.3% in the auto and industrial battery segments, respectively.
Market leader with wider reach and strong pricing power: Exide is a dominant
player in the auto battery (OEM and replacement) and industrial battery
segments with market share of 60–65% and 40–45%, respectively. Exide has
leveraged upon its brand equity, better-quality proposition and wider reach to
consolidate its position in the market, which gives the company a superior
pricing power compared to peers. Over the years, Exide has been able to
improve its realisation across the auto and industrial battery businesses, which
has more than offset the movements in input prices. We expect Exide to
continue to leverage upon its market leadership position and pricing power,
which would enhance the company’s ability to pass on cost increases in the
future as well. Hence, we expect average realisation to grow at a ~6% CAGR
over FY2010–12E.
Captive sourcing reduces impact of lead price volatility: Exide acquired
Tandon Metals and Leadage Alloys to recycle used lead and lessen the
vulnerability of rising lead prices. This has reduced the company's dependence
on imported lead in FY2010 to ~32% (~36% in FY2009). Total lead supplied
by the captive smelter increased to ~50% in FY2010 from ~35% in FY2009.
Exide has benefitted from its captive sourcing strategy, as lead sourcing from
captive smelters is 10–15% cheaper compared to market rates.
Going forward, Exide plans to further increase sourcing from its smelters to
~55% in FY2011E and ~70% by FY2012E. Hence, the company is expanding
its lead smelter capacity to 100,000tpa by March 2011. Our sensitivity
analysis suggests that for every 10% increase in sourcing from captive
smelters, the company’s EBITDA margins expand by ~50bp (assuming stable
lead prices).
Capacity expansion to increase volume growth: Exide has been operating at
~90% utilisation levels over the past five years. The company plans to increase
its battery capacity with an investment of `400cr in FY2011E to cater to the
growing demand. The company also plans to increase its two-wheeler and
four-wheeler battery capacity by 60% and 28%, respectively, by FY2011. As a
result of increased capacity, we believe Exide is well placed to meet the rising
auto battery demand. We estimate the overall utilisation level to remain at
78–80% in FY2012E. Further, we expect Exide to post volume CAGRs of
15.7% and 17.2% in the auto and industrial battery segments, respectively,
over FY2010–12E.
October 12, 2010 5
6. Exide Industries | 2QFY2011 Result Update
Outlook and valuation
We estimate Exide to post 22.5% revenue CAGR over FY2010–12E, leading to a
substantial 19.7% CAGR in the bottom line. Moreover, the company’s strong
brand image has been creating value, while continuously improving its RoCE, due
to better asset turnover on incremental capacities. We believe Exide will continue to
achieve higher return ratios and margins on the back of its superior pricing power
and assuming a stable input cost scenario. Going ahead, a strong balance sheet
and lower debt to equity ratio will aid the company in sustaining strong cash flows.
We have marginally tweaked our EPS estimates to `8 (`7.7 earlier) and to `9.1
(`8.9 earlier) for FY2011E and FY2012E, respectively, owing to the exceptional
one-time gains during 2QFY2011. At `172, the stock is quoting at 21.5x FY2011E
and 19x FY2012E earnings. Our fair value for Exide works out to `174. Owing to
the recent run up in the stock price, we recommend a Neutral rating on the stock;
however, investors with a long-term horizon can consider investing in the stock at
lower levels. Owing to Exide’s defensive appeal and healthy and consistent
fundamentals, we value its core operations at 17.3x (20% premium to historical
average of 14.4x) its FY2012E earnings at `157. We have valued Exide’s stake in
ING Vysya Life Insurance at `11/share on FY2012E NBAP and have assigned a
value of `6/share to its lead smelters (8x FY2012E PAT).
Exhibit 6: One-year forward P/E band Exhibit 7: One-year forward P/E chart
(`) Share price (Rs) 6x 10x 14x 18x (x) One-yr forward P/E Three-yr average P/E
200 Long term average P/E
30
25
150
20
100 15
10
50
5
0 0
Apr-01
Apr-02
Apr-03
Apr-04
Apr-05
Apr-06
Apr-07
Apr-08
Apr-09
Apr-10
Oct-01
Oct-02
Oct-03
Oct-04
Oct-05
Oct-06
Oct-07
Oct-08
Oct-09
Oct-10
Apr-01
Apr-02
Apr-03
Apr-04
Apr-05
Apr-06
Apr-07
Apr-08
Apr-09
Apr-10
Oct-01
Oct-02
Oct-03
Oct-04
Oct-05
Oct-06
Oct-07
Oct-08
Oct-09
Oct-10
Source: Company, Bloomberg, Angel Research Source: Company, Bloomberg, Angel Research
October 12, 2010 6
11. Exide Industries | 2QFY2011 Result Update
Research Team Tel: 022 - 4040 3800 E-mail: research@angeltrade.com Website: www.angeltrade.com
DISCLAIMER
This document is solely for the personal information of the recipient, and must not be singularly used as the basis of any investment
decision. Nothing in this document should be construed as investment or financial advice. Each recipient of this document should make
such investigations as they deem necessary to arrive at an independent evaluation of an investment in the securities of the companies
referred to in this document (including the merits and risks involved), and should consult their own advisors to determine the merits and
risks of such an investment.
Angel Broking Limited, its affiliates, directors, its proprietary trading and investment businesses may, from time to time, make
investment decisions that are inconsistent with or contradictory to the recommendations expressed herein. The views contained in this
document are those of the analyst, and the company may or may not subscribe to all the views expressed within.
Reports based on technical and derivative analysis center on studying charts of a stock's price movement, outstanding positions and
trading volume, as opposed to focusing on a company's fundamentals and, as such, may not match with a report on a company's
fundamentals.
The information in this document has been printed on the basis of publicly available information, internal data and other reliable
sources believed to be true, but we do not represent that it is accurate or complete and it should not be relied on as such, as this
document is for general guidance only. Angel Broking Limited or any of its affiliates/ group companies shall not be in any way
responsible for any loss or damage that may arise to any person from any inadvertent error in the information contained in this report.
Angel Broking Limited has not independently verified all the information contained within this document. Accordingly, we cannot testify,
nor make any representation or warranty, express or implied, to the accuracy, contents or data contained within this document. While
Angel Broking Limited endeavours to update on a reasonable basis the information discussed in this material, there may be regulatory,
compliance, or other reasons that prevent us from doing so.
This document is being supplied to you solely for your information, and its contents, information or data may not be reproduced,
redistributed or passed on, directly or indirectly.
Angel Broking Limited and its affiliates may seek to provide or have engaged in providing corporate finance, investment banking or
other advisory services in a merger or specific transaction to the companies referred to in this report, as on the date of this report or in
the past.
Neither Angel Broking Limited, nor its directors, employees or affiliates shall be liable for any loss or damage that may arise from or in
connection with the use of this information.
Note: Please refer to the important `Stock Holding Disclosure' report on the Angel website (Research Section). Also, please
refer to the latest update on respective stocks for the disclosure status in respect of those stocks. Angel Broking Limited and
its affiliates may have investment positions in the stocks recommended in this report.
Disclosure of Interest Statement Exide Industries
1. Analyst ownership of the stock No
2. Angel and its Group companies ownership of the stock No
3. Angel and its Group companies' Directors ownership of the stock No
4. Broking relationship with company covered No
Note: We have not considered any Exposure below ` 1 lakh for Angel, its Group companies and Directors
Ratings (Returns): Buy (> 15%) Accumulate (5% to 15%) Neutral (-5 to 5%)
Reduce (-5% to 15%) Sell (< -15%)
October 12, 2010 11