1. Anand Rathi Share and Stock Brokers Limited (hereinafter “ARSSBL”) is a full-service brokerage and equities-research firm and the views expressed therein are solely of
ARSSBL and not of the companies which have been covered in the Research Report. This report is intended for the sole use of the Recipient. Disclosures and analyst
certifications are present in the Appendix.
Anand Rathi Research India Equities
Media
Company Update
India I Equities
Key financials (YE Mar) FY15 FY16 FY17 FY18e FY19e
Sales (` m) 4,332 4,921 5,495 5,433 6,340
Net profit (` m) 1,060 1,000 551 713 947
EPS (`) 22.2 20.9 11.5 14.9 19.9
Growth (%) 26.7 -5.7 -45.0 29.9 32.6
PE (x) 39.6 42.0 76.4 58.8 44.3
PBV (x) 6.2 5.5 4.9 4.6 4.1
RoE (%) 16.9 13.9 6.8 8.0 9.8
RoCE (%) 23.1 17.4 9.2 11.1 14.7
Dividend yield (%) 0.1 0.1 0.1 0.1 0.1
Net debt / equity (x) -0.8 0.0 -0.0 -0.1 -0.2
Source: Company, Anand Rathi Research
Mohit Jain
Research Analyst
+9122 6626 6531
mohitjain@rathi.com
Shobit Singhal
Research Associate
+9122 6626 6511
shobitsinghal@rathi.com
`
Rating: Sell
Target Price: `780
Share Price: `880
Key data ENIL IN / ENIL.BO
52-week high / low `1,008 / `667
Sensex / Nifty 32238 / 10014
3-m average volume $0.3m
Market cap `42bn / $658.9m
Shares outstanding 48m
Shareholding pattern (%) Jun'17 Mar'17 Dec'16
Promoters 71.2 71.2 71.2
- of which, Pledged - - -
Free float 28.9 28.9 28.9
- Foreign institutions 15.7 16.5 16.5
- Domestic institutions 4.3 3.6 2.4
- Public 8.9 8.8 9.9
4 August 2017
Entertainment Network
Recovery deferred to FY19, but rich valuations persist; Sell
Its strategy of raising prices (up 11.4% y/y) added to macro headwinds
(weak government spending, RERA, GST and de-monetisation) and
led to a weak Q1 for ENIL (revenue down 10% y/y to `987m, an 11%
EBITDA margin vs. 25.5% a year prior). Yet, employee costs (32% of
revenue in Q1 FY18, vs. 23% a year prior) are semi-variable and can be
used as a margin lever. Management expects a strong H2 (Q2 has been
weak so far) due to festival sales, but hopes for double-digit growth
only in FY18 EBITDA. The weak H1 results lead to us cutting the
FY18e and FY19e EPS a steep 13% and 19% respectively, with a new
target of `780 (18x FY19e EV/EBITDA), down from `850 earlier.
Price hikes in Q1 did not go well. ENIL’s Q1 performance was subdued as
its core radio business (73% of revenue) slid 15% y/y, partly offset by its non-
radio business (27% of revenue) growing 17% y/y. Core radio weakness
(utilisation down from 92% in Q1 FY17 to 62%) suffered the impact of the
factors mentioned above but, most importantly, the market did not absorb
price hikes, and competition was quick to capture market share from the
leader. New stations brought ~11% to revenue (`106m in Q1) but still suffer
losses (`43.5m in Q1).
Festival season critical to demonstrate recovery. Recovery has not been
seen so far (Jul was soft, Aug uncertain) but ENIL is holding to its pricing in
hopes of a Q3 recovery. Also, it is relying on two launches (Kozhikode and
Jammu) in Aug and a steep H2 recovery due to pent-up demand in the last
few months. If the market is weak, ENIL will revisit its pricing strategy in Q3.
Rich valuations lead us to re-visit our rating – to a Sell. To reflect the weak
H1, we cut our estimates by 19%. The valuation at which the stock now trades
(21.8x FY19e EV:EBITDA) we find rich, preferring to await a better entry. Our
recommendation also reflects expectations of a slow recovery in the core
sectors that advertise on radio. Risk: Market-share loss to competition.
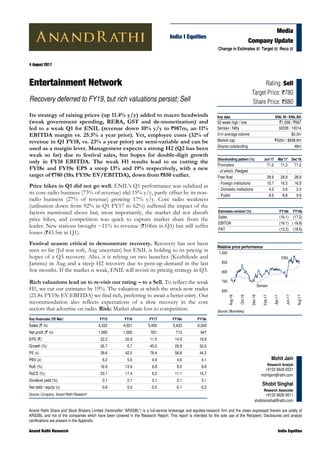
Relative price performance
Source: Bloomberg
ENIL
Sensex
600
700
800
900
1,000
Aug-16
Oct-16
Dec-16
Feb-17
Apr-17
Jun-17
Aug-17
Estimates revision (%) FY18e FY19e
Sales (16.1) (17.2)
EBITDA (19.1) ( 16.8)
PAT (13.2) (18.6)
Change in Estimates Target Reco
4. 4 August 2017 Entertainment Network – Recovery deferred to FY19, but rich valuations persist; Sell
Anand Rathi Research 4
Conference Call Takeaways
Company
In Q1 FY18, the top-eight advertising categories collectively declined
20% by volume for the radio industry. The major drop in volumes was
seen in government advertising (38% for industry, company-70%), real
estate (industry-21%, company-41%) and media & entertainment
(company-44%). ENIL has a 25% market share by revenue in
government advertising.
Consumption-wise, the top-eight markets bring 60% to the advertising
pie; the rest of the market, 40%. The company expects to reverse this
in the next 2-3 years.
In Q1 FY18, its new stations reported `106m in revenue, though
suffering a `43.5m EBITDA loss. The company expects the new
stations to break even by end-FY18.
With volumes declining 30%, revenue from existing stations dropped
14.9% y/y.
The realisation rate rose 11.4% y/y.
At its core 36 stations, costs, which rose by just ~1-2% in Q1 FY18,
have been curtailed; the company expects to hold them at this level.
The company launched its 2nd frequency band, at a 5-10% price
premium to the present frequency, though capacity utilisation is now
under ~20%. It expects utilisation at its new stations to climb to 60-
80% by end-FY18.
Blended capacity utilisation in Q1 FY18 came at 62.9% (86% for the
top-eight cities and 20% for the new stations).
The company is focusing on reducing advertising volumes during the
peak festival season by cutting down inventory (advertising time-slots)
by four minutes an hour (from 22 minutes an hour at present to
eighteen).
The blended realisation rate for Q1 FY18 was `10,700.
The company will incur ~`250m on capex in launching new stations in
FY18.
Business outlook
Business should return to normal only from H2 FY18 as the festival
season sets in, since Q2 FY18 would still bear the brunt of the GST,
de-monetisation and RERA.
Notes from the last two quarters’ conference calls
From Q4 FY17
Q1 FY18 will be hit by the GST as advertisers are holding up
spending.
For the industry, the impact of the GST on revenue is expected to be
~1%.
From Q3 FY17
Q4 is expected to bear the impact of de-monetization as well, but
somewhat alleviated. Overall, growth would be affected 5-7%.
5. 4 August 2017 Entertainment Network – Recovery deferred to FY19, but rich valuations persist; Sell
Anand Rathi Research 5
Valuations
In the radio sector ENIL leads and in FY17 scaled up to 49 channels (in 39
cities). Before the Phase 3 (batch 1) auctions and prior to its recent
acquisition of TV Today’s FM channels, it operated 32 channels (in 32
cities). This scale-up is reflected in its lower EBITDA margin and, we
believe, that by FY19 the full benefit of the scaling-up of operations would
be evident, with margins reverting to over 30%.
We like the strategy of operating multiple frequencies in many cities. This
may increase the target market (audience and advertising market-share)
with the additional benefit of operating leverage by virtue of two stations in
a city. Its nationwide operations should help attract more advertisers.
Since the stock trades at 21.7x FY19e EV:EBITDA at the ruling price of
`880, we have revised our target to `780 from `850 earlier. We alter our
recommendation for it from a Hold to a Sell.
Fig 9 – Change in estimates
FY18 FY19
(` m) New Old % Change New Old % Change
Revenues 5,433 6,475 (16.1) 6,340 7,655 (17.2)
EBITDA 1,430 1,768 (19.1) 1,925 2,313 (16.8)
EBITDA margin % 26.3 27.3 -98 bps 30.4 30.2 15 bps
EBIT 815 1,066 (23.5) 1,292 1,596 (19.0)
EBIT margin % 15.0 16.5 -146 bps 20.4 20.8 -47 bps
PBT 1,008 1,164 (13.4) 1,349 1,661 (18.8)
Net Profit 713 821 (13.2) 947 1,163 (18.6)
Source: Anand Rathi Research
Fig 10 – EV/EBITDA (one-year-forward)
Source : Bloomberg, Anand Rathi Research
Risks
Any further loss of market share to competition.
0
5
10
15
20
25
30
35
Jul-13
Oct-13
Jan-14
Apr-14
Jul-14
Oct-14
Jan-15
Apr-15
Jul-15
Oct-15
Jan-16
Apr-16
Jul-16
Oct-16
Jan-17
Apr-17
Jul-17
ENIL
6. Appendix
Analyst Certification
The views expressed in this Research Report accurately reflect the personal views of the analyst(s) about the subject securities or issuers and no part of the
compensation of the research analyst(s) was, is, or will be directly or indirectly related to the specific recommendations or views expressed by the research
analyst(s) in this report. The research analysts are bound by stringent internal regulations and also legal and statutory requirements of the Securities and Exchange
Board of India (hereinafter “SEBI”) and the analysts’ compensation are completely delinked from all the other companies and/or entities of Anand Rathi, and have
no bearing whatsoever on any recommendation that they have given in the Research Report.
Important Disclosures on subject companies
Rating and Target Price History (as of 3 August 2017)
Date Rating
TP
(`)
Share
Price (`)
1 28-Jul-16 Buy 860 709
2 09-Nov-16 Buy 880 740
3 14-Feb-17 Hold 850 810
Anand Rathi Ratings Definitions
Analysts’ ratings and the corresponding expected returns take into account our definitions of Large Caps (>US$1bn) and Mid/Small Caps (<US$1bn) as described
in the Ratings Table below:
Ratings Guide (12 months)
Buy Hold Sell
Large Caps (>US$1bn) >15% 5-15% <5%
Mid/Small Caps (<US$1bn) >25% 5-25% <5%
Research Disclaimer and Disclosure inter-alia as required under Securities and Exchange Board of India (Research Analysts) Regulations, 2014
Anand Rathi Share and Stock Brokers Ltd. (hereinafter refer as ARSSBL) (Research Entity) is a subsidiary of Anand Rathi Financial Services Ltd. ARSSBL is a
corporate trading and clearing member of Bombay Stock Exchange Ltd, National Stock Exchange of India Ltd. (NSEIL), Multi Stock Exchange of India Ltd (MCX-
SX), United Stock Exchange and also depository participant with National Securities Depository Ltd (NSDL) and Central Depository Services Ltd. ARSSBL is
engaged in the business of Stock Broking, Depository Participant and Mutual Fund distributor.
The research analysts, strategists, or research associates principally responsible for the preparation of Anand Rathi research have received compensation based
upon various factors, including quality of research, investor client feedback, stock picking, competitive factors and firm revenues.
General Disclaimer: This Research Report (hereinafter called “Report”) is meant solely for use by the recipient and is not for circulation. This Report does not
constitute a personal recommendation or take into account the particular investment objectives, financial situations, or needs of individual clients. The
recommendations, if any, made herein are expression of views and/or opinions and should not be deemed or construed to be neither advice for the purpose of
purchase or sale of any security, derivatives or any other security through ARSSBL nor any solicitation or offering of any investment /trading opportunity on behalf
of the issuer(s) of the respective security (ies) referred to herein. These information / opinions / views are not meant to serve as a professional investment guide for
the readers. No action is solicited based upon the information provided herein. Recipients of this Report should rely on information/data arising out of their own
investigations. Readers are advised to seek independent professional advice and arrive at an informed trading/investment decision before executing any trades or
making any investments. This Report has been prepared on the basis of publicly available information, internally developed data and other sources believed by
ARSSBL to be reliable. ARSSBL or its directors, employees, affiliates or representatives do not assume any responsibility for, or warrant the accuracy,
completeness, adequacy and reliability of such information / opinions / views. While due care has been taken to ensure that the disclosures and opinions given are
fair and reasonable, none of the directors, employees, affiliates or representatives of ARSSBL shall be liable for any direct, indirect, special, incidental,
consequential, punitive or exemplary damages, including lost profits arising in any way whatsoever from the information / opinions / views contained in this Report.
The price and value of the investments referred to in this Report and the income from them may go down as well as up, and investors may realize losses on any
investments. Past performance is not a guide for future performance. ARSSBL does not provide tax advice to its clients, and all investors are strongly advised to
consult with their tax advisers regarding taxation aspects of any potential investment.
Opinions expressed are our current opinions as of the date appearing on this Research only. We do not undertake to advise you as to any change of our views
expressed in this Report. Research Report may differ between ARSSBL’s RAs and/ or ARSSBL’s associate companies on account of differences in research
methodology, personal judgment and difference in time horizons for which recommendations are made. User should keep this risk in mind and not hold ARSSBL,
its employees and associates responsible for any losses, damages of any type whatsoever.
ENIL
1
2
3
400
500
600
700
800
900
1,000
Jan-16
Feb-16
Mar-16
Apr-16
May-16
Jun-16
Jul-16
Aug-16
Sep-16
Oct-16
Nov-16
Dec-16
Jan-17
Feb-17
Mar-17
Apr-17
May-17
Jun-17
Jul-17
Aug-17