Download to read offline

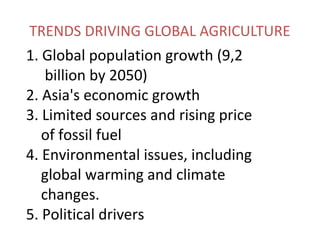
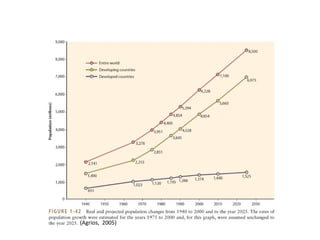
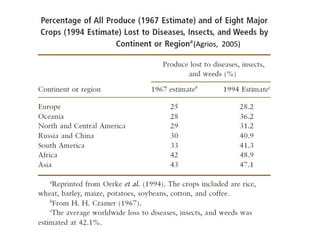
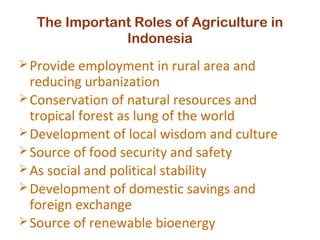
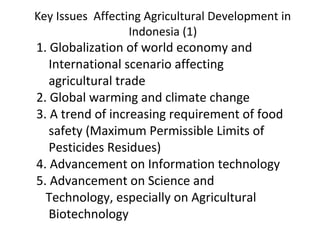
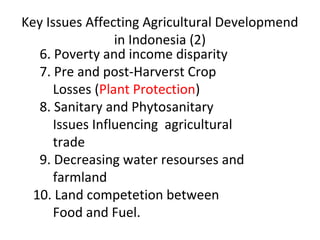
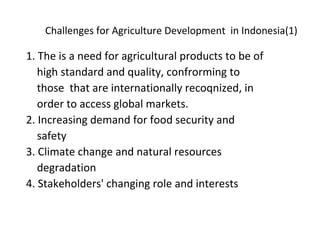
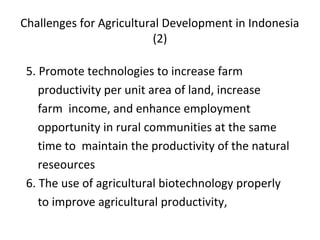
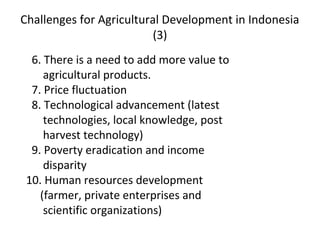
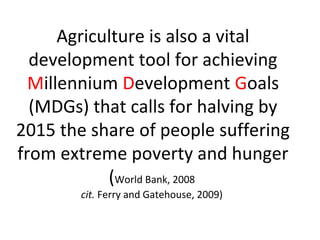
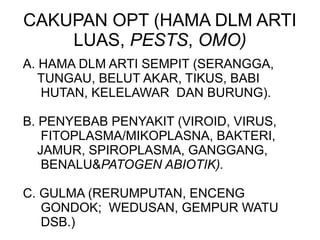


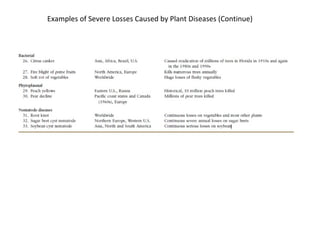
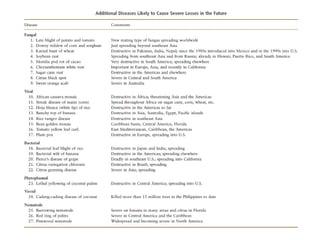


This document discusses plant protection and challenges in Indonesian agriculture. It notes that the world population is growing, increasing demand for food. Crop losses from pests, diseases and weeds are estimated at 31-42% globally each year. In Indonesia, agriculture provides employment and food security but faces issues like climate change, trade impacts, and decreasing resources. Integrated approaches are needed to increase productivity while maintaining sustainability.
![[Challenge:Future] pest problem in china](https://cdn.slidesharecdn.com/ss_thumbnails/challengefuture-pest-problem-in-china2231-111030151857-phpapp02-thumbnail.jpg?width=640&height=640&fit=bounds)


![[Challenge:Future] PEST MANAGEMENT.](https://cdn.slidesharecdn.com/ss_thumbnails/challengefuture-pest-management4414-111107110235-phpapp01-thumbnail.jpg?width=640&height=640&fit=bounds)


