Downloaded 275 times
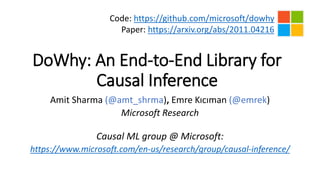
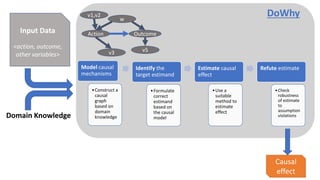
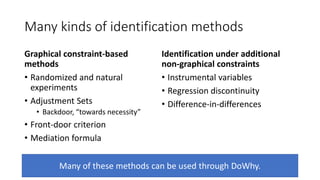
![I. Model the assumptions using a causal graph
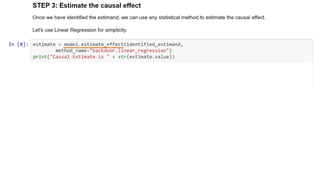
Convert domain knowledge to a formal
model of causal assumptions
• 𝐴 → 𝐵 or 𝐵 → 𝐴?
• Causal graph implies conditional statistical
independences
• E.g., 𝐴 ⫫ 𝐶, 𝐷 ⫫ A | B, …
• Identified by d-separation rules [Pearl 2009]
• These assumptions significantly impact the
causal estimate we’ll obtain.
A
C
B D](https://image.slidesharecdn.com/dowhy-causalscience-workshop-share-201111124903/85/Dowhy-An-end-to-end-library-for-causal-inference-10-320.jpg)
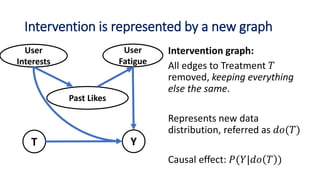
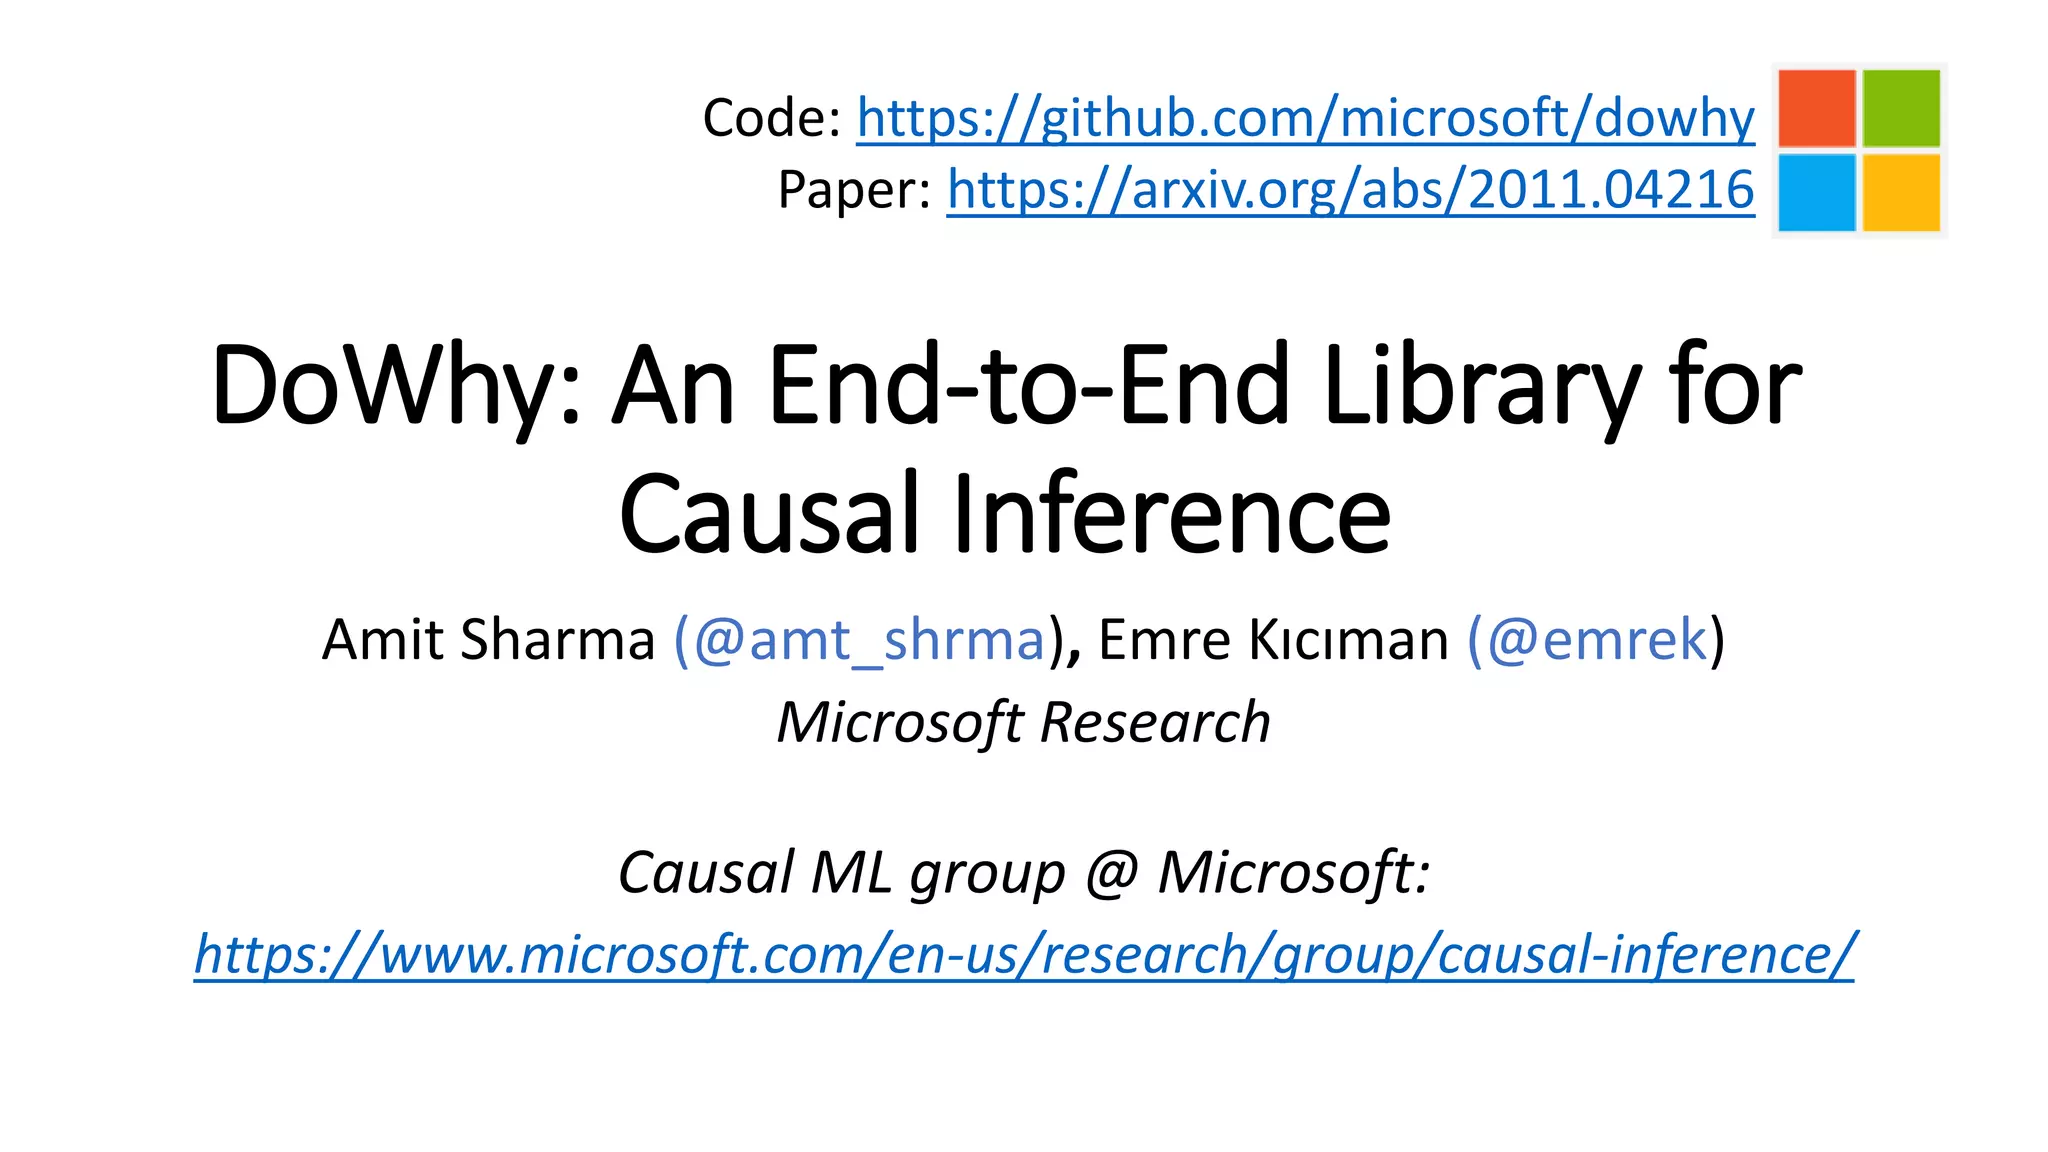
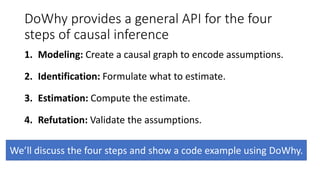
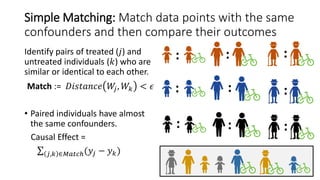
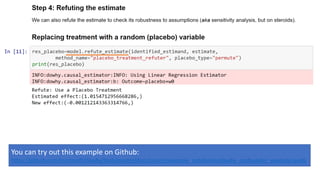
![III. Estimation: Compute the causal effect
Estimation uses observed data to compute the target
probability expression from the Identification step.
For common identification strategies using adjustment sets,
𝐸[𝑌|𝑑𝑜 𝑇 = 𝑡 , 𝑊 = 𝑤]= 𝐸 𝑌 𝑇 = 𝑡, 𝑊 = 𝑤
assuming W is a valid adjustment set.
• For binary treatment,
Causal Effect = 𝐸 𝑌 𝑇 = 1, 𝑊 = 𝑤 − 𝐸 𝑌 𝑇 = 0, 𝑊 = 𝑤
Goal: Estimating conditional probability Y|T=t when all
confounders W are kept constant.](https://image.slidesharecdn.com/dowhy-causalscience-workshop-share-201111124903/85/Dowhy-An-end-to-end-library-for-causal-inference-18-320.jpg)

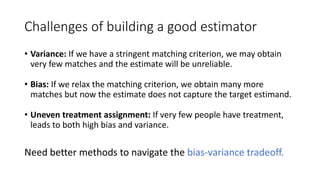
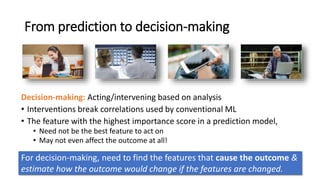
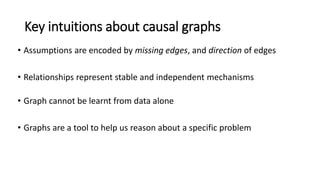
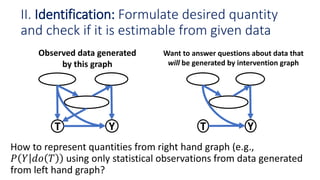
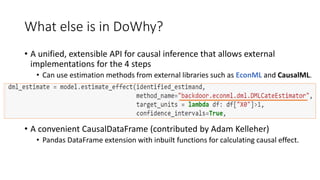
![Other ML methods generalize estimation to
continuous treatments
The standard predictor, 𝑦 = 𝑓 𝑡, 𝑤 + 𝜖
may not provide the right estimate for
𝜕𝑦
𝜕𝑡
.
Double-ML [Chernozhukov et al. 2016]:
• Stage 1: Break down conditional
estimation into two prediction sub-tasks.
𝑦 = 𝑔 𝑤 + 𝑦
𝑡 = ℎ 𝑤 + 𝑡
𝑦 and 𝑡 refer to the unconfounded variation in
𝑌 and 𝑇 respectively after conditioning on w.
• Stage 2: A final regression of 𝑦 on 𝑡 gives
the causal effect.
𝑦~ 𝛽 𝑡 + 𝜖
Outcome(Y)
Confounder (W)
Treatment(T)
Confounder (W)
Residual Treatment ( 𝑇)
ResidualOutcome(𝑌)](https://image.slidesharecdn.com/dowhy-causalscience-workshop-share-201111124903/85/Dowhy-An-end-to-end-library-for-causal-inference-23-320.jpg)
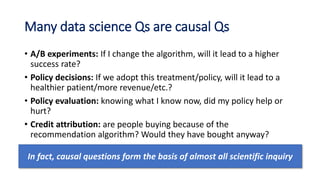
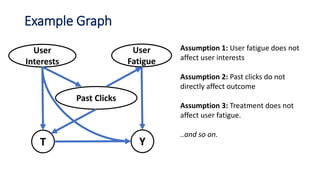
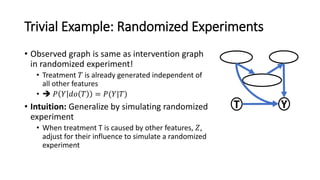
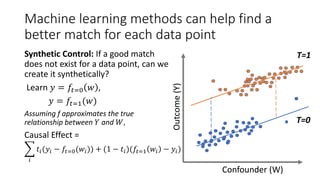
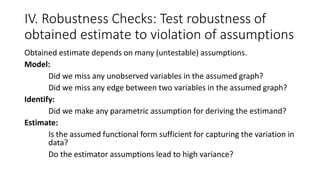
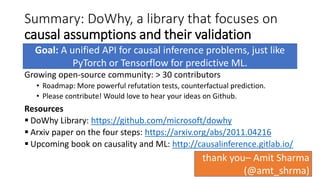
![Depending on the dataset properties,
different estimation methods can be used
Simple Conditioning
• Matching
• Stratification
Propensity Score-Based [Rubin 1983]
• Propensity Matching
• Inverse Propensity Weighting
Synthetic Control [Abadie et al.]
Outcome-based
• Double ML [Chernozhukov et al. 2016]
• T-learner
• X-learner [Kunzel et al. 2017]
Loss-Based
• R-learner [Nie & Wager 2017]
Threshold-based
• Difference-in-differences
All these methods can be called through DoWhy.
(directly or through the Microsoft EconML library)](https://image.slidesharecdn.com/dowhy-causalscience-workshop-share-201111124903/85/Dowhy-An-end-to-end-library-for-causal-inference-24-320.jpg)
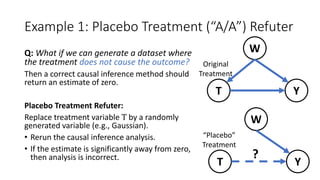
![Best practice: Do refutation/robustness tests
for as many assumptions as possible
UNIT TESTS
Model:
• Conditional Independence Test
Identify:
• D-separation Test
Estimate:
• Bootstrap Refuter
• Data Subset Refuter
INTEGRATION TESTS
Test all steps at once.
• Placebo Treatment Refuter
• Dummy Outcome Refuter
• Random Common Cause Refuter
• Sensitivity Analysis
• Simulated Outcome Refuter
/Synth-validation [Schuler et al. 2017]
All these refutation methods are implemented in DoWhy.
Caveat: They can refute a given analysis, but cannot prove its correctness.](https://image.slidesharecdn.com/dowhy-causalscience-workshop-share-201111124903/85/Dowhy-An-end-to-end-library-for-causal-inference-26-320.jpg)
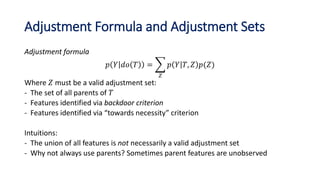
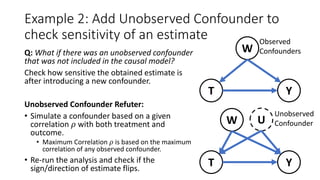
![Example 1: Conditional Independence Refuter
Through its edges, each causal graph
implies certain conditional independence
constraints on its nodes. [d-separation, Pearl
2009]
Model refutation: Check if the observed
data satisfies the assumed model’s
independence constraints.
• Use an appropriate statistical test for
independence [Heinze-Demel et al. 2018].
• If not, the model is incorrect.
W
YT
A B
Conditional Independencies:
𝐴⫫𝐵 𝐴⫫T|W 𝐵⫫ T|W](https://image.slidesharecdn.com/dowhy-causalscience-workshop-share-201111124903/85/Dowhy-An-end-to-end-library-for-causal-inference-27-320.jpg)

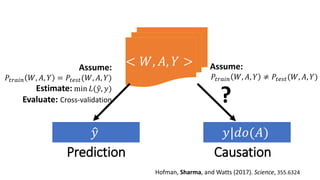
Dowhy is a library designed for causal inference, emphasizing the importance of causal assumptions and their evaluation. It provides a structured approach through four steps: modeling, identification, estimation, and robustness checks, enabling users to analyze causality effectively. The library is open-source and integrated with various external methods, fostering a growing community and ongoing development in causal analysis.


![[PAP] 실무자를 위한 인과추론 활용 : Best Practices](https://cdn.slidesharecdn.com/ss_thumbnails/papcon1-220218051343-thumbnail.jpg?width=640&height=640&fit=bounds)


![[RecSys '13]Pairwise Learning: Experiments with Community Recommendation on L...](https://cdn.slidesharecdn.com/ss_thumbnails/recsys2013-pairwiselearning1-131015044836-phpapp02-thumbnail.jpg?width=640&height=640&fit=bounds)


