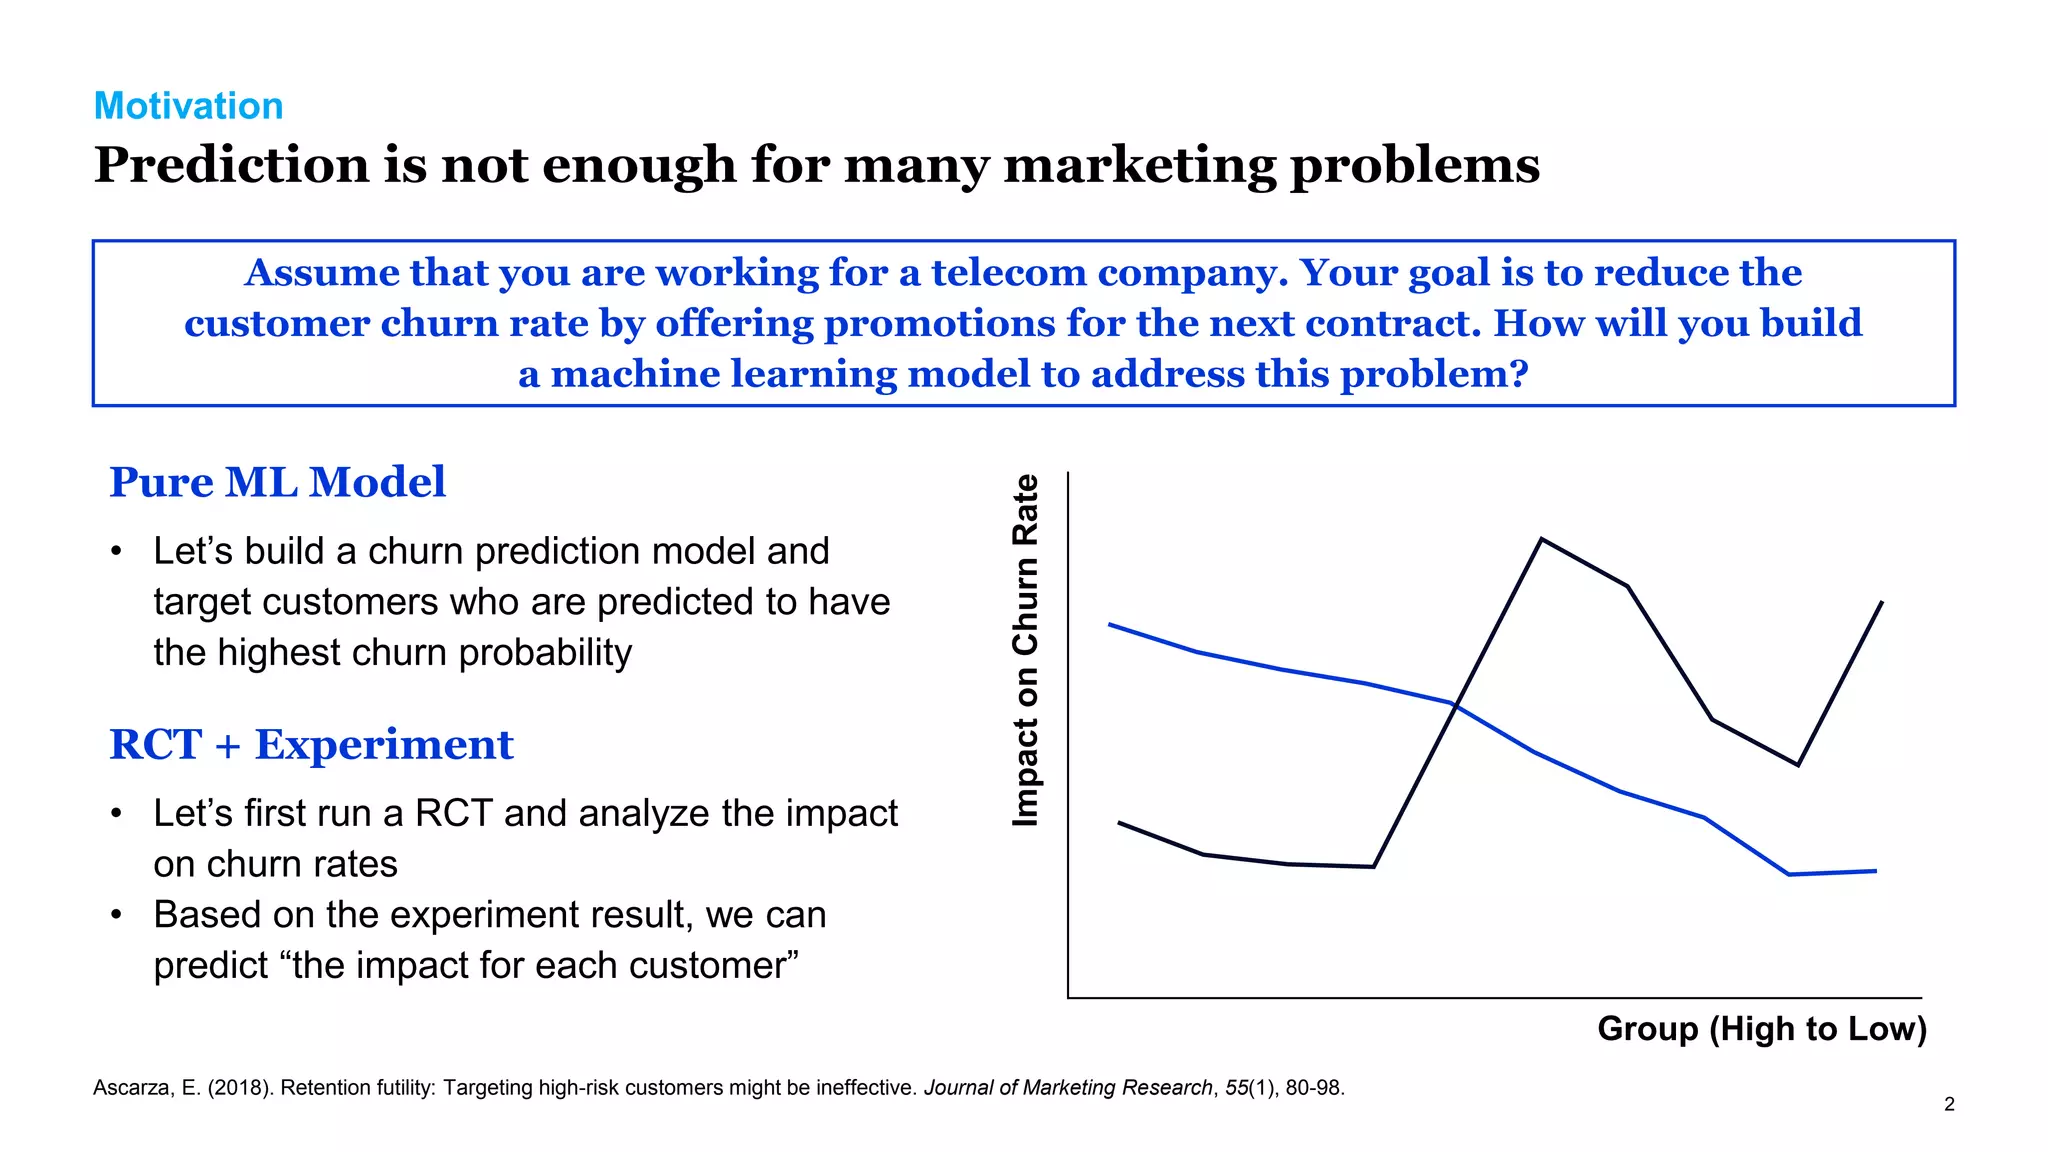
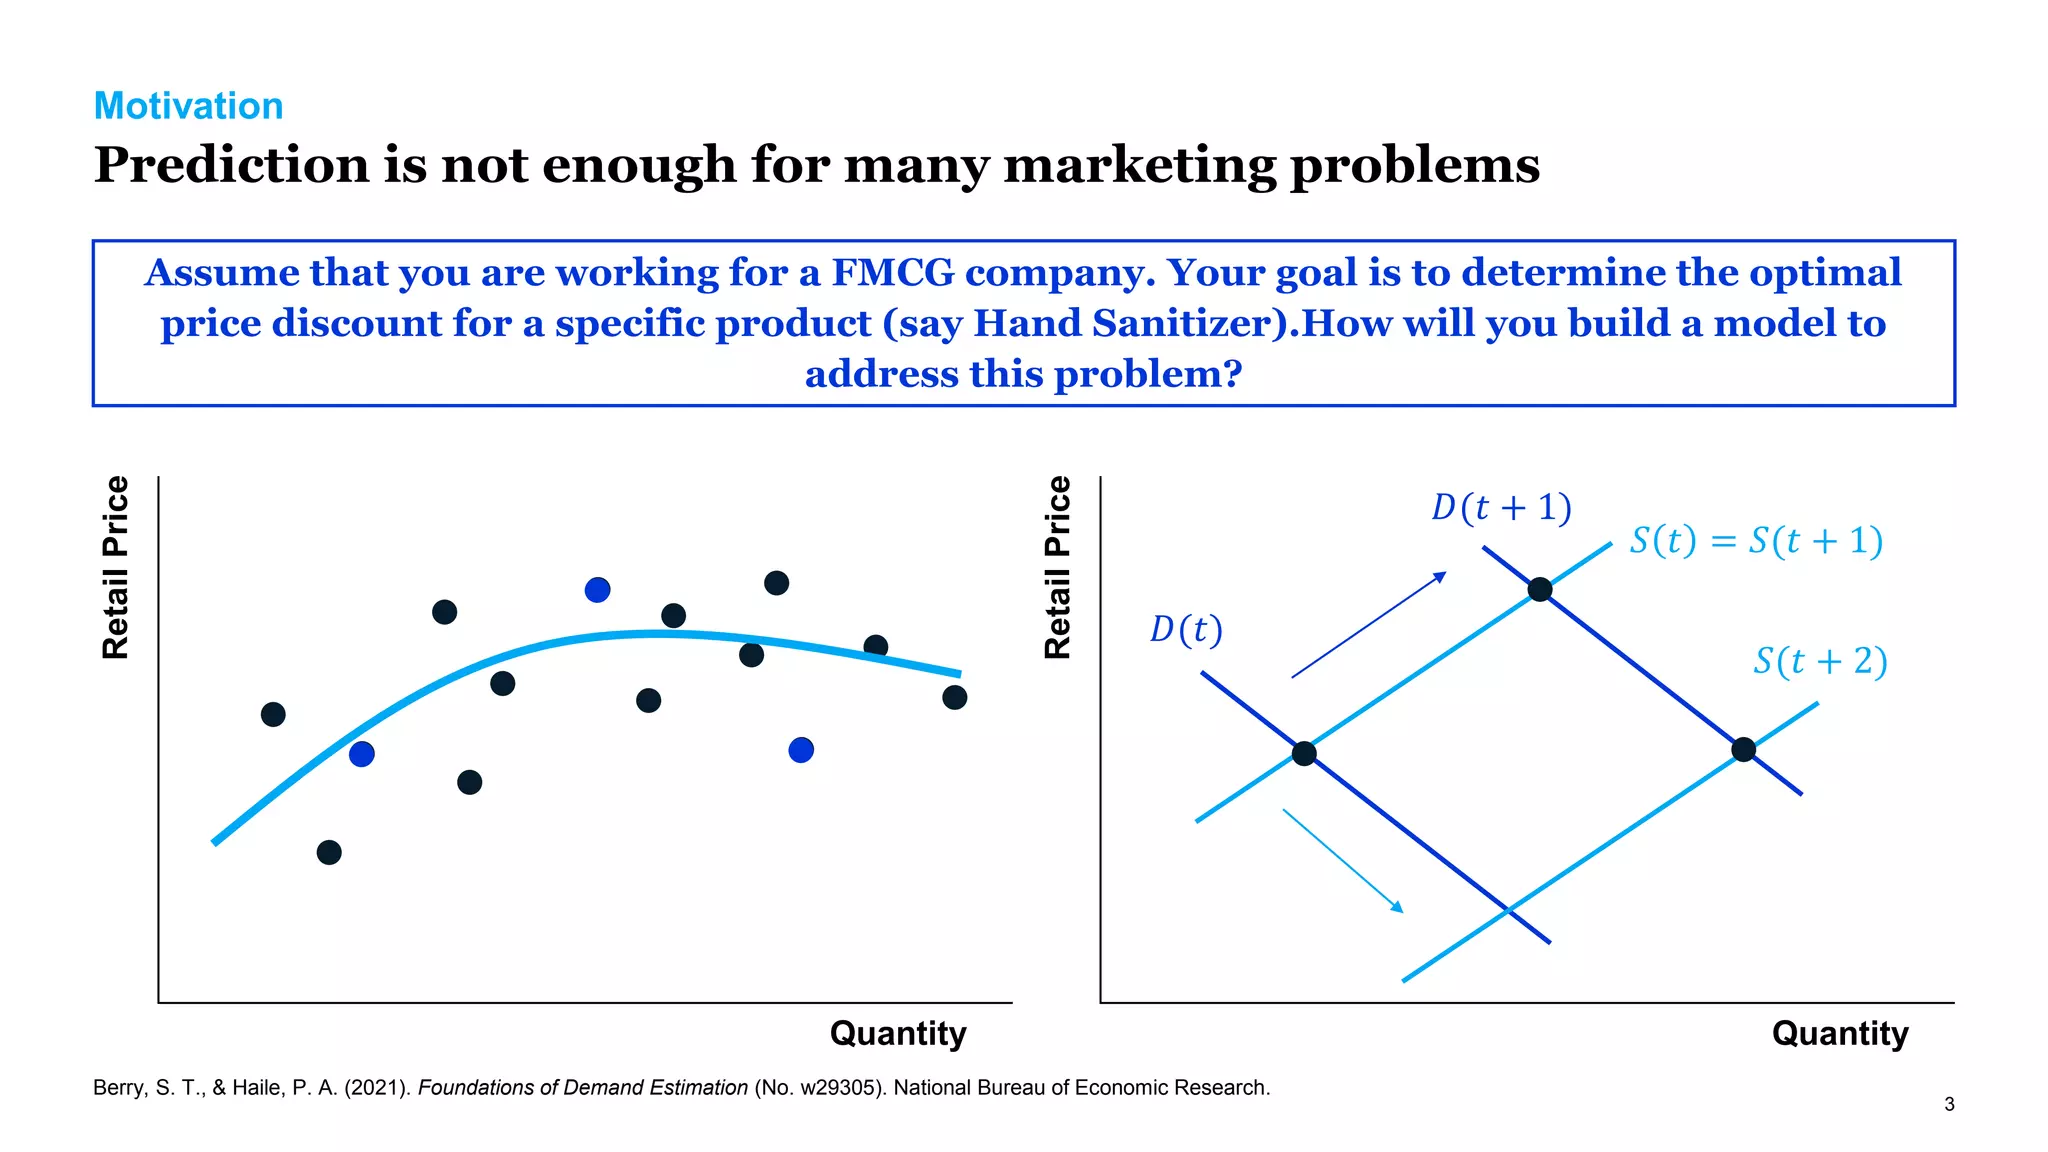
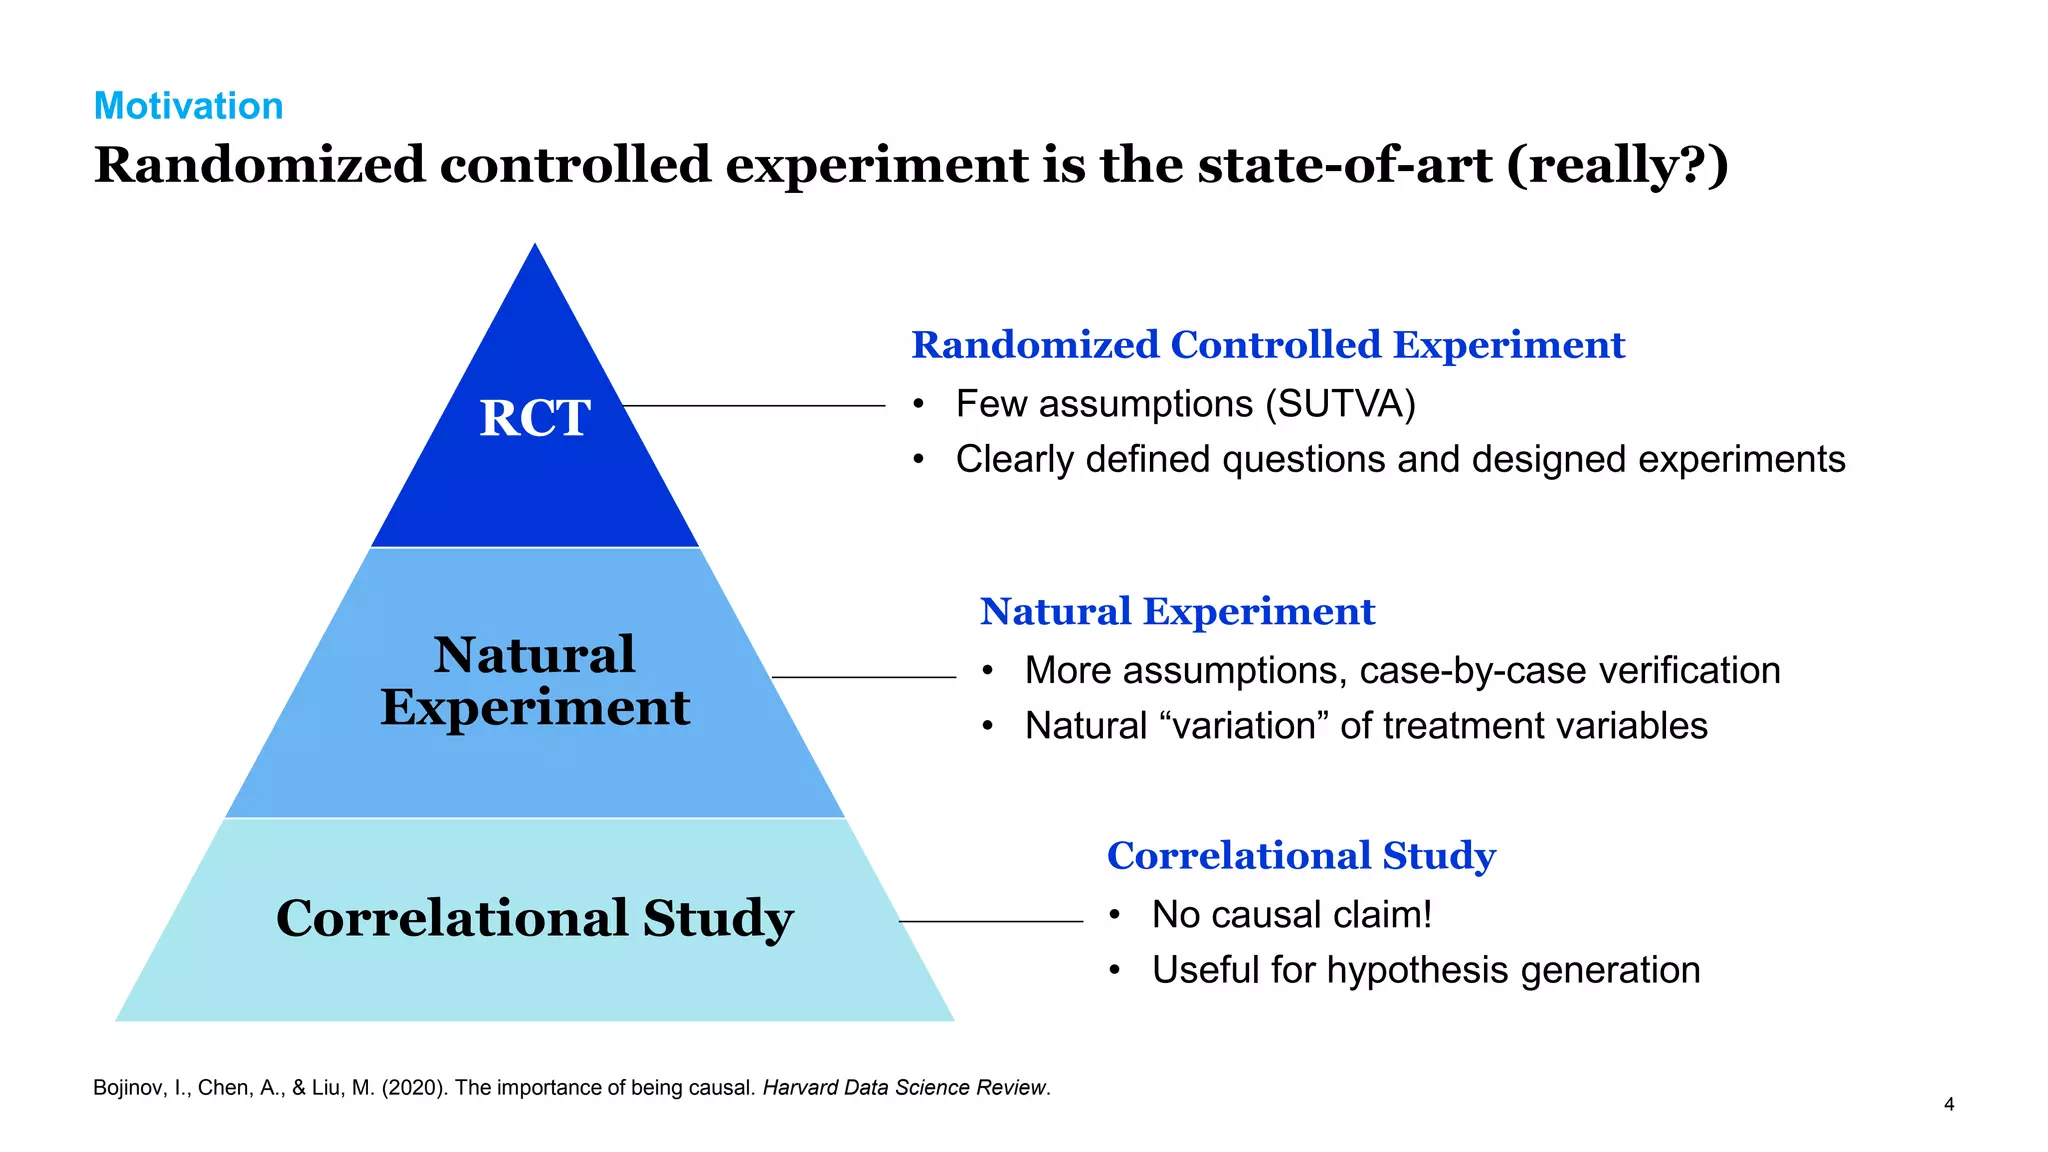
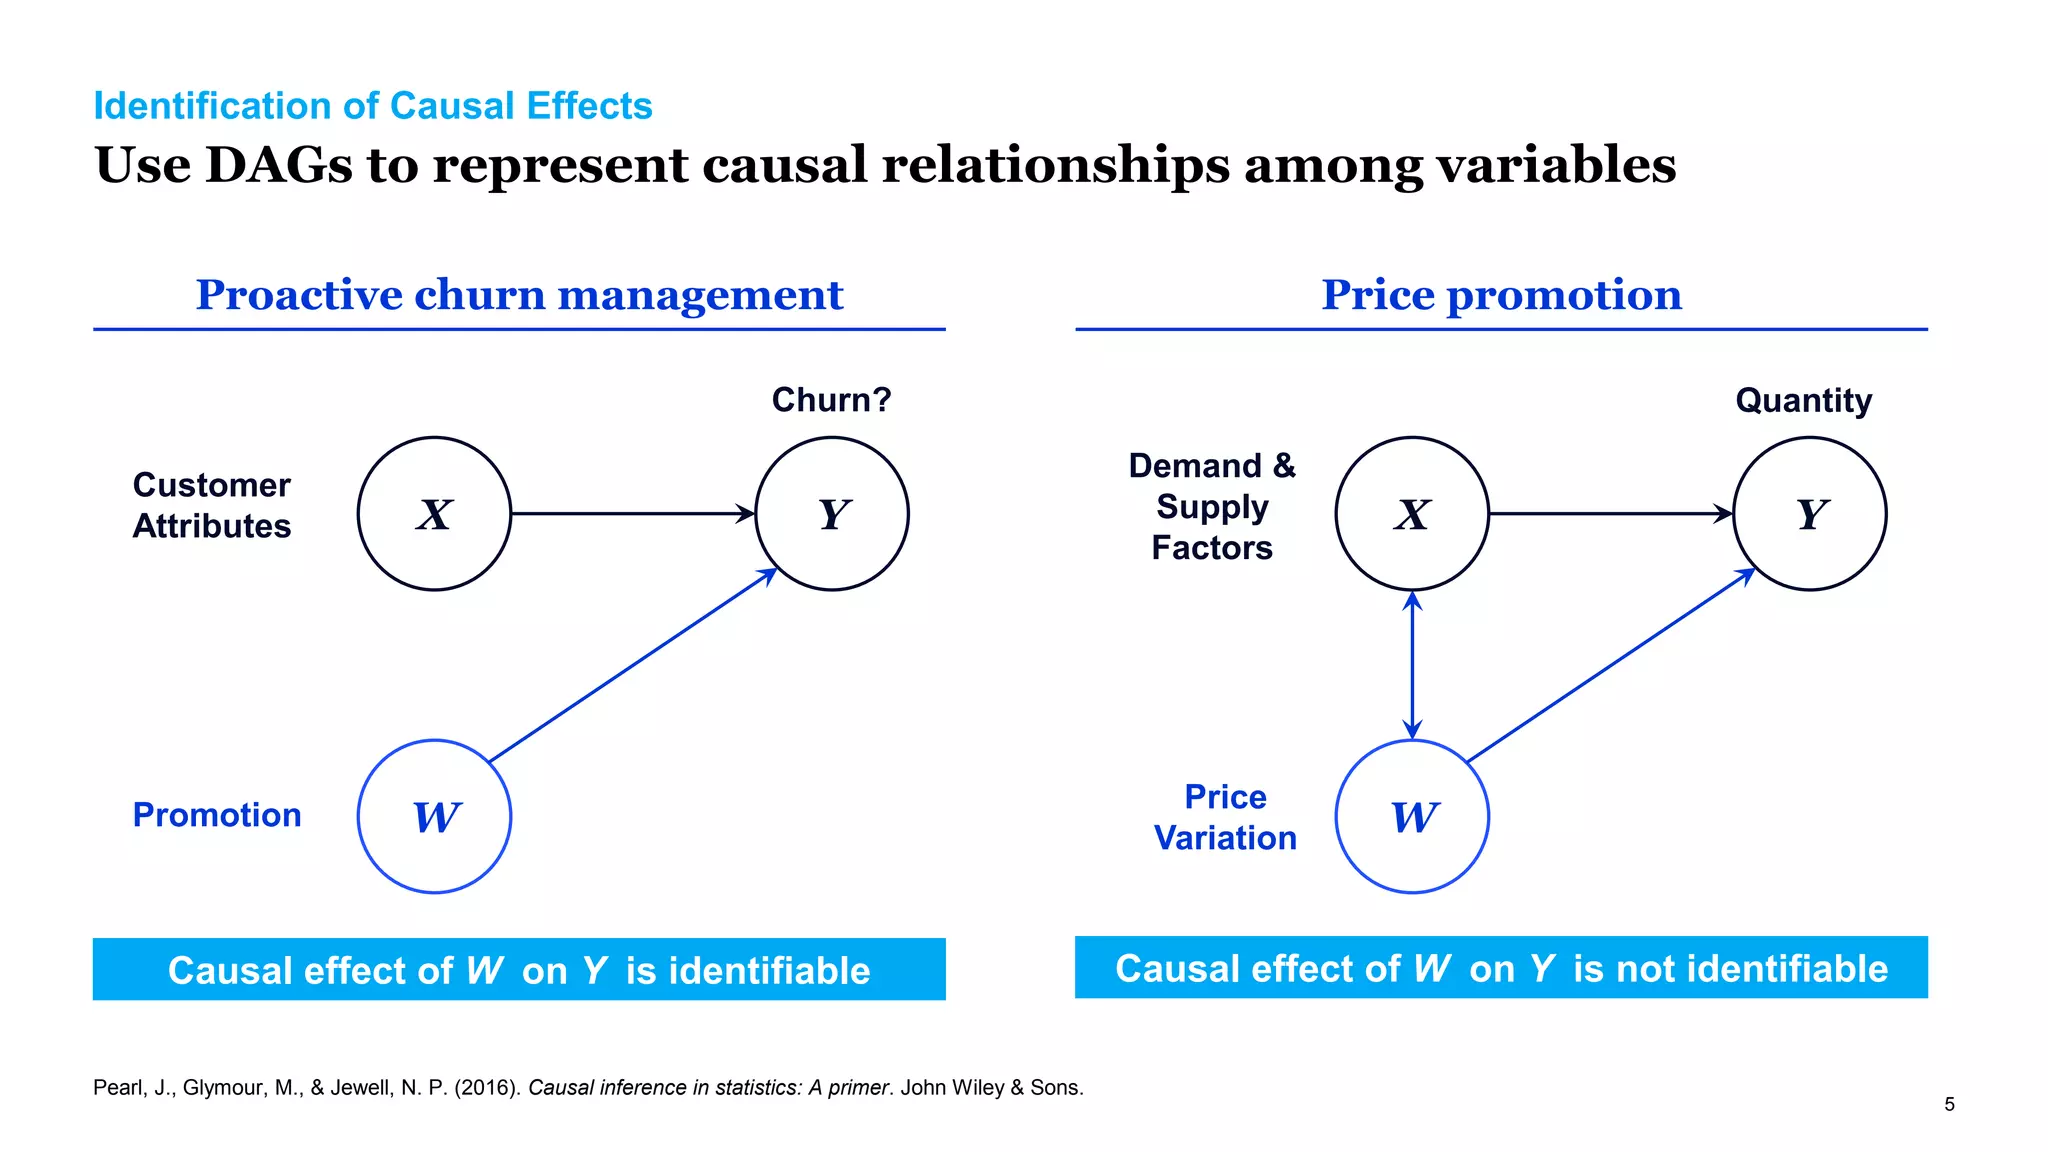
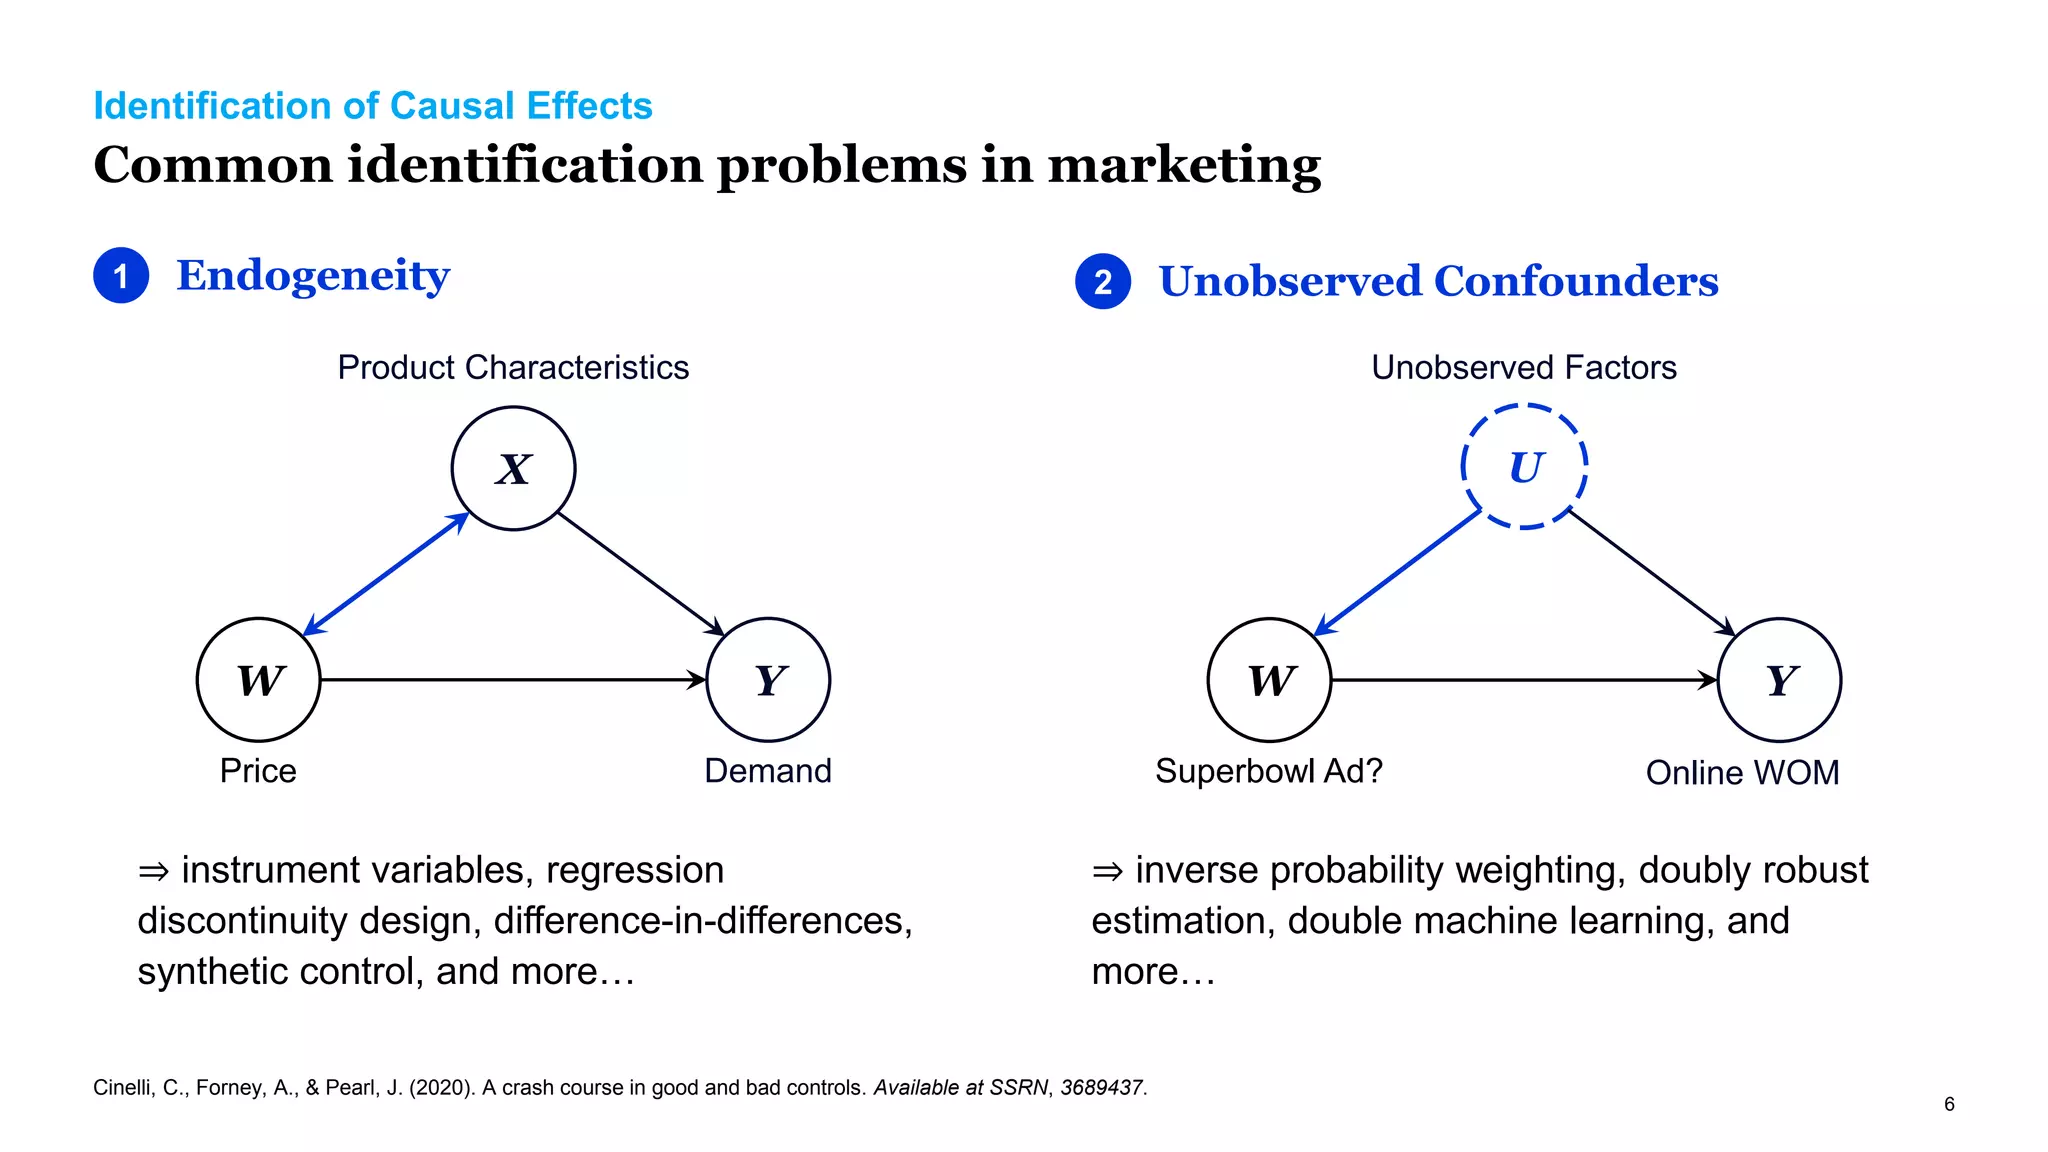
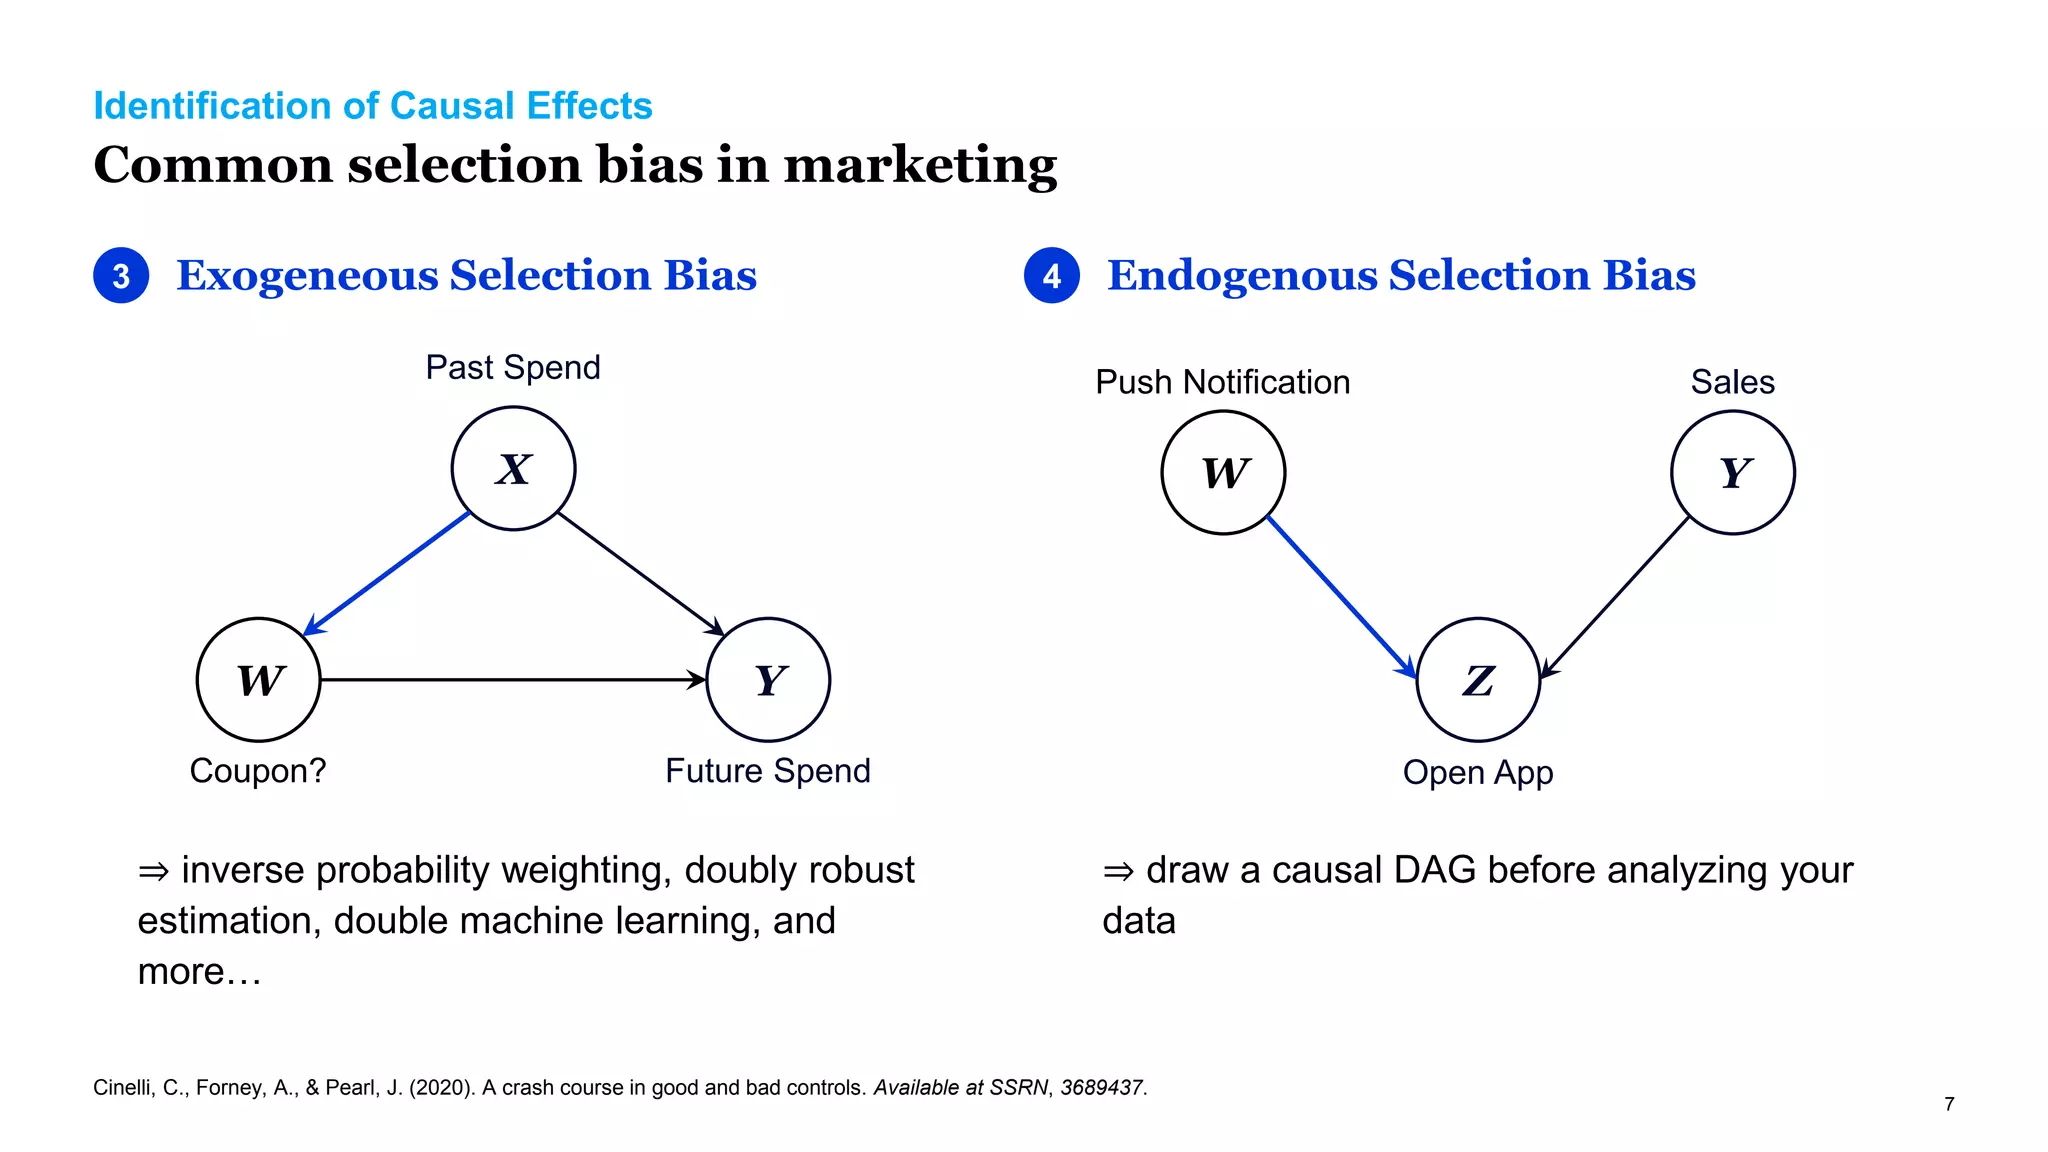
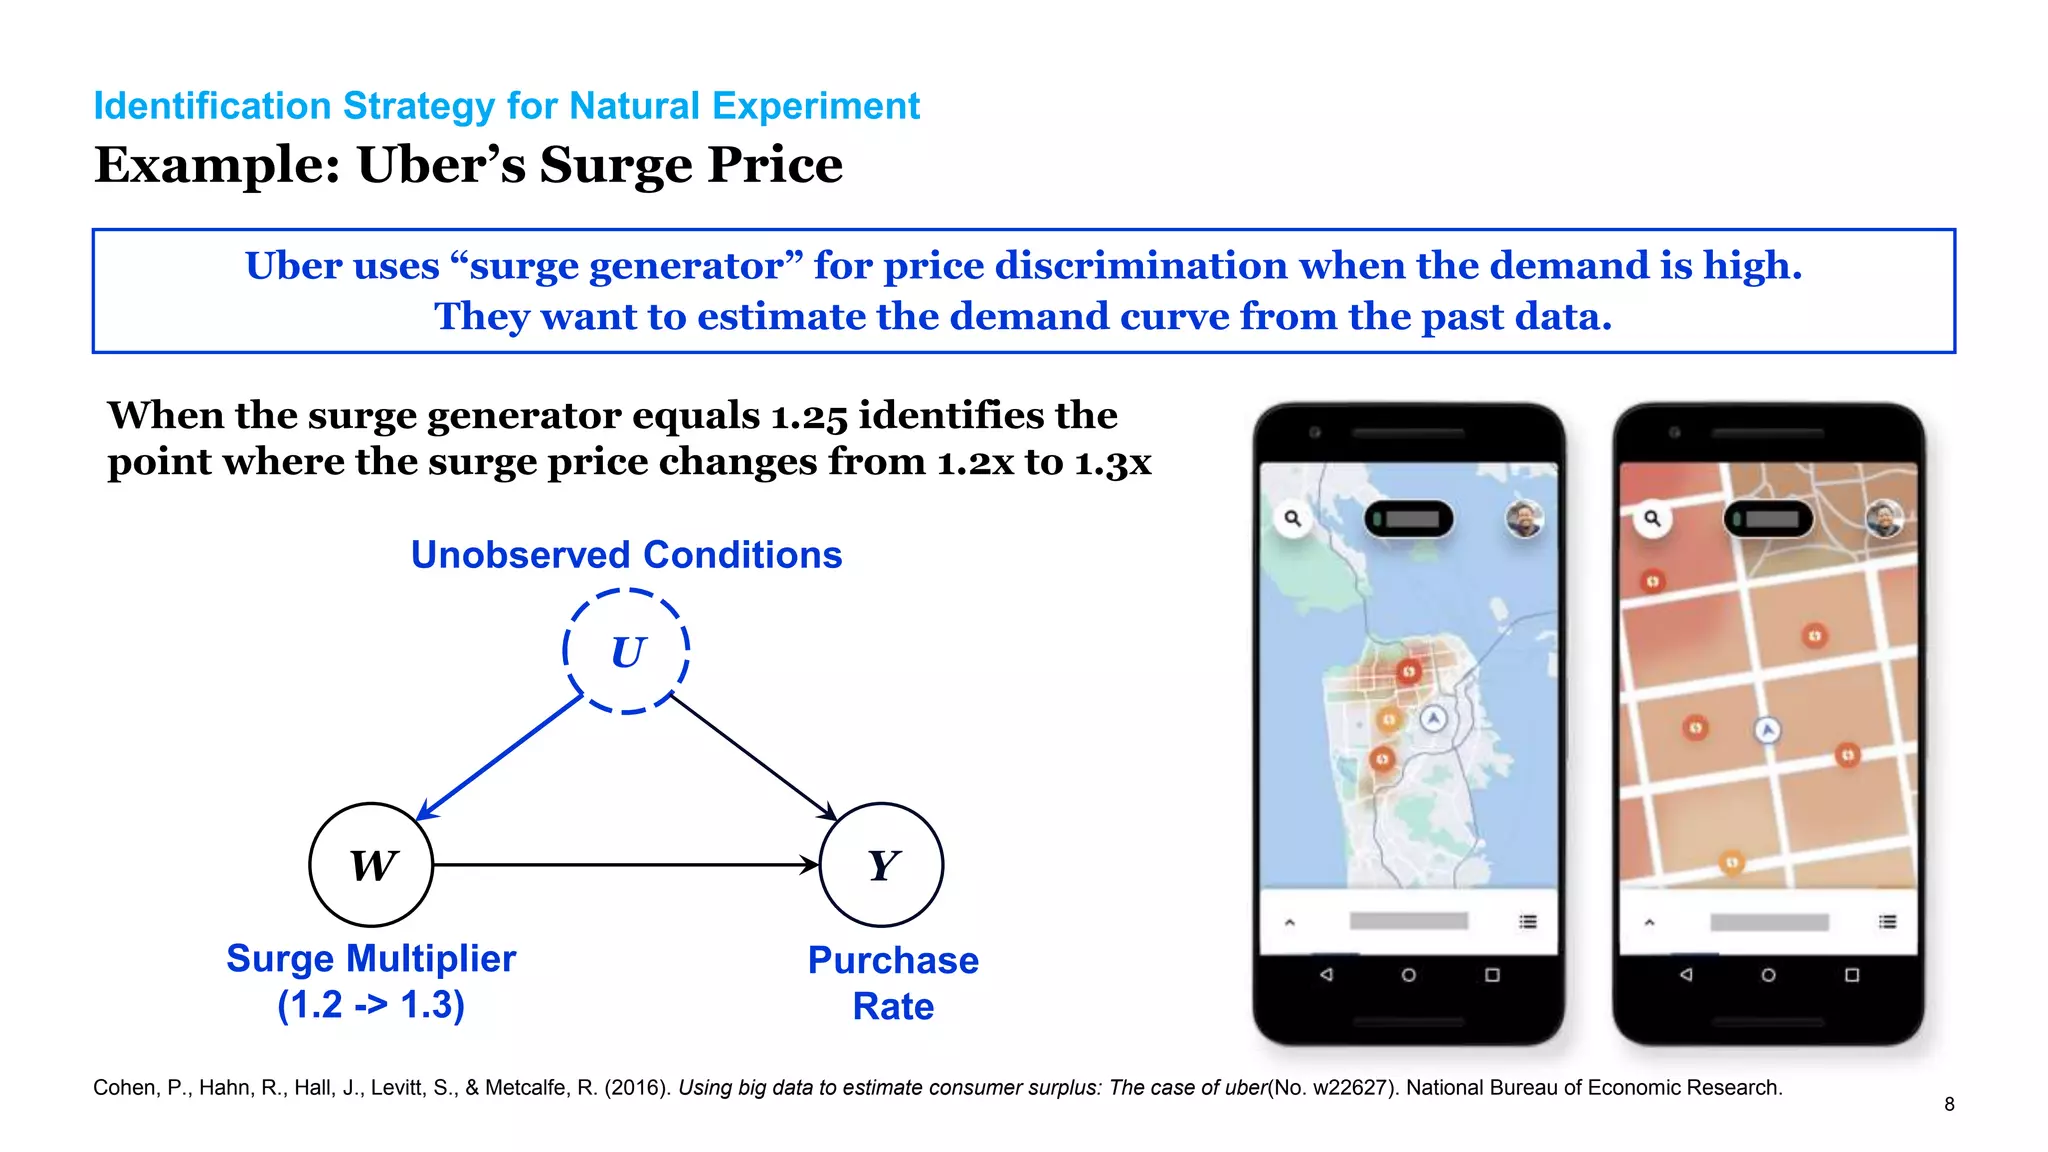
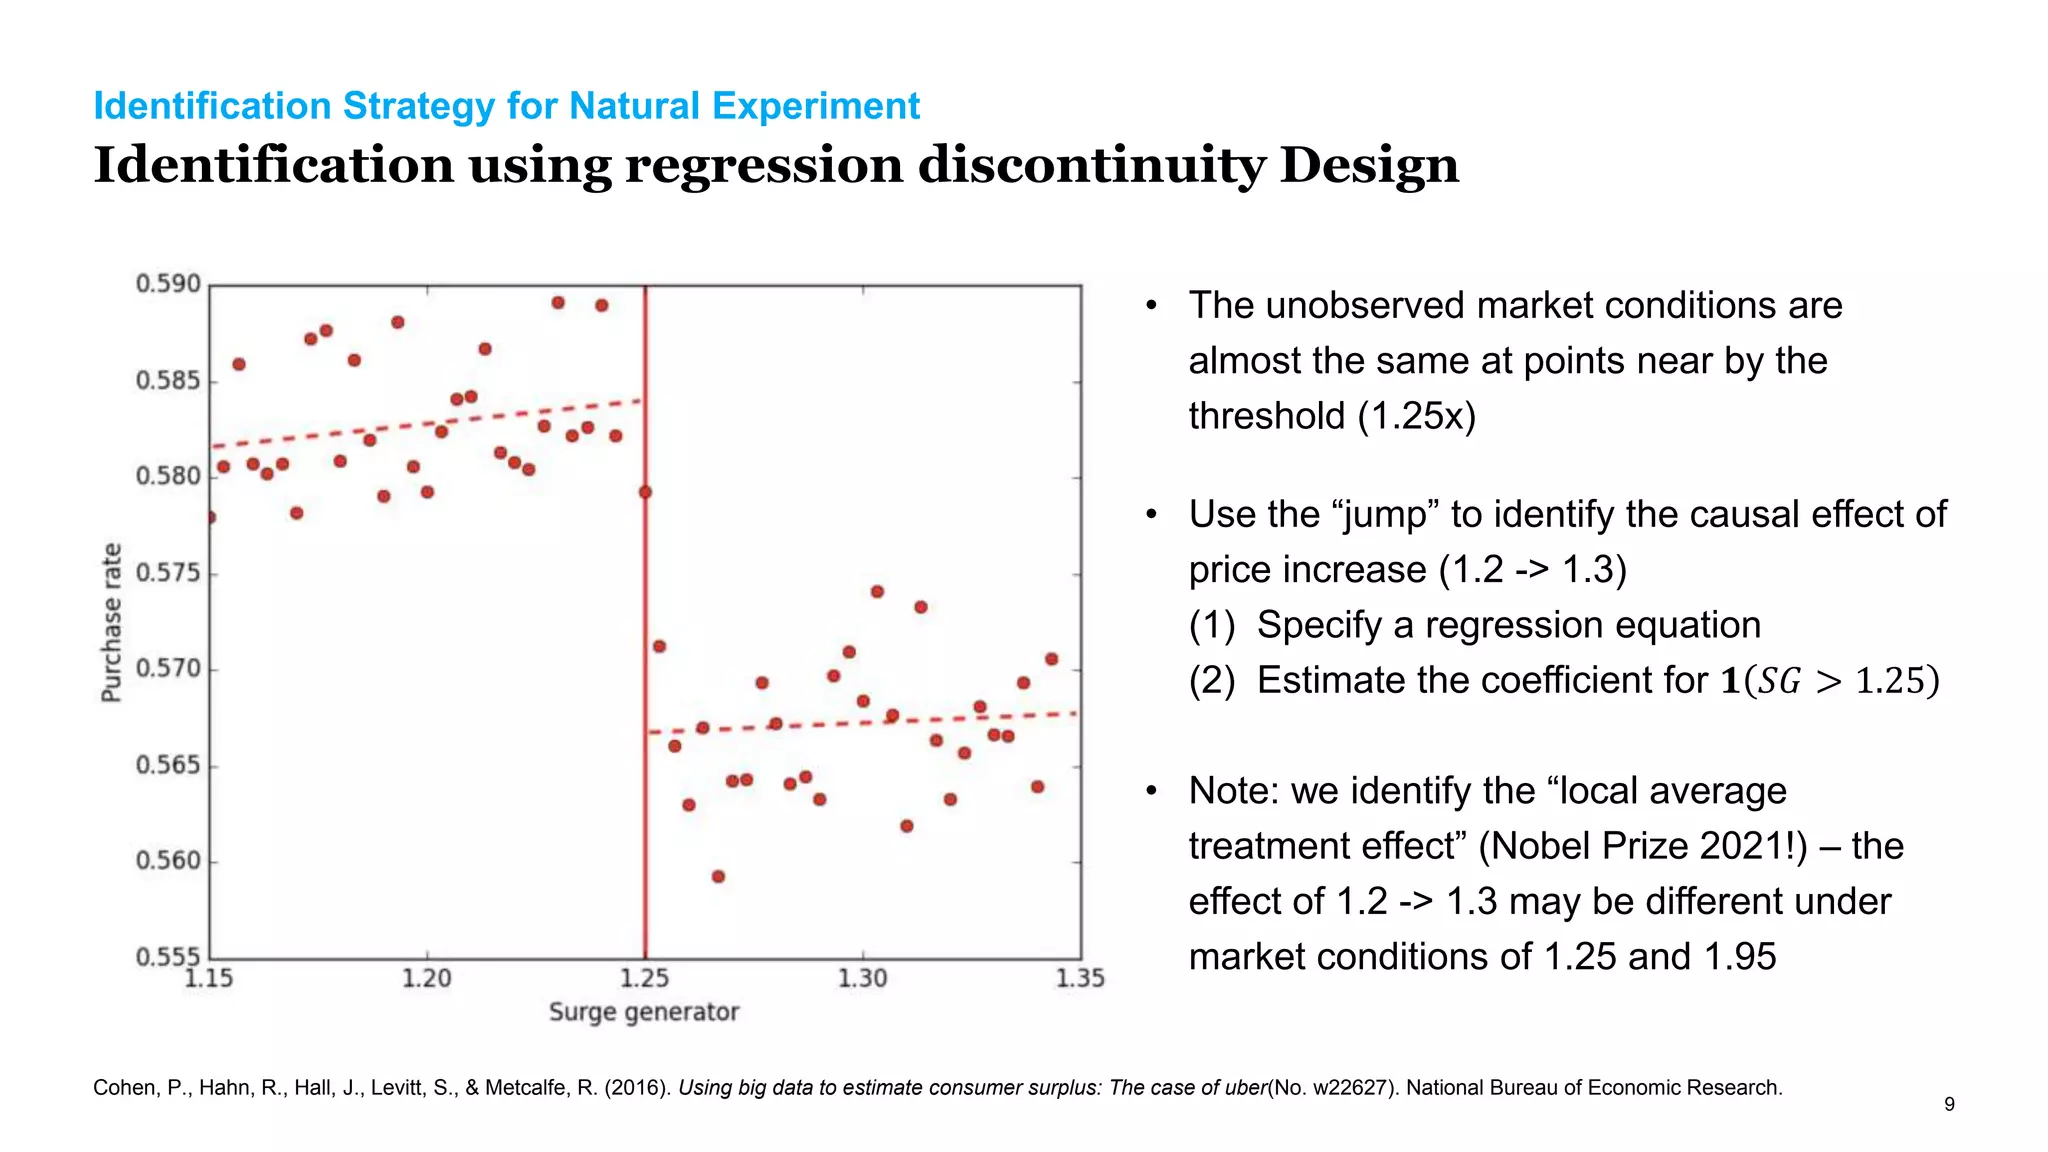
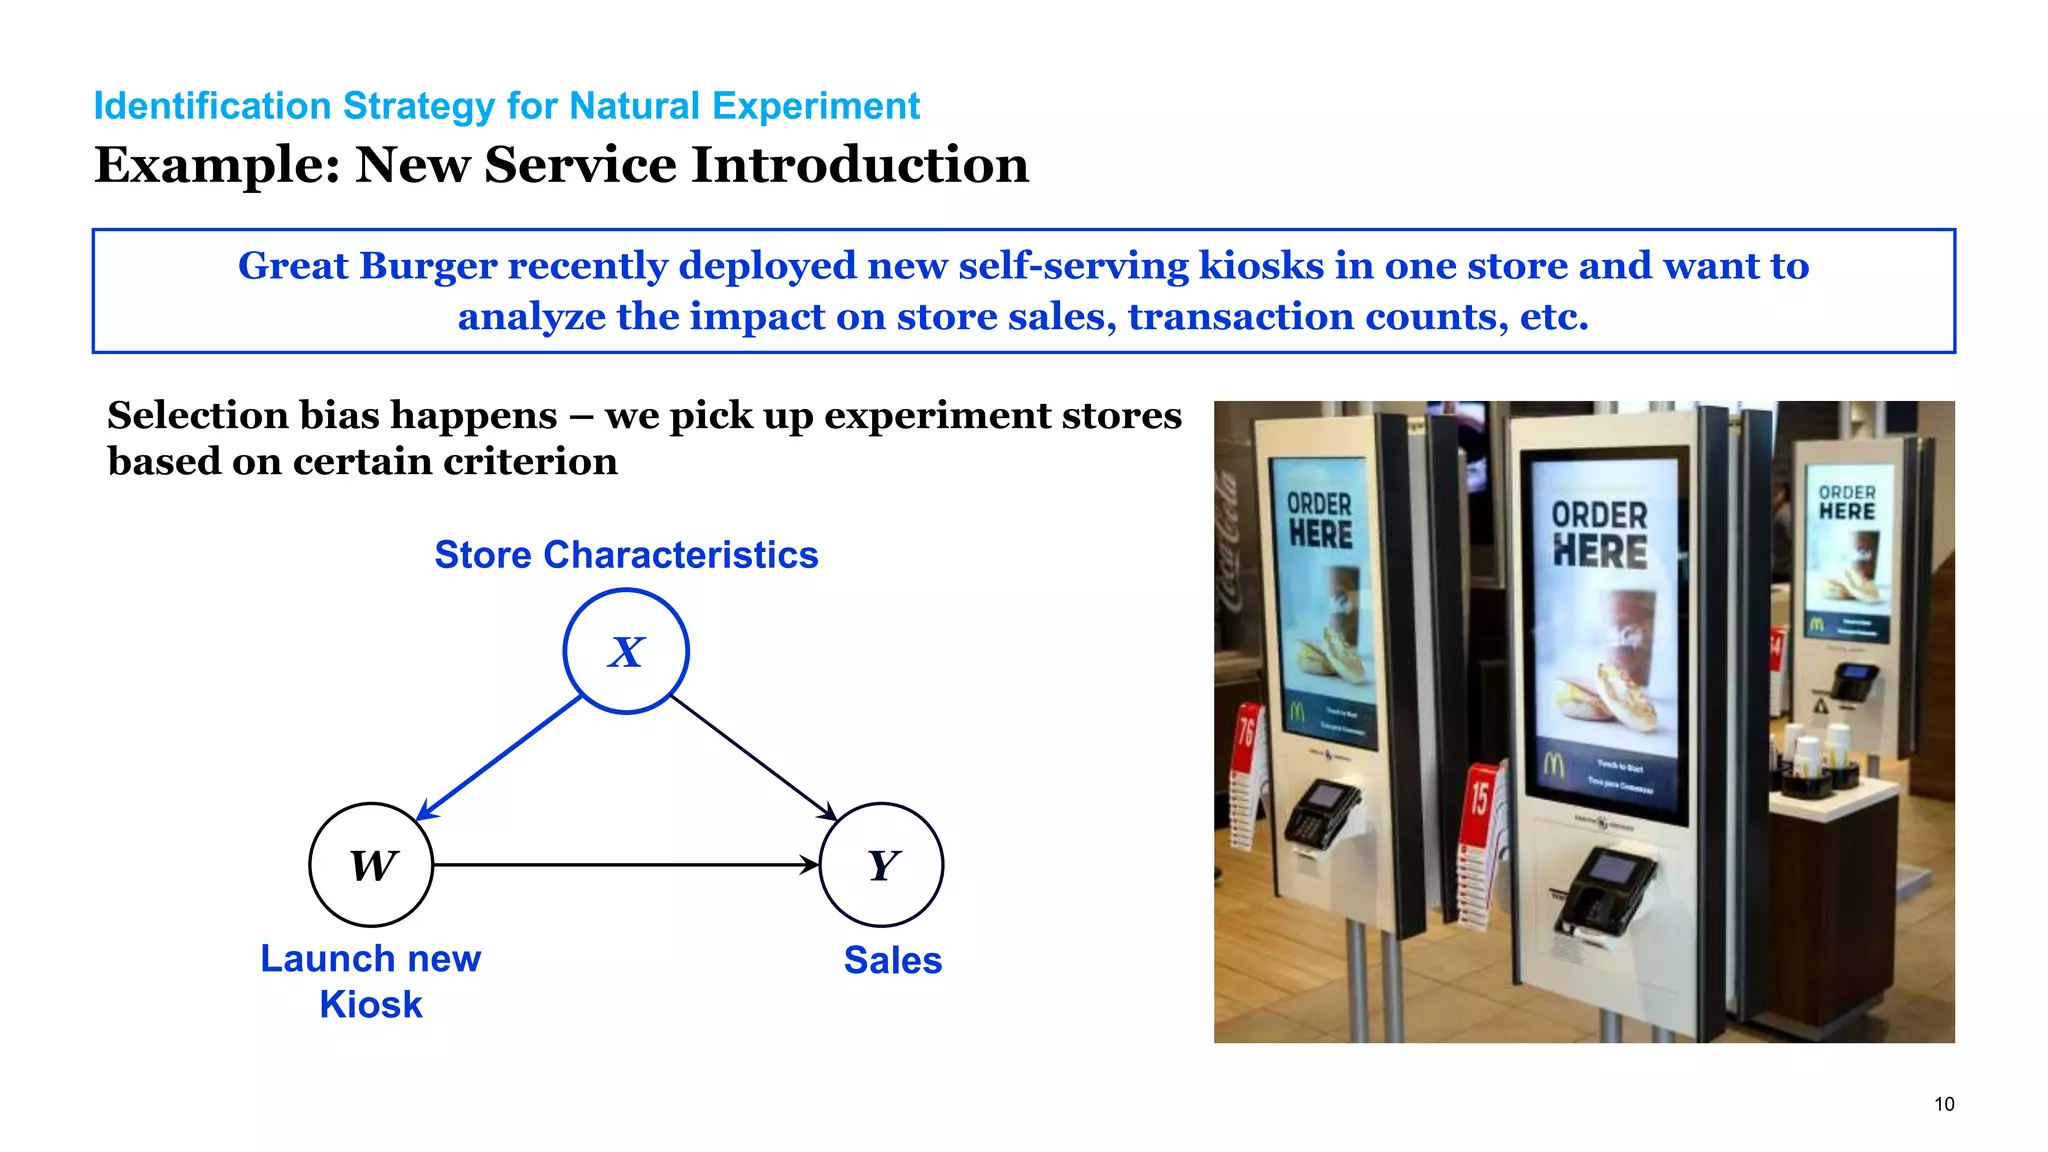
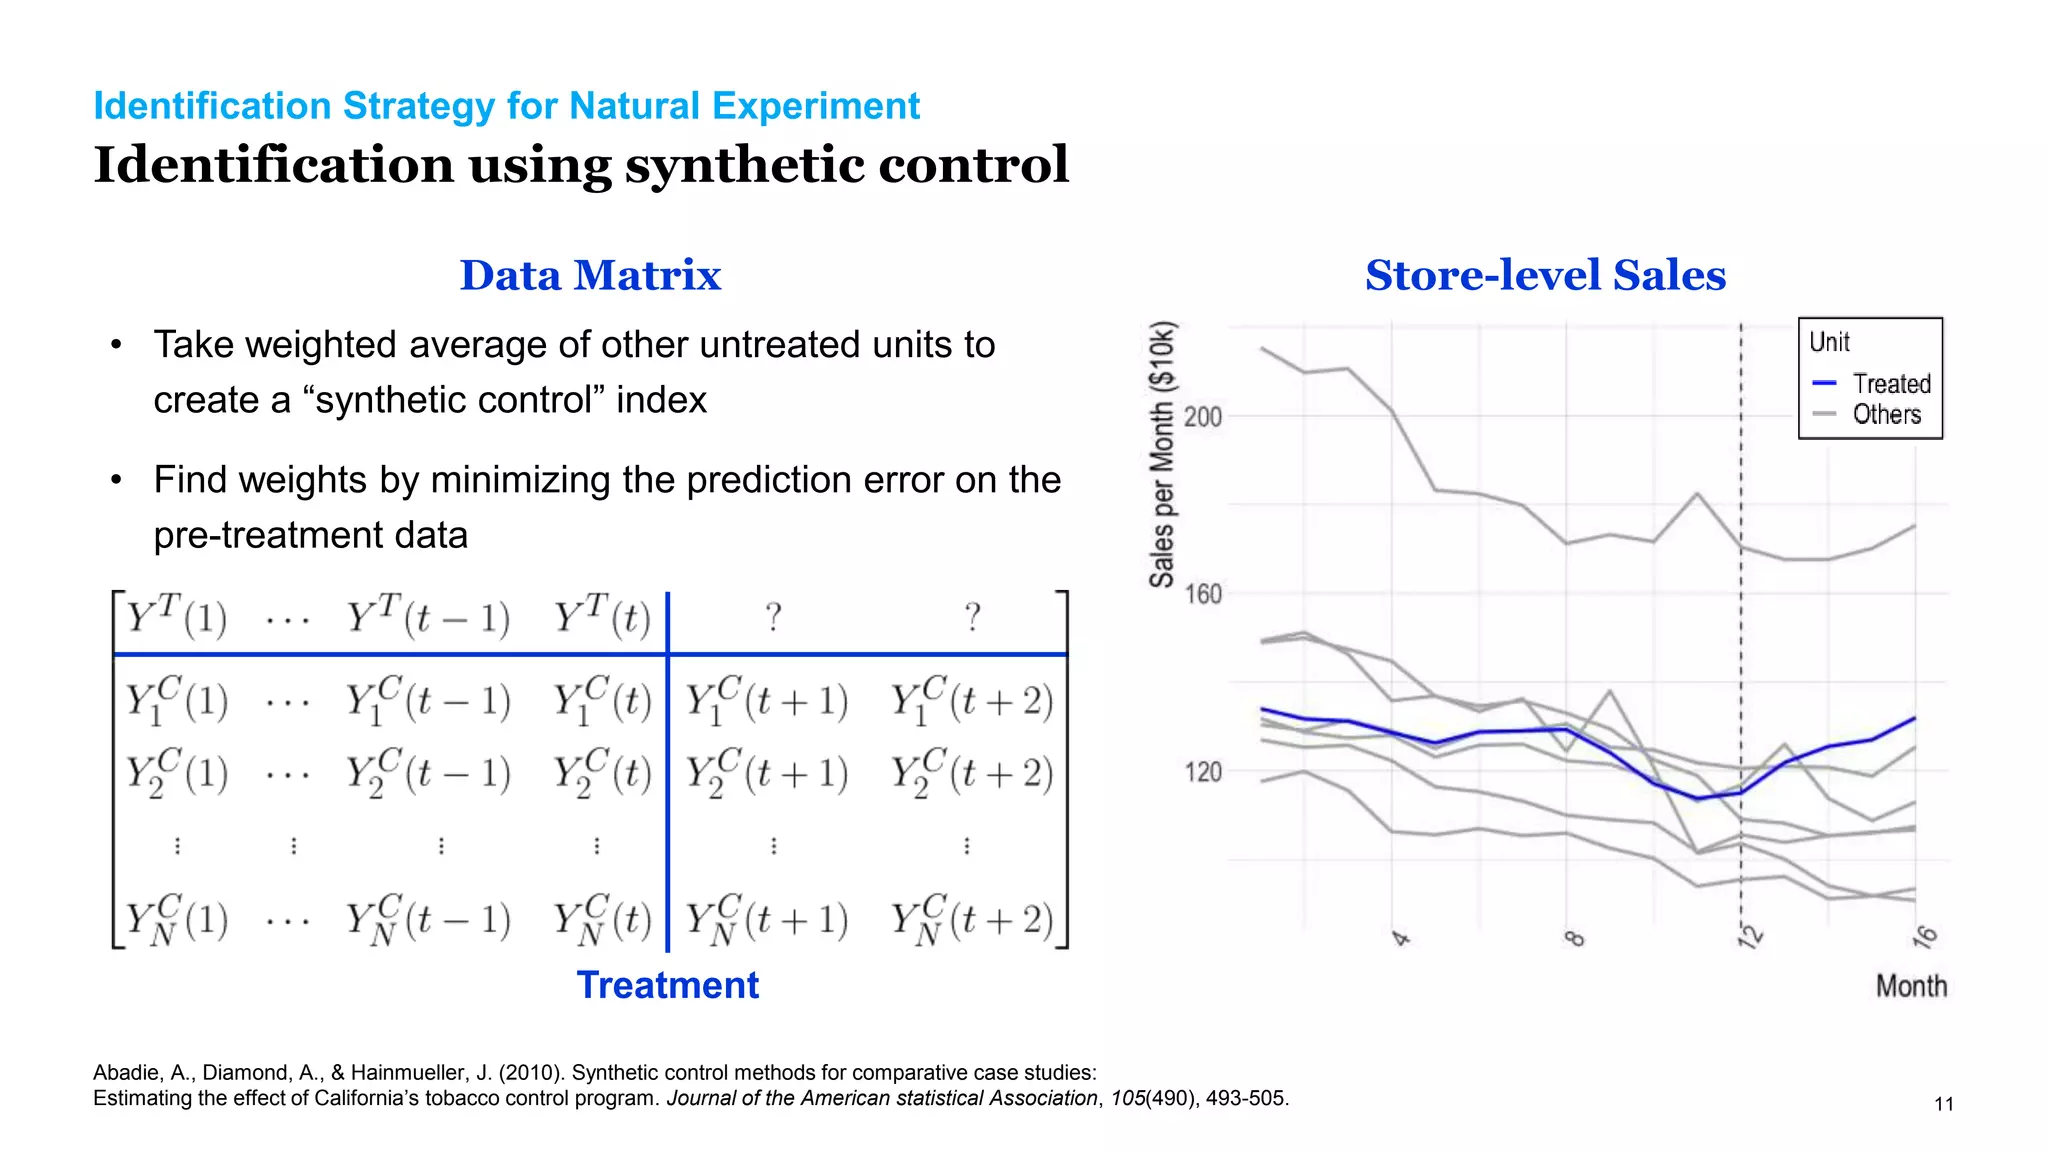
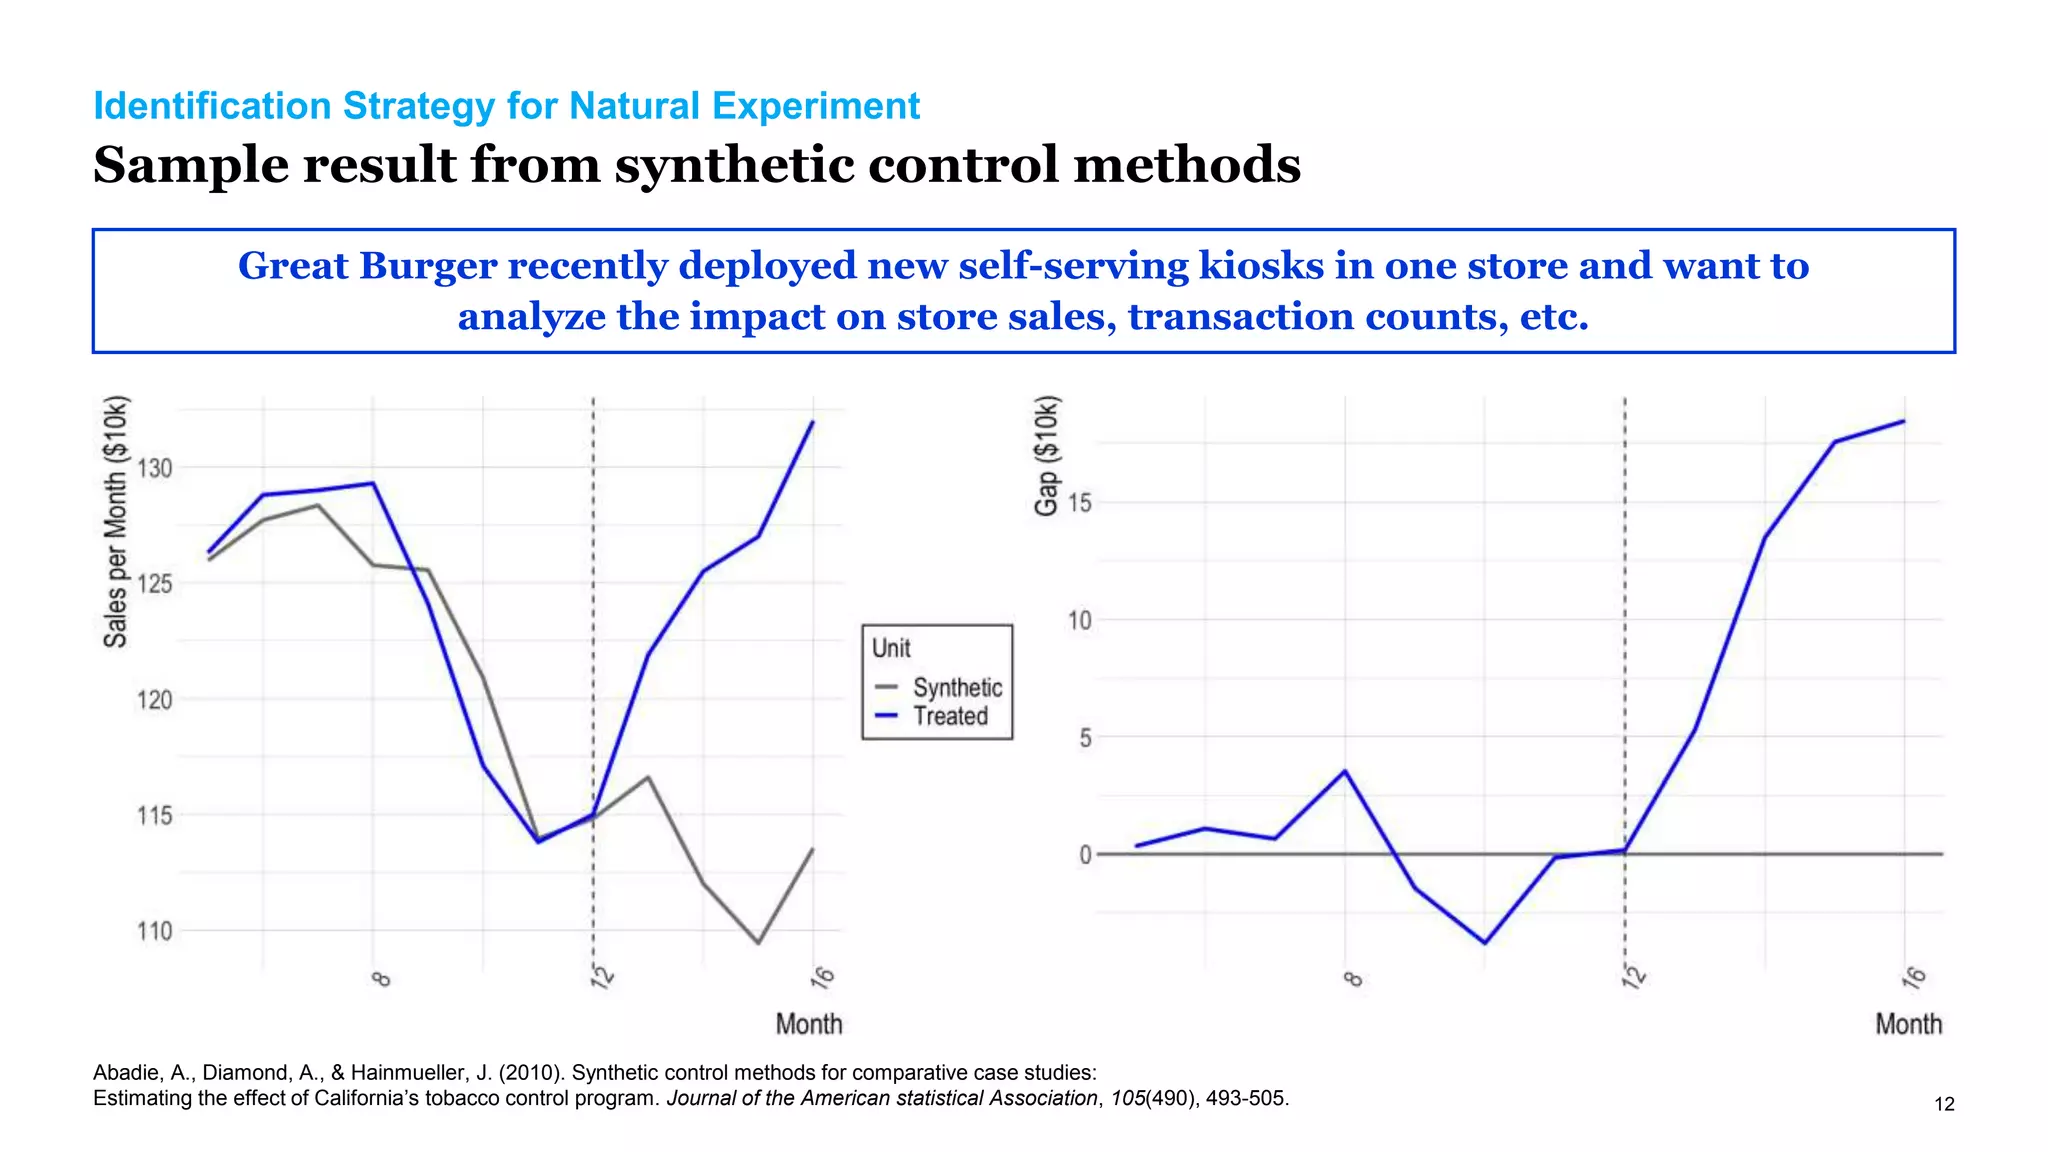
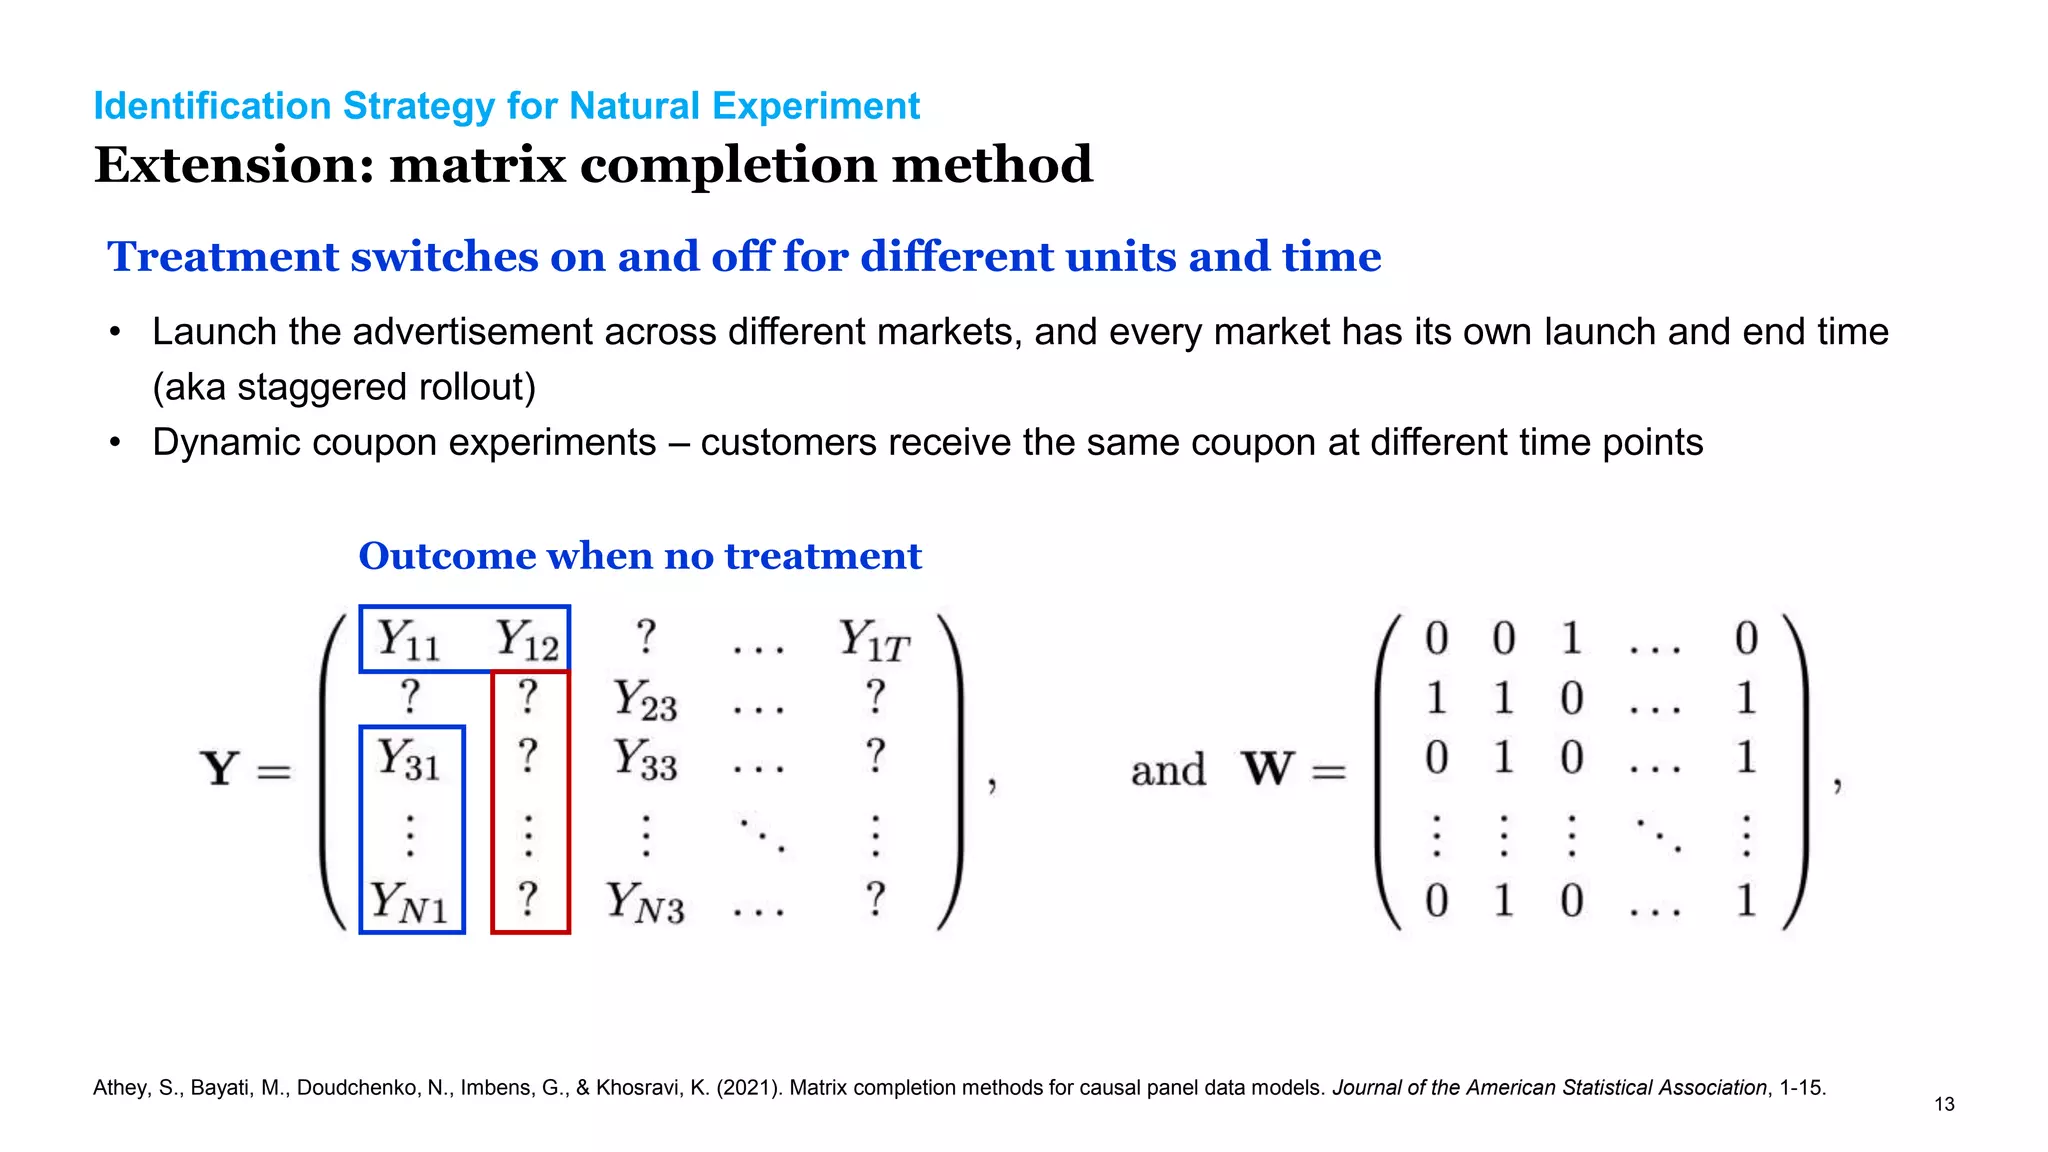
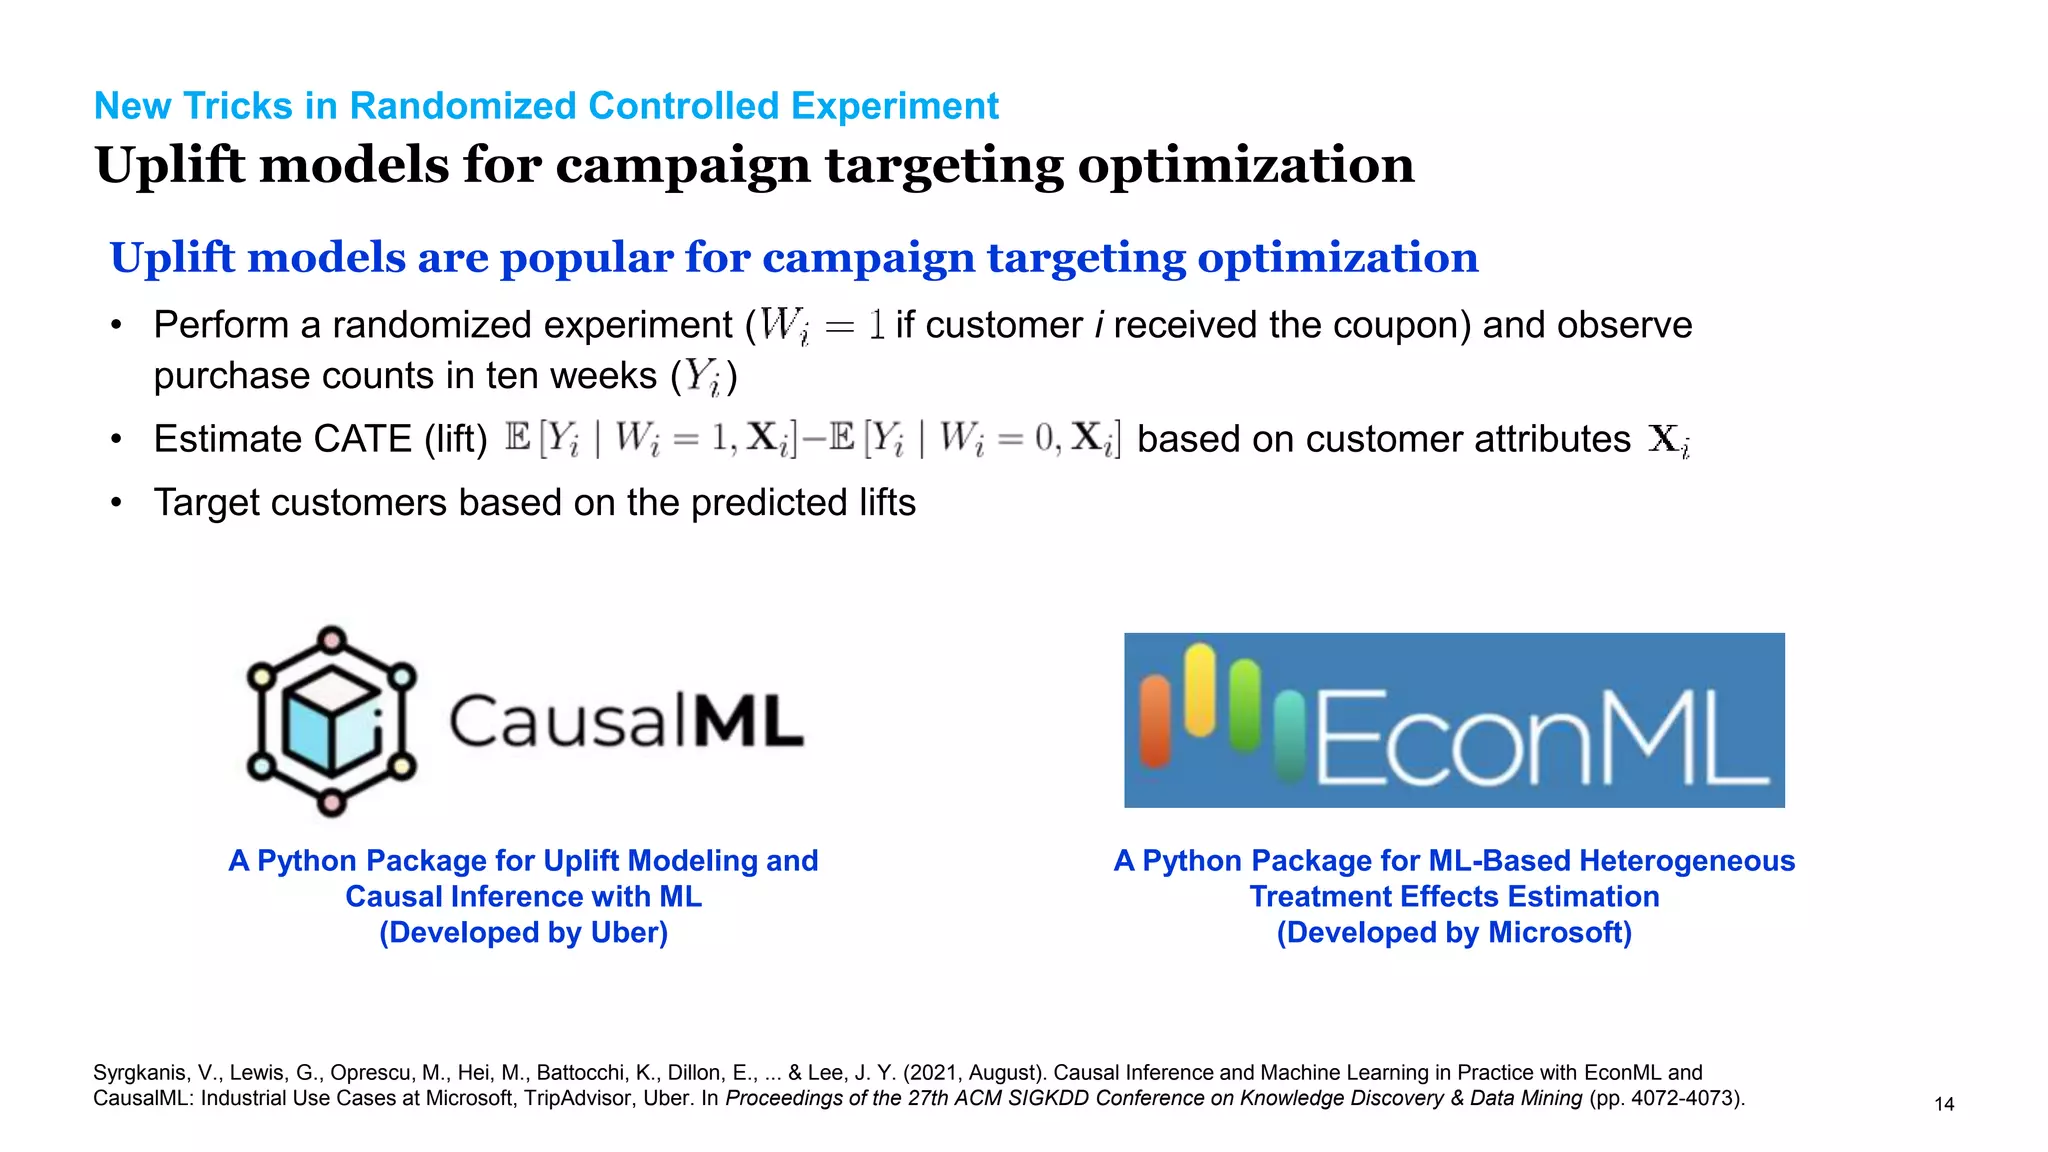
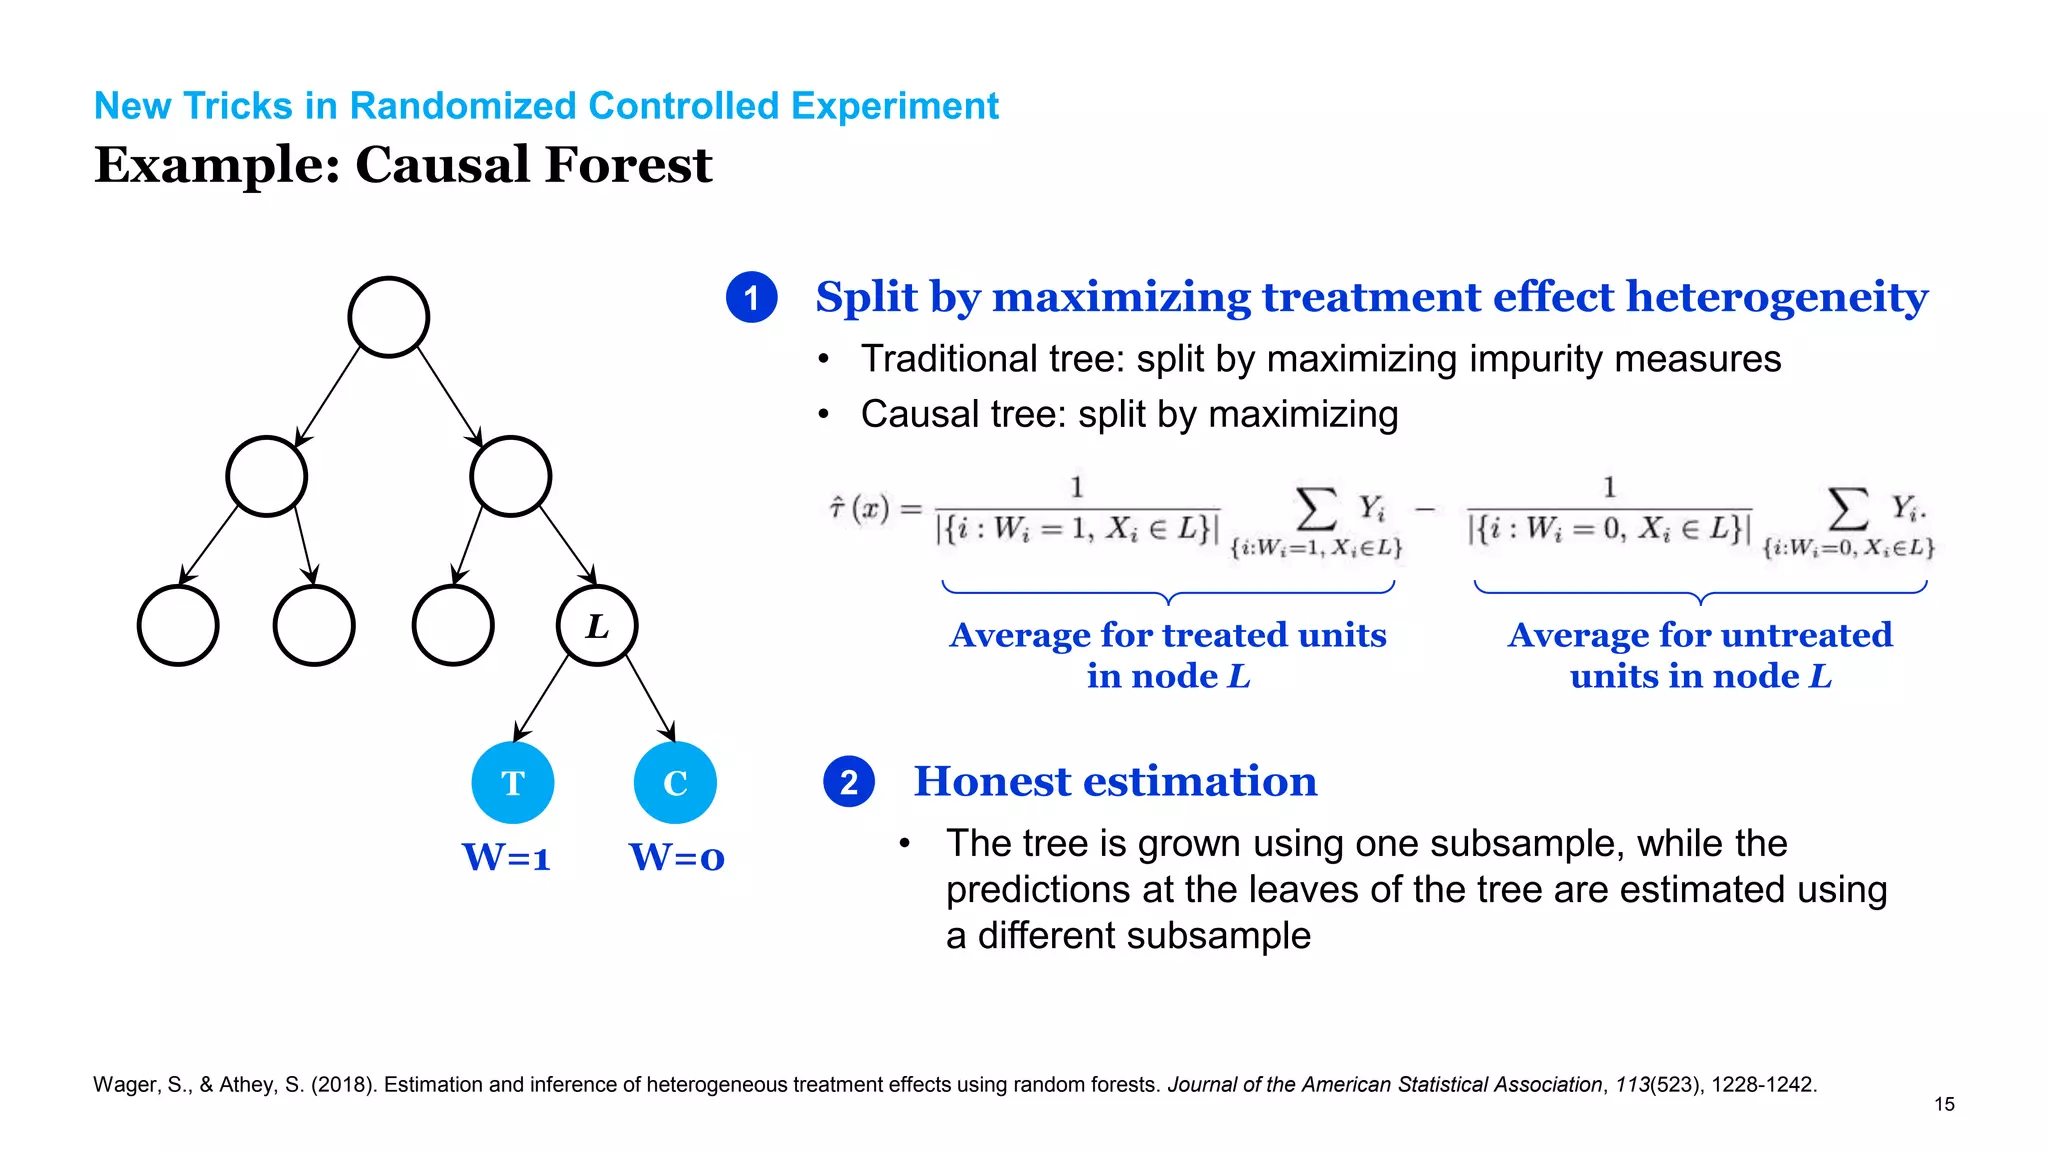
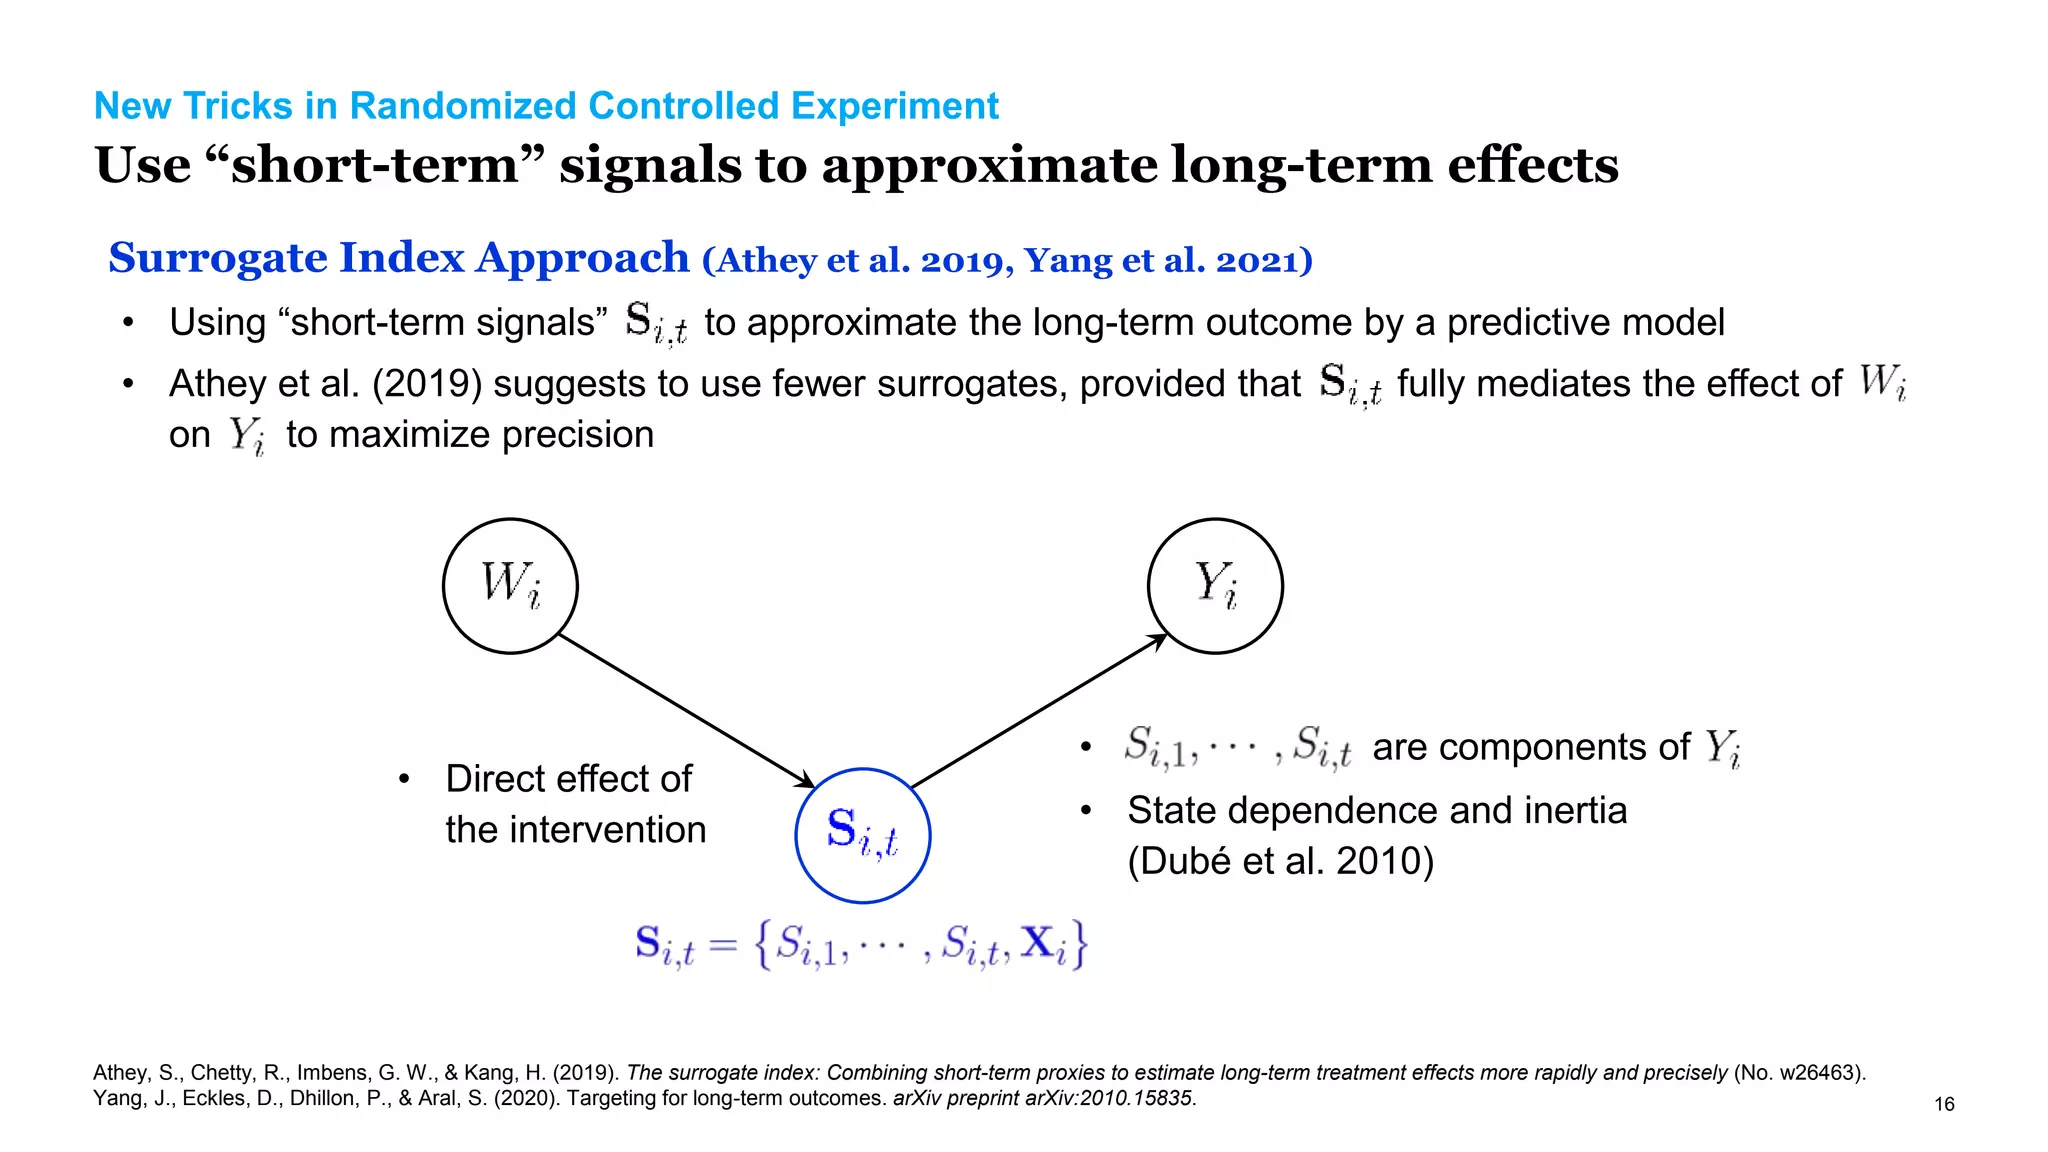
Ta-Wei Huang
Harvard Business School
Causal Inference in Marketing
2
Motivation
Prediction is not enough for many marketing problems
Pure ML Model
Assume that you are working for a telecom company. Your goal is to reduce the
customer churn rate by offering promotions for the next contract. How will you build
a machine learning model to address this problem?
• Let’s build a churn prediction model and
target customers who are predicted to have
the highest churn probability
Group (High to Low)
Impact
on
Churn
Rate
RCT + Experiment
• Let’s first run a RCT and analyze the impact
on churn rates
• Based on the experiment result, we can
predict “the impact for each customer”
Ascarza, E. (2018). Retention futility: Targeting high-risk customers might be ineffective. Journal of Marketing Research, 55(1), 80-98.
3
𝑆(𝑡 + 2)
Quantity
Retail
Price
𝐷(𝑡 + 1)
= 𝑆(𝑡 + 1)
𝐷(𝑡)
𝑆 𝑡
Motivation
Prediction is not enough for many marketing problems
Assume that you are working for a FMCG company. Your goal is to determine the optimal
price discount for a specific product (say Hand Sanitizer).How will you build a model to
address this problem?
Quantity
Retail
Price
Berry, S. T., & Haile, P. A. (2021). Foundations of Demand Estimation (No. w29305). National Bureau of Economic Research.
4
Motivation
Randomized controlled experiment is the state-of-art (really?)
RCT
Natural
Experiment
Correlational Study
Randomized Controlled Experiment
• Few assumptions (SUTVA)
• Clearly defined questions and designed experiments
Natural Experiment
• More assumptions, case-by-case verification
• Natural “variation” of treatment variables
Correlational Study
• No causal claim!
• Useful for hypothesis generation
Bojinov, I., Chen, A., & Liu, M. (2020). The importance of being causal. Harvard Data Science Review.
5
Identification of Causal Effects
Use DAGs to represent causal relationships among variables
X
Customer
Attributes Y
Churn?
W
Promotion
Proactive churn management Price promotion
Causal effect of W on Y is identifiable Causal effect of W on Y is not identifiable
Pearl, J., Glymour, M., & Jewell, N. P. (2016). Causal inference in statistics: A primer. John Wiley & Sons.
X
Demand &
Supply
Factors
Y
Quantity
W
Price
Variation
6
Identification of Causal Effects
Common identification problems in marketing
Endogeneity
1
Price
X
Y
W
Product Characteristics
Demand
Unobserved Confounders
2
Superbowl Ad?
U
Y
W
Unobserved Factors
Online WOM
⇒ instrument variables, regression
discontinuity design, difference-in-differences,
synthetic control, and more…
⇒ inverse probability weighting, doubly robust
estimation, double machine learning, and
more…
Cinelli, C., Forney, A., & Pearl, J. (2020). A crash course in good and bad controls. Available at SSRN, 3689437.
7
Identification of Causal Effects
Common selection bias in marketing
Endogenous Selection Bias
4
Push Notification
Z
Y
W
Open App
Sales
⇒ draw a causal DAG before analyzing your
data
Exogeneous Selection Bias
3
Coupon?
X
Y
W
Past Spend
Future Spend
⇒ inverse probability weighting, doubly robust
estimation, double machine learning, and
more…
Cinelli, C., Forney, A., & Pearl, J. (2020). A crash course in good and bad controls. Available at SSRN, 3689437.
8
Identification Strategy for Natural Experiment
Example: Uber’s Surge Price
Uber uses “surge generator” for price discrimination when the demand is high.
They want to estimate the demand curve from the past data.
When the surge generator equals 1.25 identifies the
point where the surge price changes from 1.2x to 1.3x
Surge Multiplier
(1.2 -> 1.3)
U
Y
W
Unobserved Conditions
Purchase
Rate
Cohen, P., Hahn, R., Hall, J., Levitt, S., & Metcalfe, R. (2016). Using big data to estimate consumer surplus: The case of uber(No. w22627). National Bureau of Economic Research.
9
Identification Strategy for Natural Experiment
Identification using regression discontinuity Design
• The unobserved market conditions are
almost the same at points near by the
threshold (1.25x)
• Use the “jump” to identify the causal effect of
price increase (1.2 -> 1.3)
(1) Specify a regression equation
(2) Estimate the coefficient for 𝟏 𝑆𝐺 > 1.25
• Note: we identify the “local average
treatment effect” (Nobel Prize 2021!) – the
effect of 1.2 -> 1.3 may be different under
market conditions of 1.25 and 1.95
Cohen, P., Hahn, R., Hall, J., Levitt, S., & Metcalfe, R. (2016). Using big data to estimate consumer surplus: The case of uber(No. w22627). National Bureau of Economic Research.
10
Identification Strategy for Natural Experiment
Example: New Service Introduction
Great Burger recently deployed new self-serving kiosks in one store and want to
analyze the impact on store sales, transaction counts, etc.
Selection bias happens – we pick up experiment stores
based on certain criterion
Launch new
Kiosk
X
Y
W
Store Characteristics
Sales
11
Identification Strategy for Natural Experiment
Identification using synthetic control
Store-level Sales
Data Matrix
Treatment
• Take weighted average of other untreated units to
create a “synthetic control” index
• Find weights by minimizing the prediction error on the
pre-treatment data
Abadie, A., Diamond, A., & Hainmueller, J. (2010). Synthetic control methods for comparative case studies:
Estimating the effect of California’s tobacco control program. Journal of the American statistical Association, 105(490), 493-505.
12
Identification Strategy for Natural Experiment
Sample result from synthetic control methods
Great Burger recently deployed new self-serving kiosks in one store and want to
analyze the impact on store sales, transaction counts, etc.
Abadie, A., Diamond, A., & Hainmueller, J. (2010). Synthetic control methods for comparative case studies:
Estimating the effect of California’s tobacco control program. Journal of the American statistical Association, 105(490), 493-505.
13
Identification Strategy for Natural Experiment
Extension: matrix completion method
Treatment switches on and off for different units and time
• Launch the advertisement across different markets, and every market has its own launch and end time
(aka staggered rollout)
• Dynamic coupon experiments – customers receive the same coupon at different time points
Outcome when no treatment
Athey, S., Bayati, M., Doudchenko, N., Imbens, G., & Khosravi, K. (2021). Matrix completion methods for causal panel data models. Journal of the American Statistical Association, 1-15.
14
New Tricks in Randomized Controlled Experiment
Uplift models for campaign targeting optimization
Uplift models are popular for campaign targeting optimization
• Perform a randomized experiment ( if customer i received the coupon) and observe
purchase counts in ten weeks ( )
• Estimate CATE (lift) based on customer attributes
• Target customers based on the predicted lifts
A Python Package for Uplift Modeling and
Causal Inference with ML
(Developed by Uber)
A Python Package for ML-Based Heterogeneous
Treatment Effects Estimation
(Developed by Microsoft)
Syrgkanis, V., Lewis, G., Oprescu, M., Hei, M., Battocchi, K., Dillon, E., ... & Lee, J. Y. (2021, August). Causal Inference and Machine Learning in Practice with EconML and
CausalML: Industrial Use Cases at Microsoft, TripAdvisor, Uber. In Proceedings of the 27th ACM SIGKDD Conference on Knowledge Discovery & Data Mining (pp. 4072-4073).
15
New Tricks in Randomized Controlled Experiment
Example: Causal Forest
L
T C
Split by maximizing treatment effect heterogeneity
1
• Traditional tree: split by maximizing impurity measures
• Causal tree: split by maximizing
W=1 W=0
Average for treated units
in node L
Average for untreated
units in node L
Honest estimation
2
• The tree is grown using one subsample, while the
predictions at the leaves of the tree are estimated using
a different subsample
Wager, S., & Athey, S. (2018). Estimation and inference of heterogeneous treatment effects using random forests. Journal of the American Statistical Association, 113(523), 1228-1242.
16
• Athey et al. (2019) suggests to use fewer surrogates, provided that fully mediates the effect of
on to maximize precision
New Tricks in Randomized Controlled Experiment
Use “short-term” signals to approximate long-term effects
Surrogate Index Approach (Athey et al. 2019, Yang et al. 2021)
• are components of
• State dependence and inertia
(Dubé et al. 2010)
• Direct effect of
the intervention
• Using “short-term signals” to approximate the long-term outcome by a predictive model
Athey, S., Chetty, R., Imbens, G. W., & Kang, H. (2019). The surrogate index: Combining short-term proxies to estimate long-term treatment effects more rapidly and precisely (No. w26463).
Yang, J., Eckles, D., Dhillon, P., & Aral, S. (2020). Targeting for long-term outcomes. arXiv preprint arXiv:2010.15835.
17
Thank you!
E-mail thuang@hbs.edu for any research collaboration!

Causal Inference in Marketing

  • 1.
    Ta-Wei Huang Harvard BusinessSchool Causal Inference in Marketing
  • 2.
    2 Motivation Prediction is notenough for many marketing problems Pure ML Model Assume that you are working for a telecom company. Your goal is to reduce the customer churn rate by offering promotions for the next contract. How will you build a machine learning model to address this problem? • Let’s build a churn prediction model and target customers who are predicted to have the highest churn probability Group (High to Low) Impact on Churn Rate RCT + Experiment • Let’s first run a RCT and analyze the impact on churn rates • Based on the experiment result, we can predict “the impact for each customer” Ascarza, E. (2018). Retention futility: Targeting high-risk customers might be ineffective. Journal of Marketing Research, 55(1), 80-98.
  • 3.
    3 𝑆(𝑡 + 2) Quantity Retail Price 𝐷(𝑡+ 1) = 𝑆(𝑡 + 1) 𝐷(𝑡) 𝑆 𝑡 Motivation Prediction is not enough for many marketing problems Assume that you are working for a FMCG company. Your goal is to determine the optimal price discount for a specific product (say Hand Sanitizer).How will you build a model to address this problem? Quantity Retail Price Berry, S. T., & Haile, P. A. (2021). Foundations of Demand Estimation (No. w29305). National Bureau of Economic Research.
  • 4.
    4 Motivation Randomized controlled experimentis the state-of-art (really?) RCT Natural Experiment Correlational Study Randomized Controlled Experiment • Few assumptions (SUTVA) • Clearly defined questions and designed experiments Natural Experiment • More assumptions, case-by-case verification • Natural “variation” of treatment variables Correlational Study • No causal claim! • Useful for hypothesis generation Bojinov, I., Chen, A., & Liu, M. (2020). The importance of being causal. Harvard Data Science Review.
  • 5.
    5 Identification of CausalEffects Use DAGs to represent causal relationships among variables X Customer Attributes Y Churn? W Promotion Proactive churn management Price promotion Causal effect of W on Y is identifiable Causal effect of W on Y is not identifiable Pearl, J., Glymour, M., & Jewell, N. P. (2016). Causal inference in statistics: A primer. John Wiley & Sons. X Demand & Supply Factors Y Quantity W Price Variation
  • 6.
    6 Identification of CausalEffects Common identification problems in marketing Endogeneity 1 Price X Y W Product Characteristics Demand Unobserved Confounders 2 Superbowl Ad? U Y W Unobserved Factors Online WOM ⇒ instrument variables, regression discontinuity design, difference-in-differences, synthetic control, and more… ⇒ inverse probability weighting, doubly robust estimation, double machine learning, and more… Cinelli, C., Forney, A., & Pearl, J. (2020). A crash course in good and bad controls. Available at SSRN, 3689437.
  • 7.
    7 Identification of CausalEffects Common selection bias in marketing Endogenous Selection Bias 4 Push Notification Z Y W Open App Sales ⇒ draw a causal DAG before analyzing your data Exogeneous Selection Bias 3 Coupon? X Y W Past Spend Future Spend ⇒ inverse probability weighting, doubly robust estimation, double machine learning, and more… Cinelli, C., Forney, A., & Pearl, J. (2020). A crash course in good and bad controls. Available at SSRN, 3689437.
  • 8.
    8 Identification Strategy forNatural Experiment Example: Uber’s Surge Price Uber uses “surge generator” for price discrimination when the demand is high. They want to estimate the demand curve from the past data. When the surge generator equals 1.25 identifies the point where the surge price changes from 1.2x to 1.3x Surge Multiplier (1.2 -> 1.3) U Y W Unobserved Conditions Purchase Rate Cohen, P., Hahn, R., Hall, J., Levitt, S., & Metcalfe, R. (2016). Using big data to estimate consumer surplus: The case of uber(No. w22627). National Bureau of Economic Research.
  • 9.
    9 Identification Strategy forNatural Experiment Identification using regression discontinuity Design • The unobserved market conditions are almost the same at points near by the threshold (1.25x) • Use the “jump” to identify the causal effect of price increase (1.2 -> 1.3) (1) Specify a regression equation (2) Estimate the coefficient for 𝟏 𝑆𝐺 > 1.25 • Note: we identify the “local average treatment effect” (Nobel Prize 2021!) – the effect of 1.2 -> 1.3 may be different under market conditions of 1.25 and 1.95 Cohen, P., Hahn, R., Hall, J., Levitt, S., & Metcalfe, R. (2016). Using big data to estimate consumer surplus: The case of uber(No. w22627). National Bureau of Economic Research.
  • 10.
    10 Identification Strategy forNatural Experiment Example: New Service Introduction Great Burger recently deployed new self-serving kiosks in one store and want to analyze the impact on store sales, transaction counts, etc. Selection bias happens – we pick up experiment stores based on certain criterion Launch new Kiosk X Y W Store Characteristics Sales
  • 11.
    11 Identification Strategy forNatural Experiment Identification using synthetic control Store-level Sales Data Matrix Treatment • Take weighted average of other untreated units to create a “synthetic control” index • Find weights by minimizing the prediction error on the pre-treatment data Abadie, A., Diamond, A., & Hainmueller, J. (2010). Synthetic control methods for comparative case studies: Estimating the effect of California’s tobacco control program. Journal of the American statistical Association, 105(490), 493-505.
  • 12.
    12 Identification Strategy forNatural Experiment Sample result from synthetic control methods Great Burger recently deployed new self-serving kiosks in one store and want to analyze the impact on store sales, transaction counts, etc. Abadie, A., Diamond, A., & Hainmueller, J. (2010). Synthetic control methods for comparative case studies: Estimating the effect of California’s tobacco control program. Journal of the American statistical Association, 105(490), 493-505.
  • 13.
    13 Identification Strategy forNatural Experiment Extension: matrix completion method Treatment switches on and off for different units and time • Launch the advertisement across different markets, and every market has its own launch and end time (aka staggered rollout) • Dynamic coupon experiments – customers receive the same coupon at different time points Outcome when no treatment Athey, S., Bayati, M., Doudchenko, N., Imbens, G., & Khosravi, K. (2021). Matrix completion methods for causal panel data models. Journal of the American Statistical Association, 1-15.
  • 14.
    14 New Tricks inRandomized Controlled Experiment Uplift models for campaign targeting optimization Uplift models are popular for campaign targeting optimization • Perform a randomized experiment ( if customer i received the coupon) and observe purchase counts in ten weeks ( ) • Estimate CATE (lift) based on customer attributes • Target customers based on the predicted lifts A Python Package for Uplift Modeling and Causal Inference with ML (Developed by Uber) A Python Package for ML-Based Heterogeneous Treatment Effects Estimation (Developed by Microsoft) Syrgkanis, V., Lewis, G., Oprescu, M., Hei, M., Battocchi, K., Dillon, E., ... & Lee, J. Y. (2021, August). Causal Inference and Machine Learning in Practice with EconML and CausalML: Industrial Use Cases at Microsoft, TripAdvisor, Uber. In Proceedings of the 27th ACM SIGKDD Conference on Knowledge Discovery & Data Mining (pp. 4072-4073).
  • 15.
    15 New Tricks inRandomized Controlled Experiment Example: Causal Forest L T C Split by maximizing treatment effect heterogeneity 1 • Traditional tree: split by maximizing impurity measures • Causal tree: split by maximizing W=1 W=0 Average for treated units in node L Average for untreated units in node L Honest estimation 2 • The tree is grown using one subsample, while the predictions at the leaves of the tree are estimated using a different subsample Wager, S., & Athey, S. (2018). Estimation and inference of heterogeneous treatment effects using random forests. Journal of the American Statistical Association, 113(523), 1228-1242.
  • 16.
    16 • Athey etal. (2019) suggests to use fewer surrogates, provided that fully mediates the effect of on to maximize precision New Tricks in Randomized Controlled Experiment Use “short-term” signals to approximate long-term effects Surrogate Index Approach (Athey et al. 2019, Yang et al. 2021) • are components of • State dependence and inertia (Dubé et al. 2010) • Direct effect of the intervention • Using “short-term signals” to approximate the long-term outcome by a predictive model Athey, S., Chetty, R., Imbens, G. W., & Kang, H. (2019). The surrogate index: Combining short-term proxies to estimate long-term treatment effects more rapidly and precisely (No. w26463). Yang, J., Eckles, D., Dhillon, P., & Aral, S. (2020). Targeting for long-term outcomes. arXiv preprint arXiv:2010.15835.
  • 17.
    17 Thank you! E-mail thuang@hbs.edufor any research collaboration!