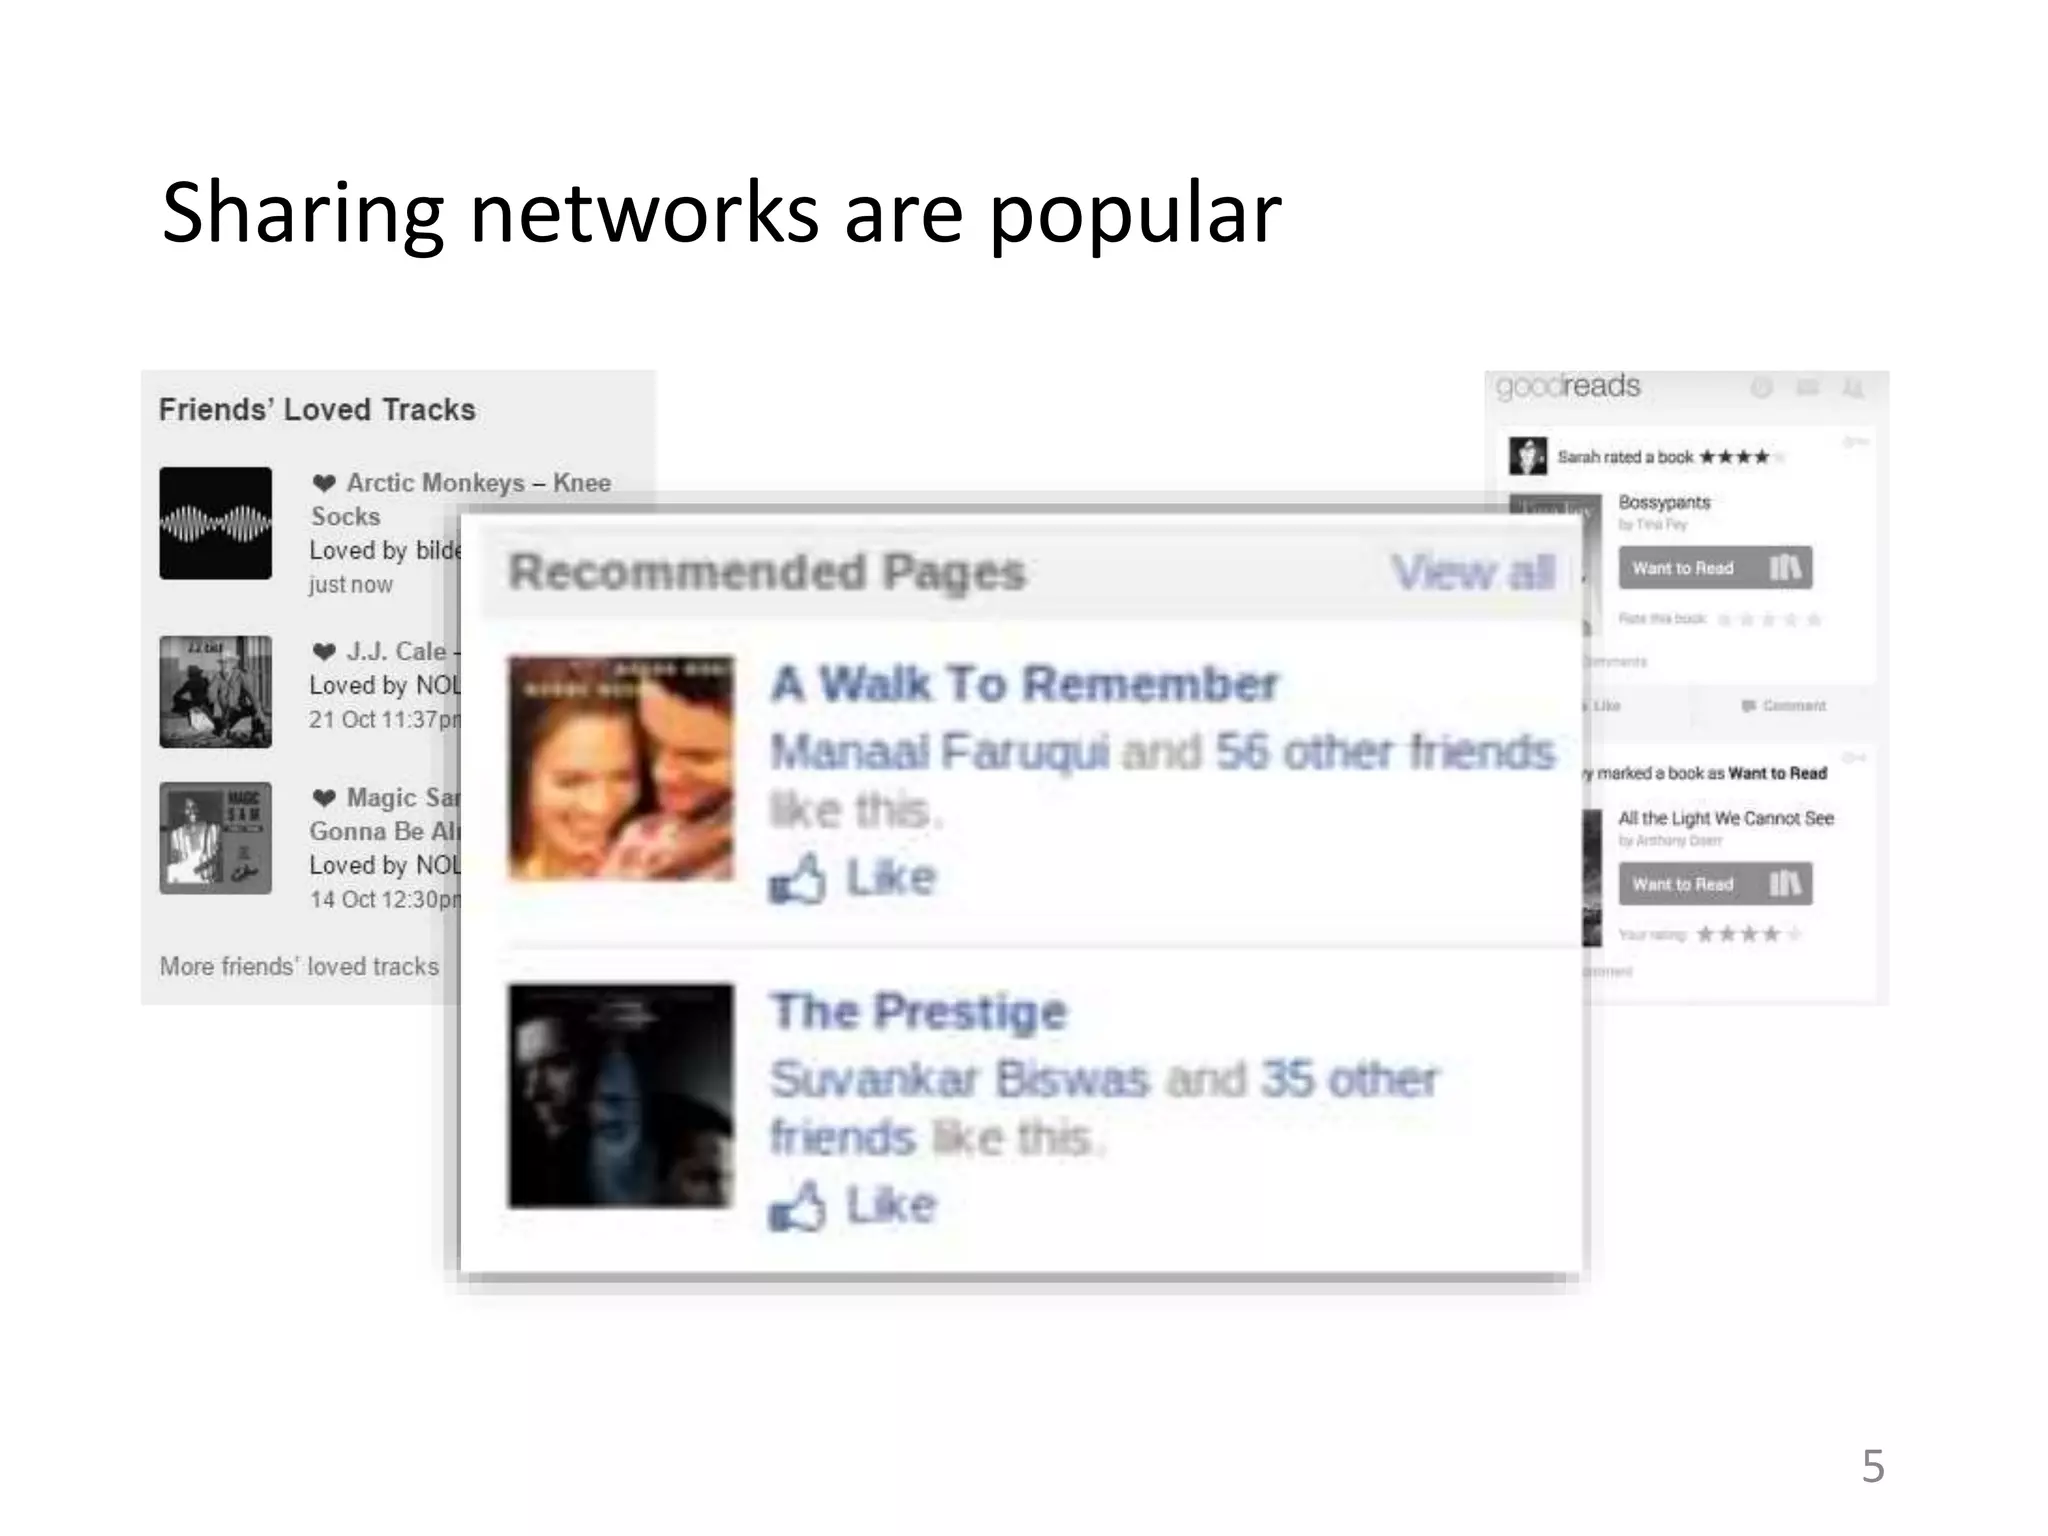
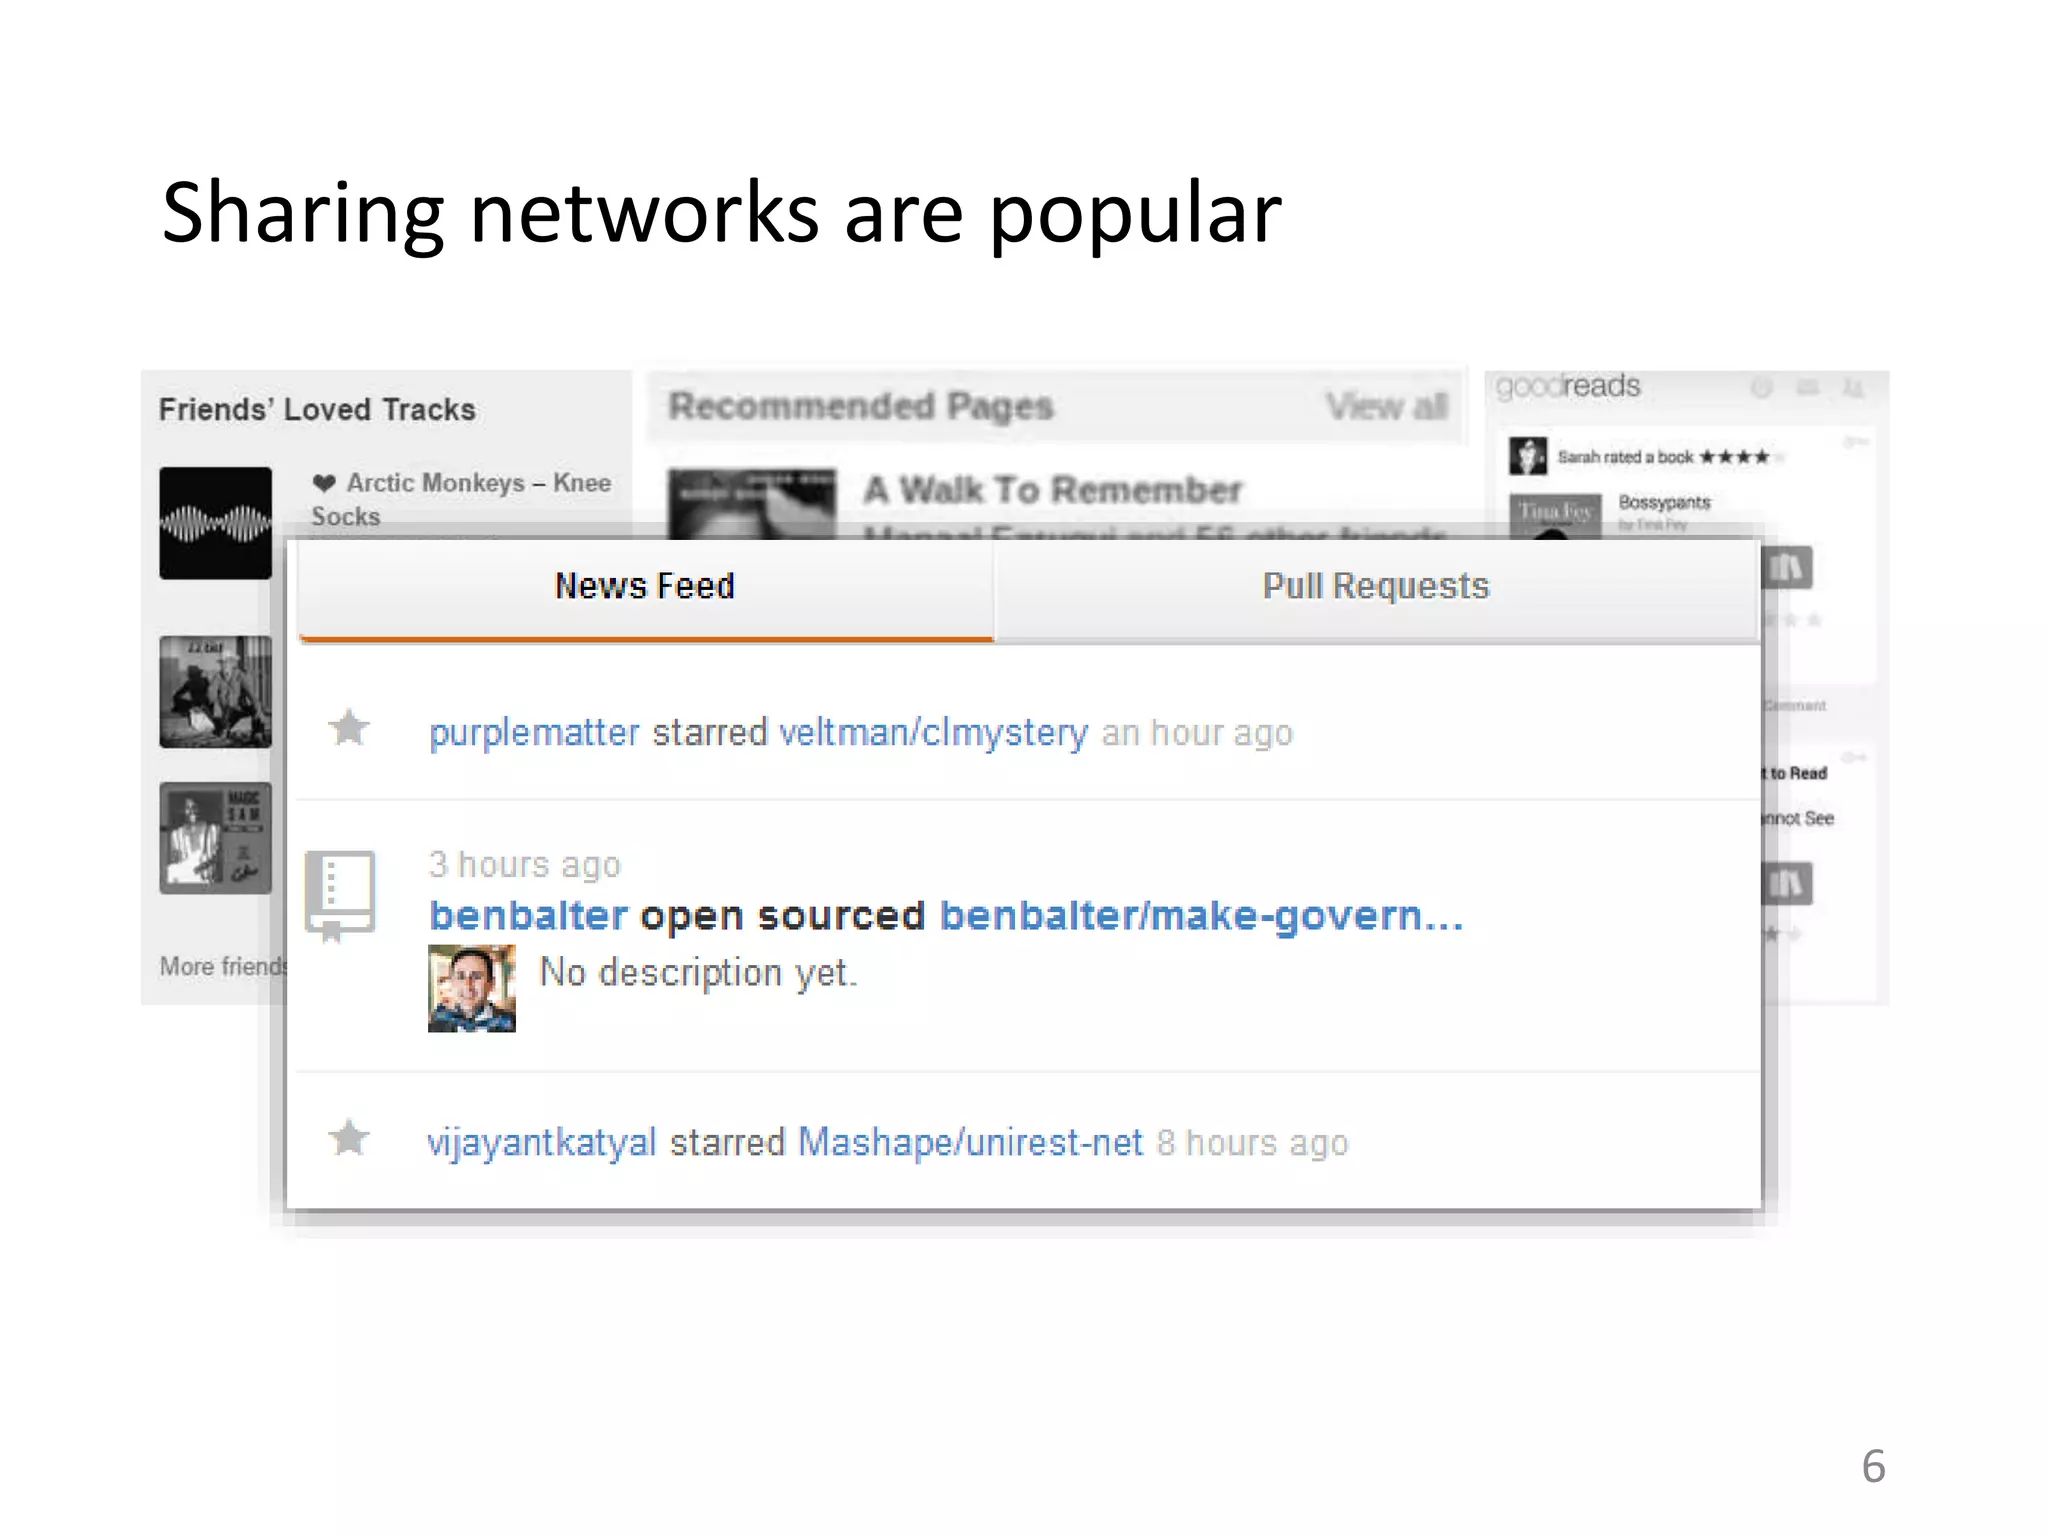
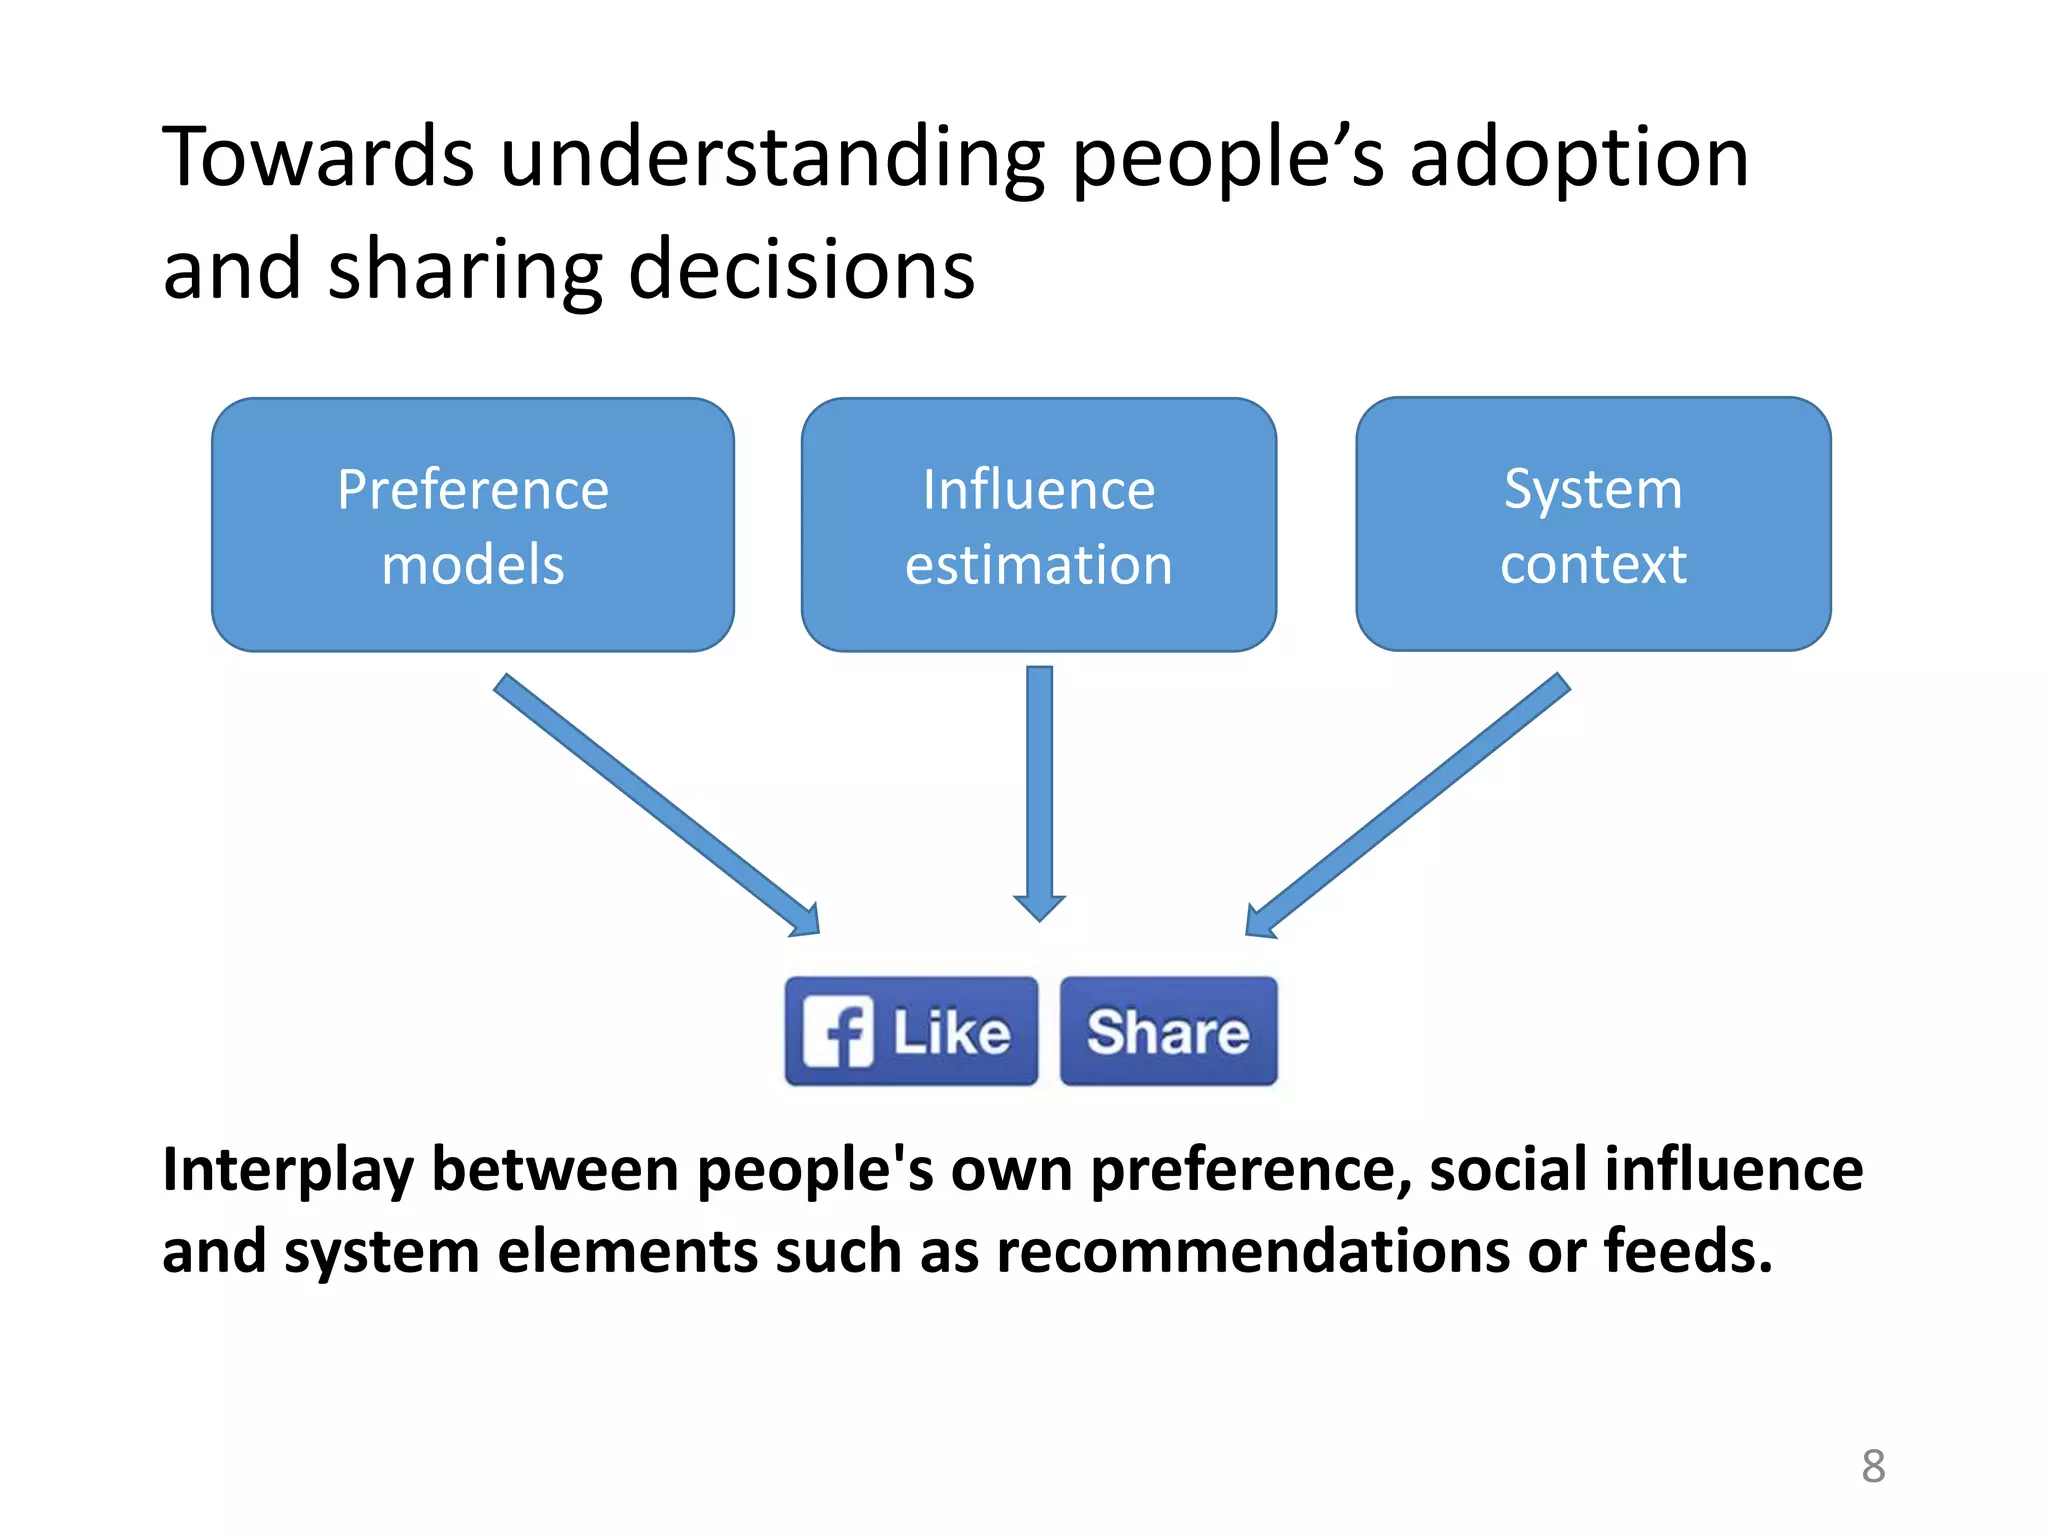
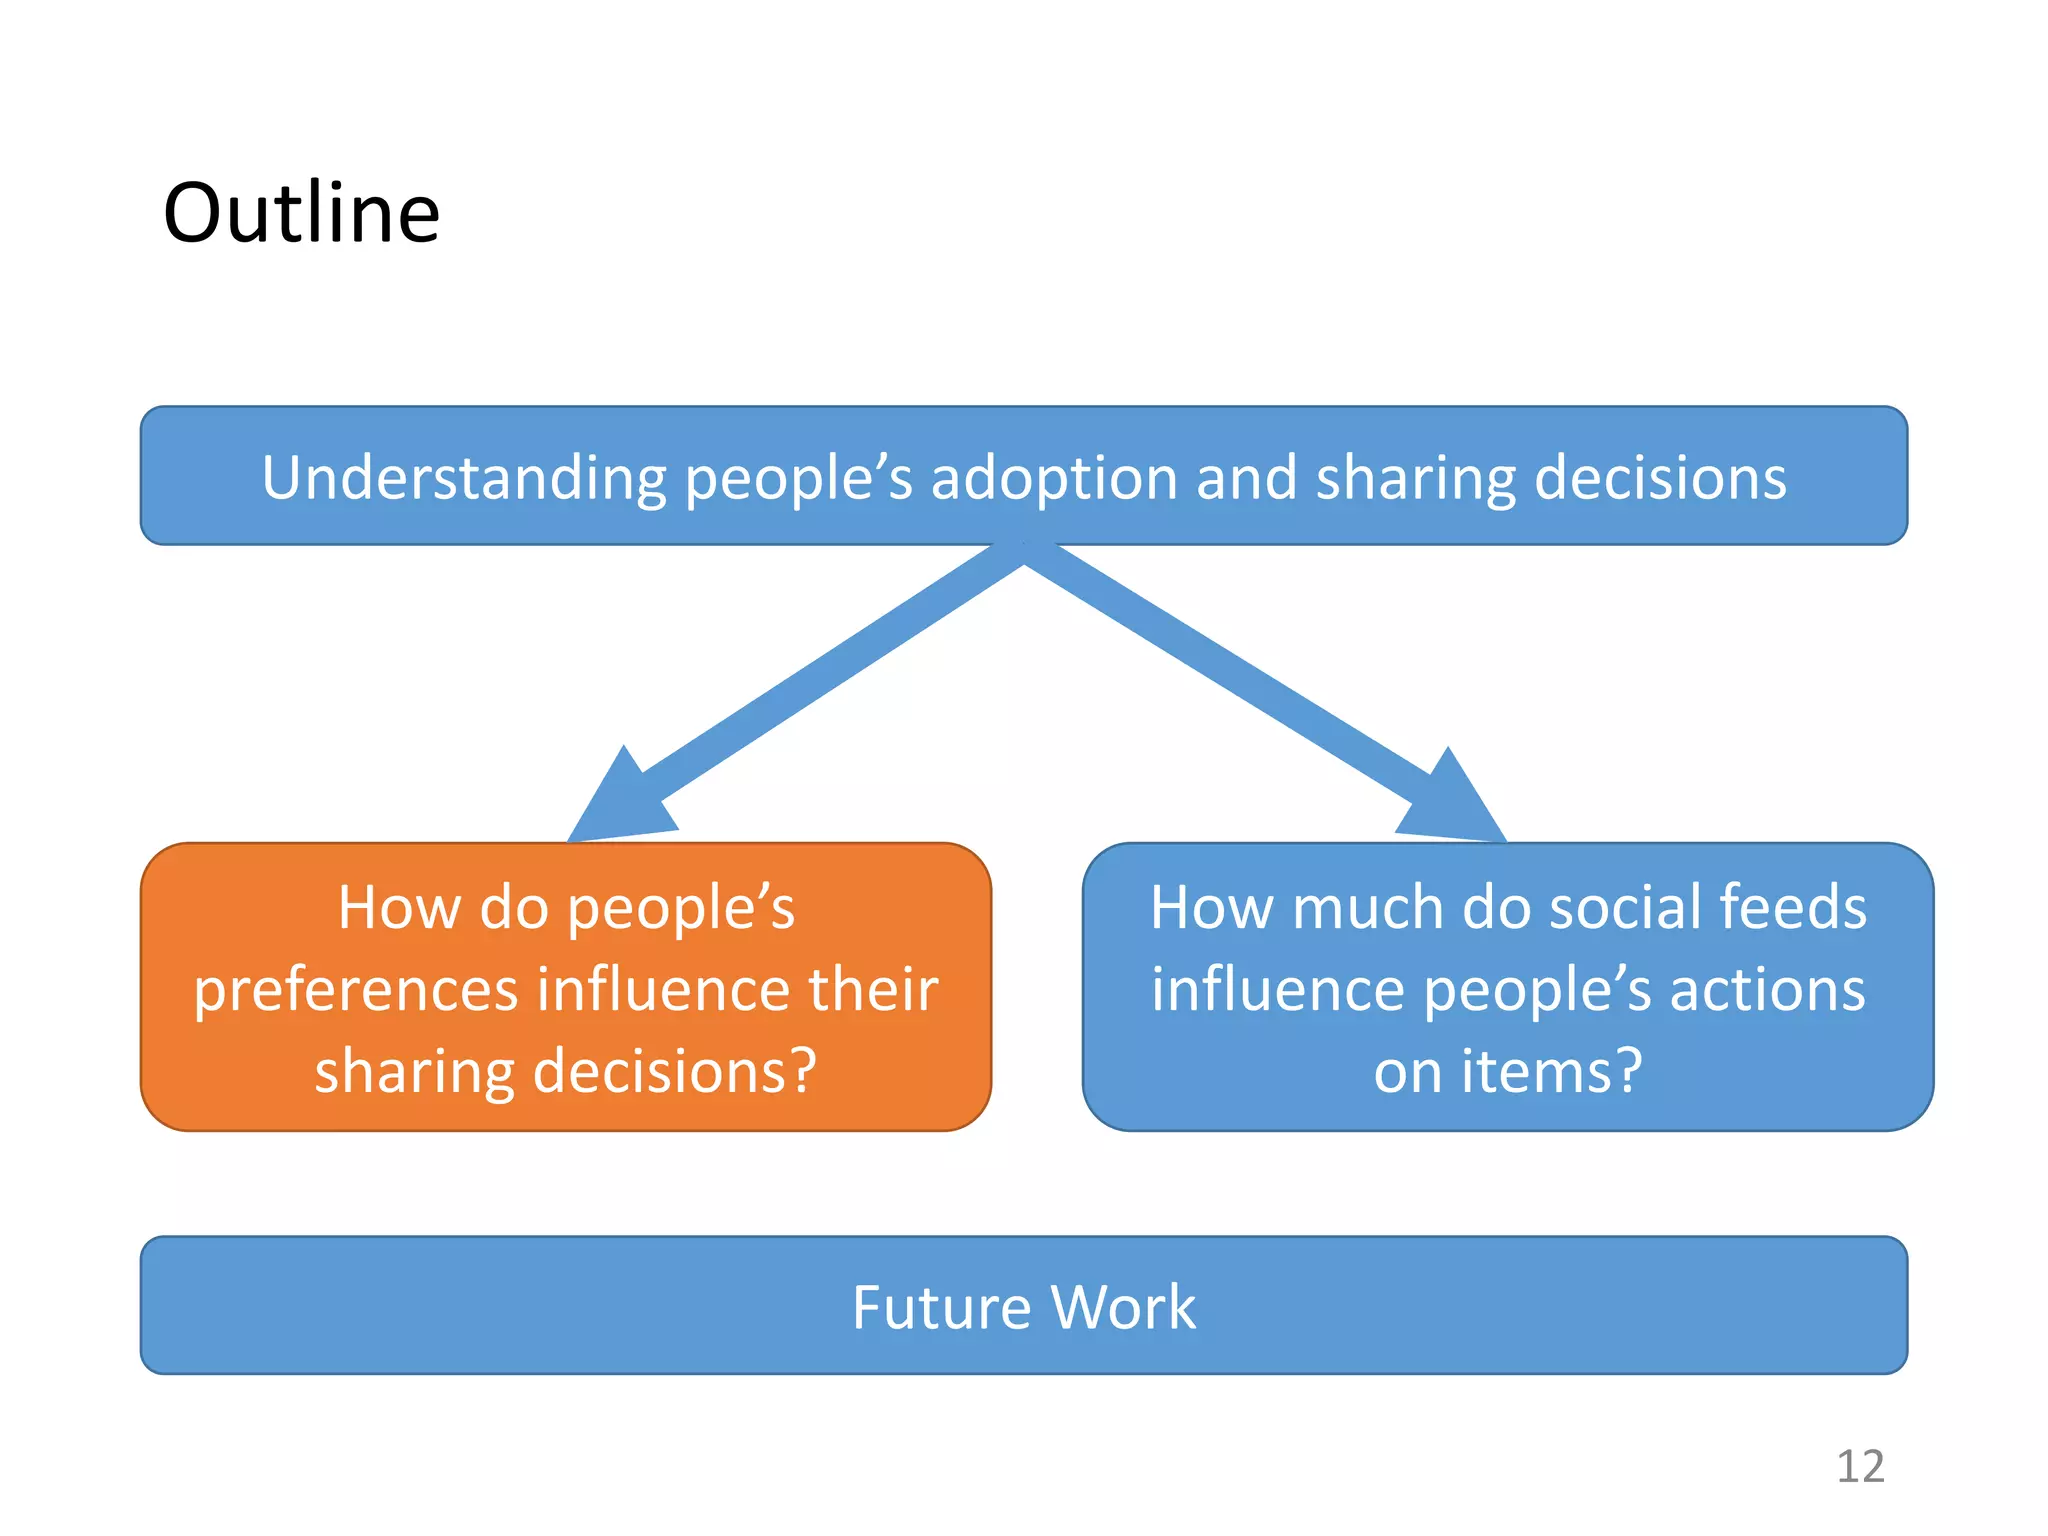
Download to read offline
![Two ways of looking at the world
7
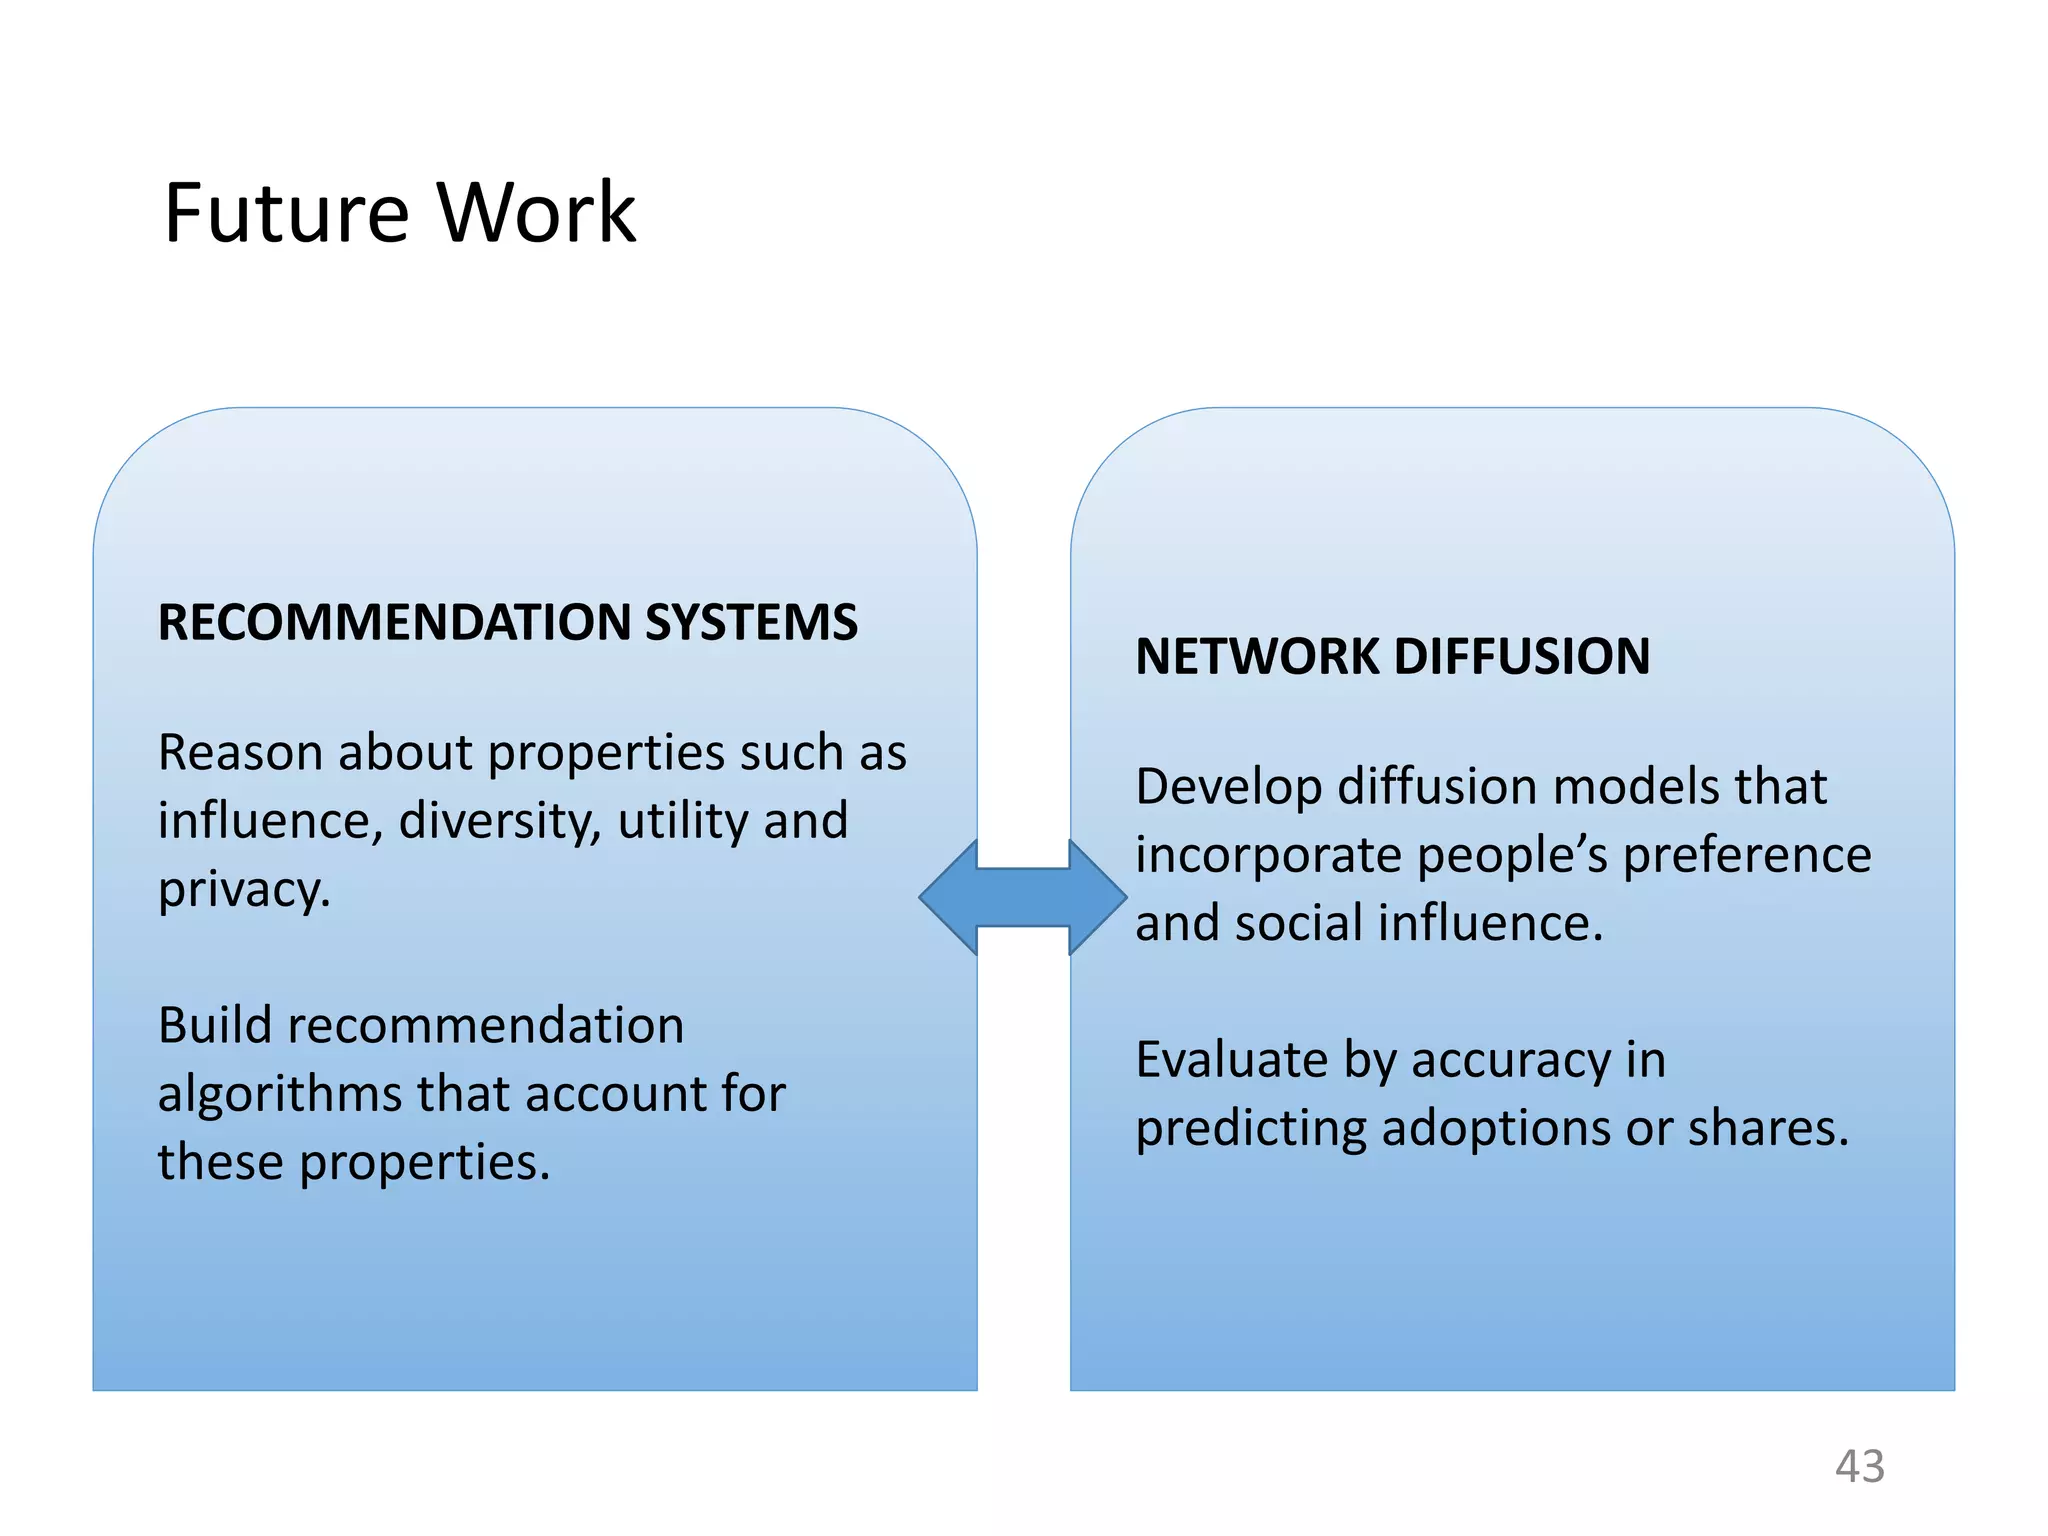
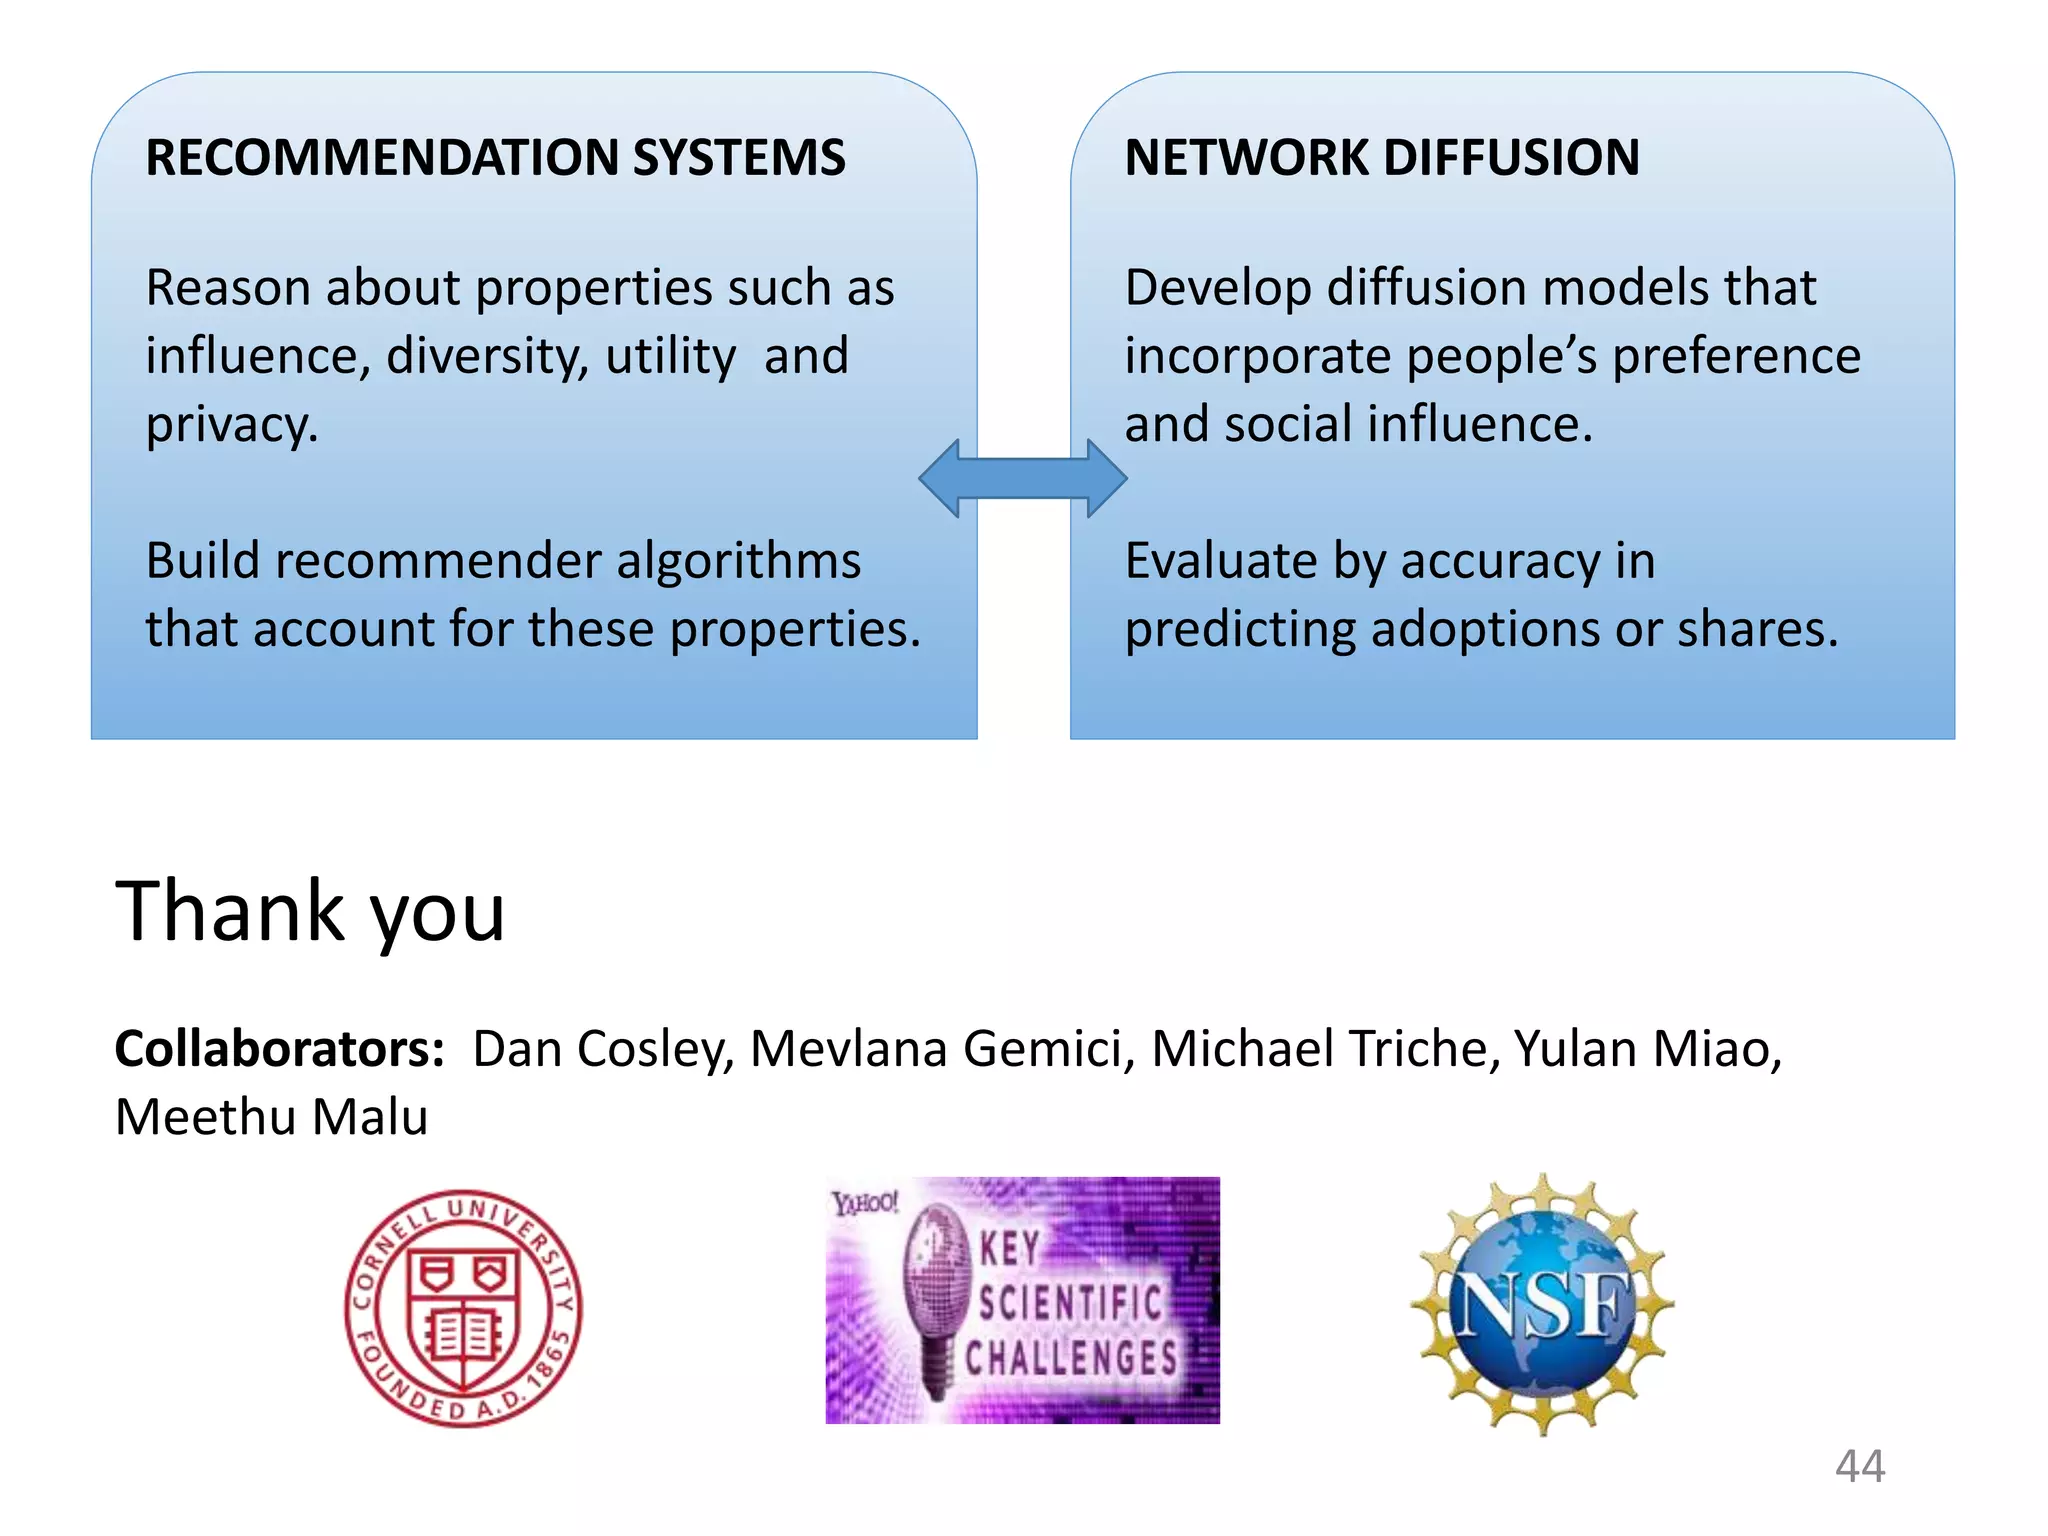
RECOMMENDATION SYSTEMS
Model individual preferences of
users
Does not consider explicitly the
effect of sharing or social processes
[Ma et al. ‘09, Konstas et al. ‘08,
Jamali and Ester ‘10, Sharma and
Cosley ‘11, Sharma and Yan ‘13]
NETWORK DIFFUSION
Model spread of items in a social
network, one at a time
Does not consider an individual’s
preferences over items
[Watts ‘02, Kempe et al. ‘03, Bakshy
et al. ‘09, Lerman and Ghosh ‘10 ]](https://image.slidesharecdn.com/b-examcornell-150610152114-lva1-app6891/75/The-interplay-of-personal-preference-and-social-influence-in-sharing-networks-Ph-D-defense-talk-7-2048.jpg)
![Example 1: How do friends-based
recommendations compare with those computed
from the full network?
9
[Sharma-Gemici-Cosley 2013]
MOVIES
MUSIC
HASHTAGS
# Friends ~ 100-500
# Non-friends ~ 50k](https://image.slidesharecdn.com/b-examcornell-150610152114-lva1-app6891/75/The-interplay-of-personal-preference-and-social-influence-in-sharing-networks-Ph-D-defense-talk-9-2048.jpg)
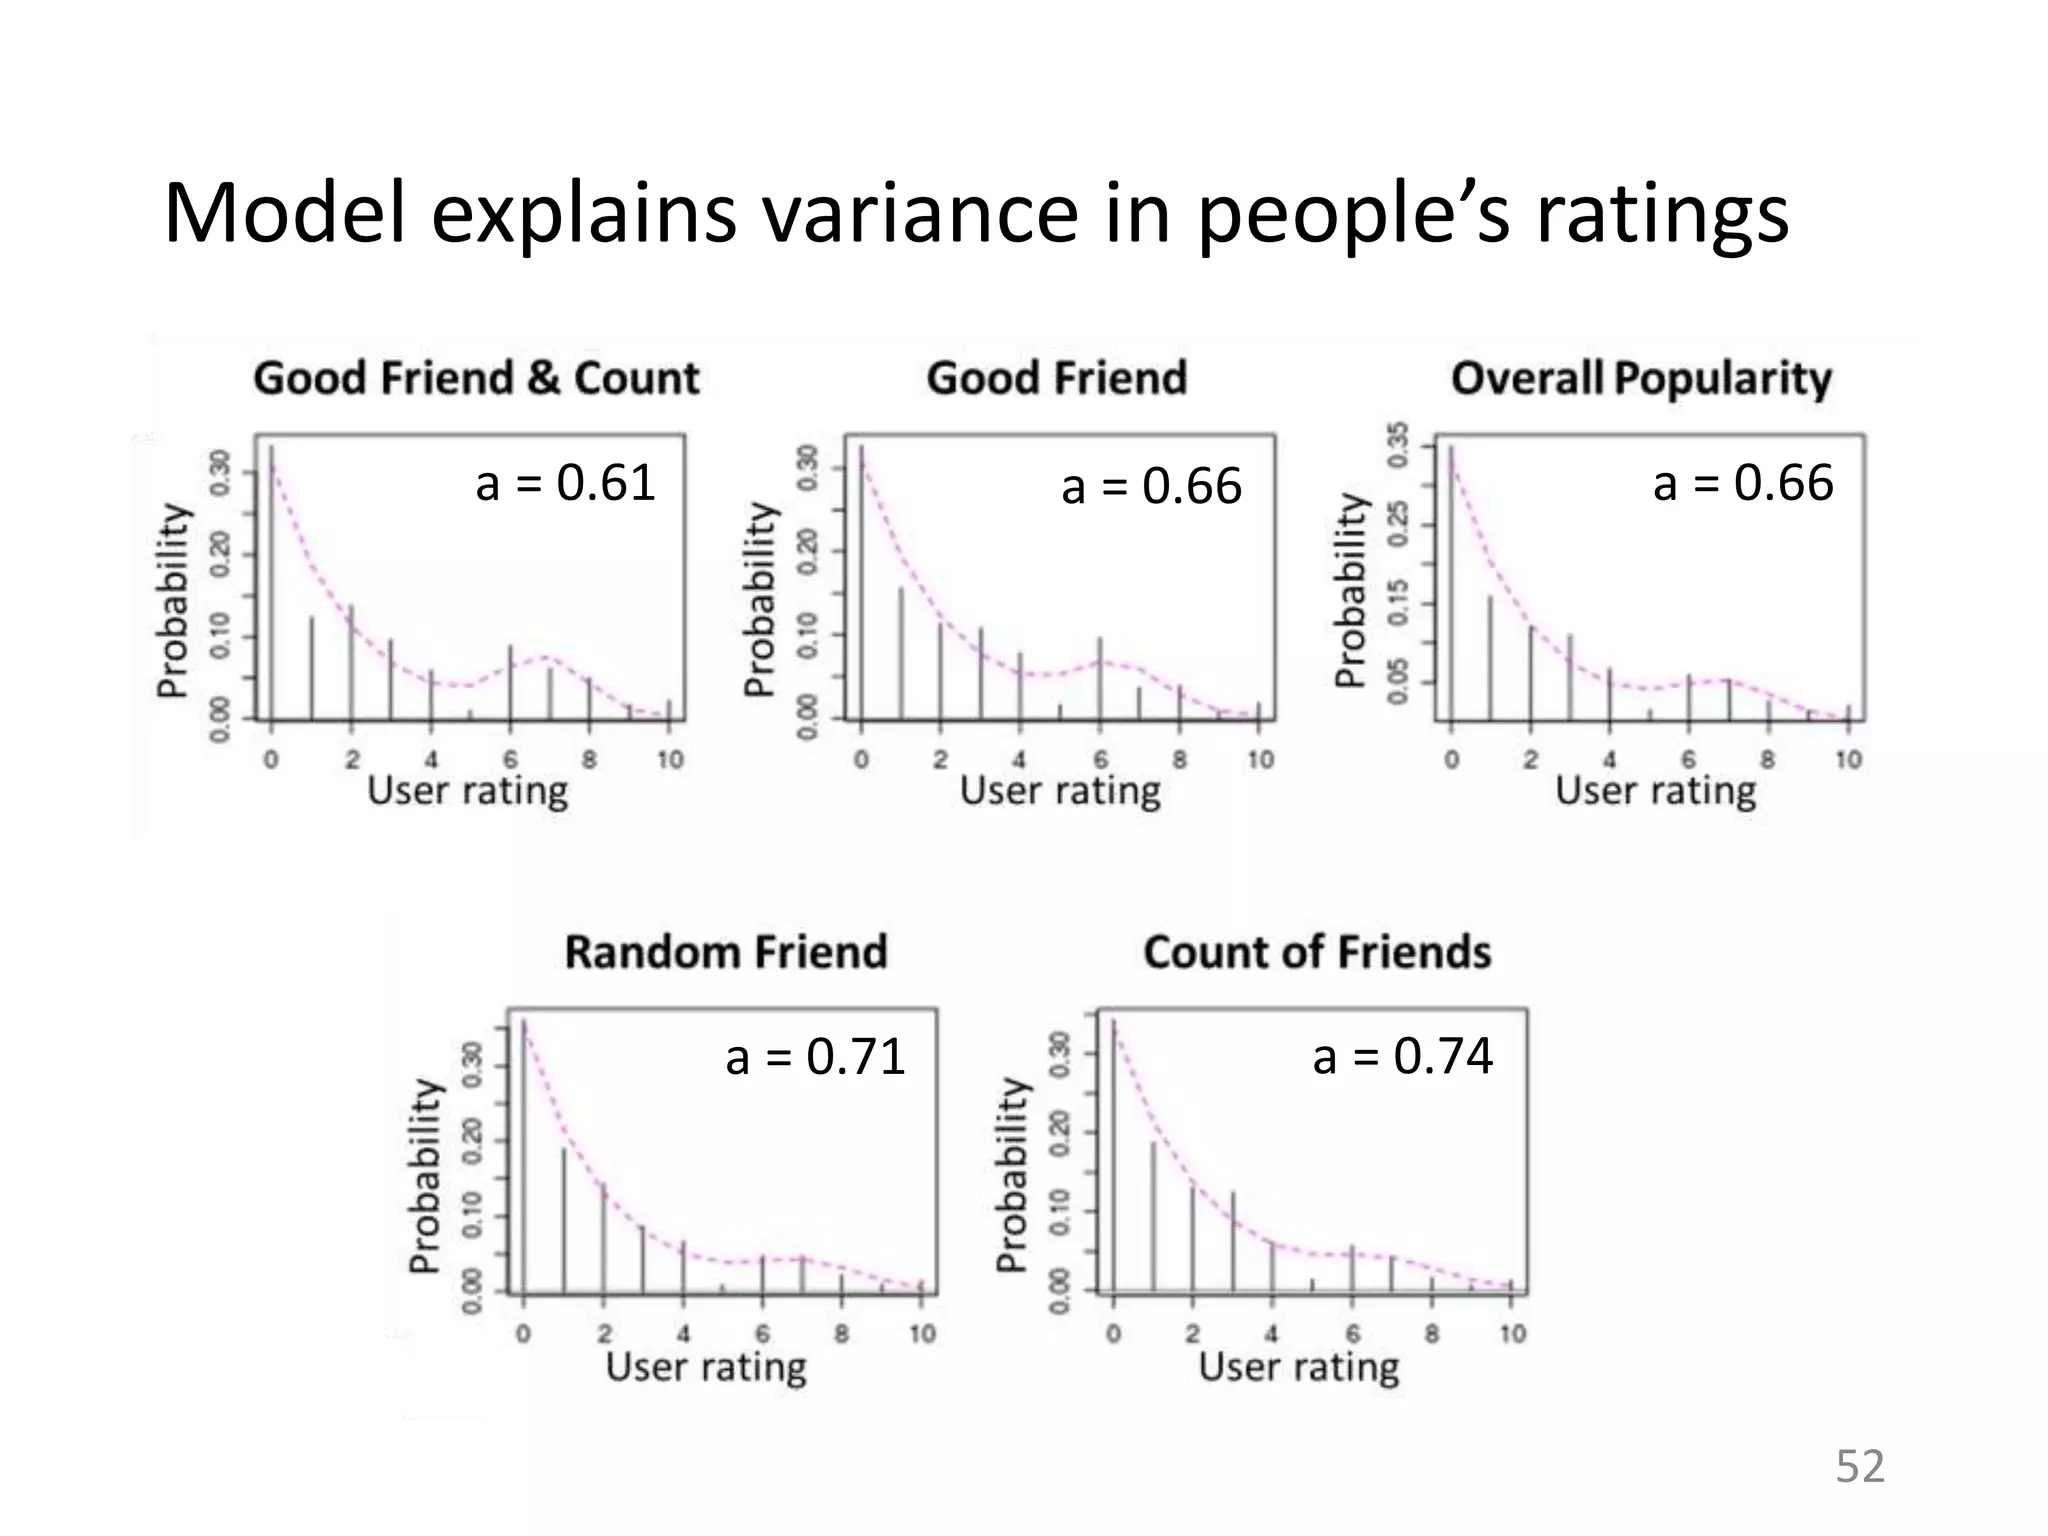
![Example 2: Which social explanation would
influence you to try out a musical artist?
10
10 of your friends like this Dan and Levent like this
a = 0.61 a = 0.74a = 0.66
10 of your friends like this. Dan likes this.
[Sharma-Cosley 2013]
MUSIC
a = Rigidness](https://image.slidesharecdn.com/b-examcornell-150610152114-lva1-app6891/75/The-interplay-of-personal-preference-and-social-influence-in-sharing-networks-Ph-D-defense-talk-10-2048.jpg)
![My contributions
EXPERIMENTAL
• The effect of personal
preference and influence
on people’s decisions
– Item adoption [WWW ‘13]
– Item sharing [CSCW ‘15]
11
OBSERVATIONAL
• Aggregate effect of
people’s activities over the
sharing network
– Extent of preference
locality [ICWSM ‘13]
– Influence estimation [In
submission to CSCW ‘16]](https://image.slidesharecdn.com/b-examcornell-150610152114-lva1-app6891/75/The-interplay-of-personal-preference-and-social-influence-in-sharing-networks-Ph-D-defense-talk-11-2048.jpg)
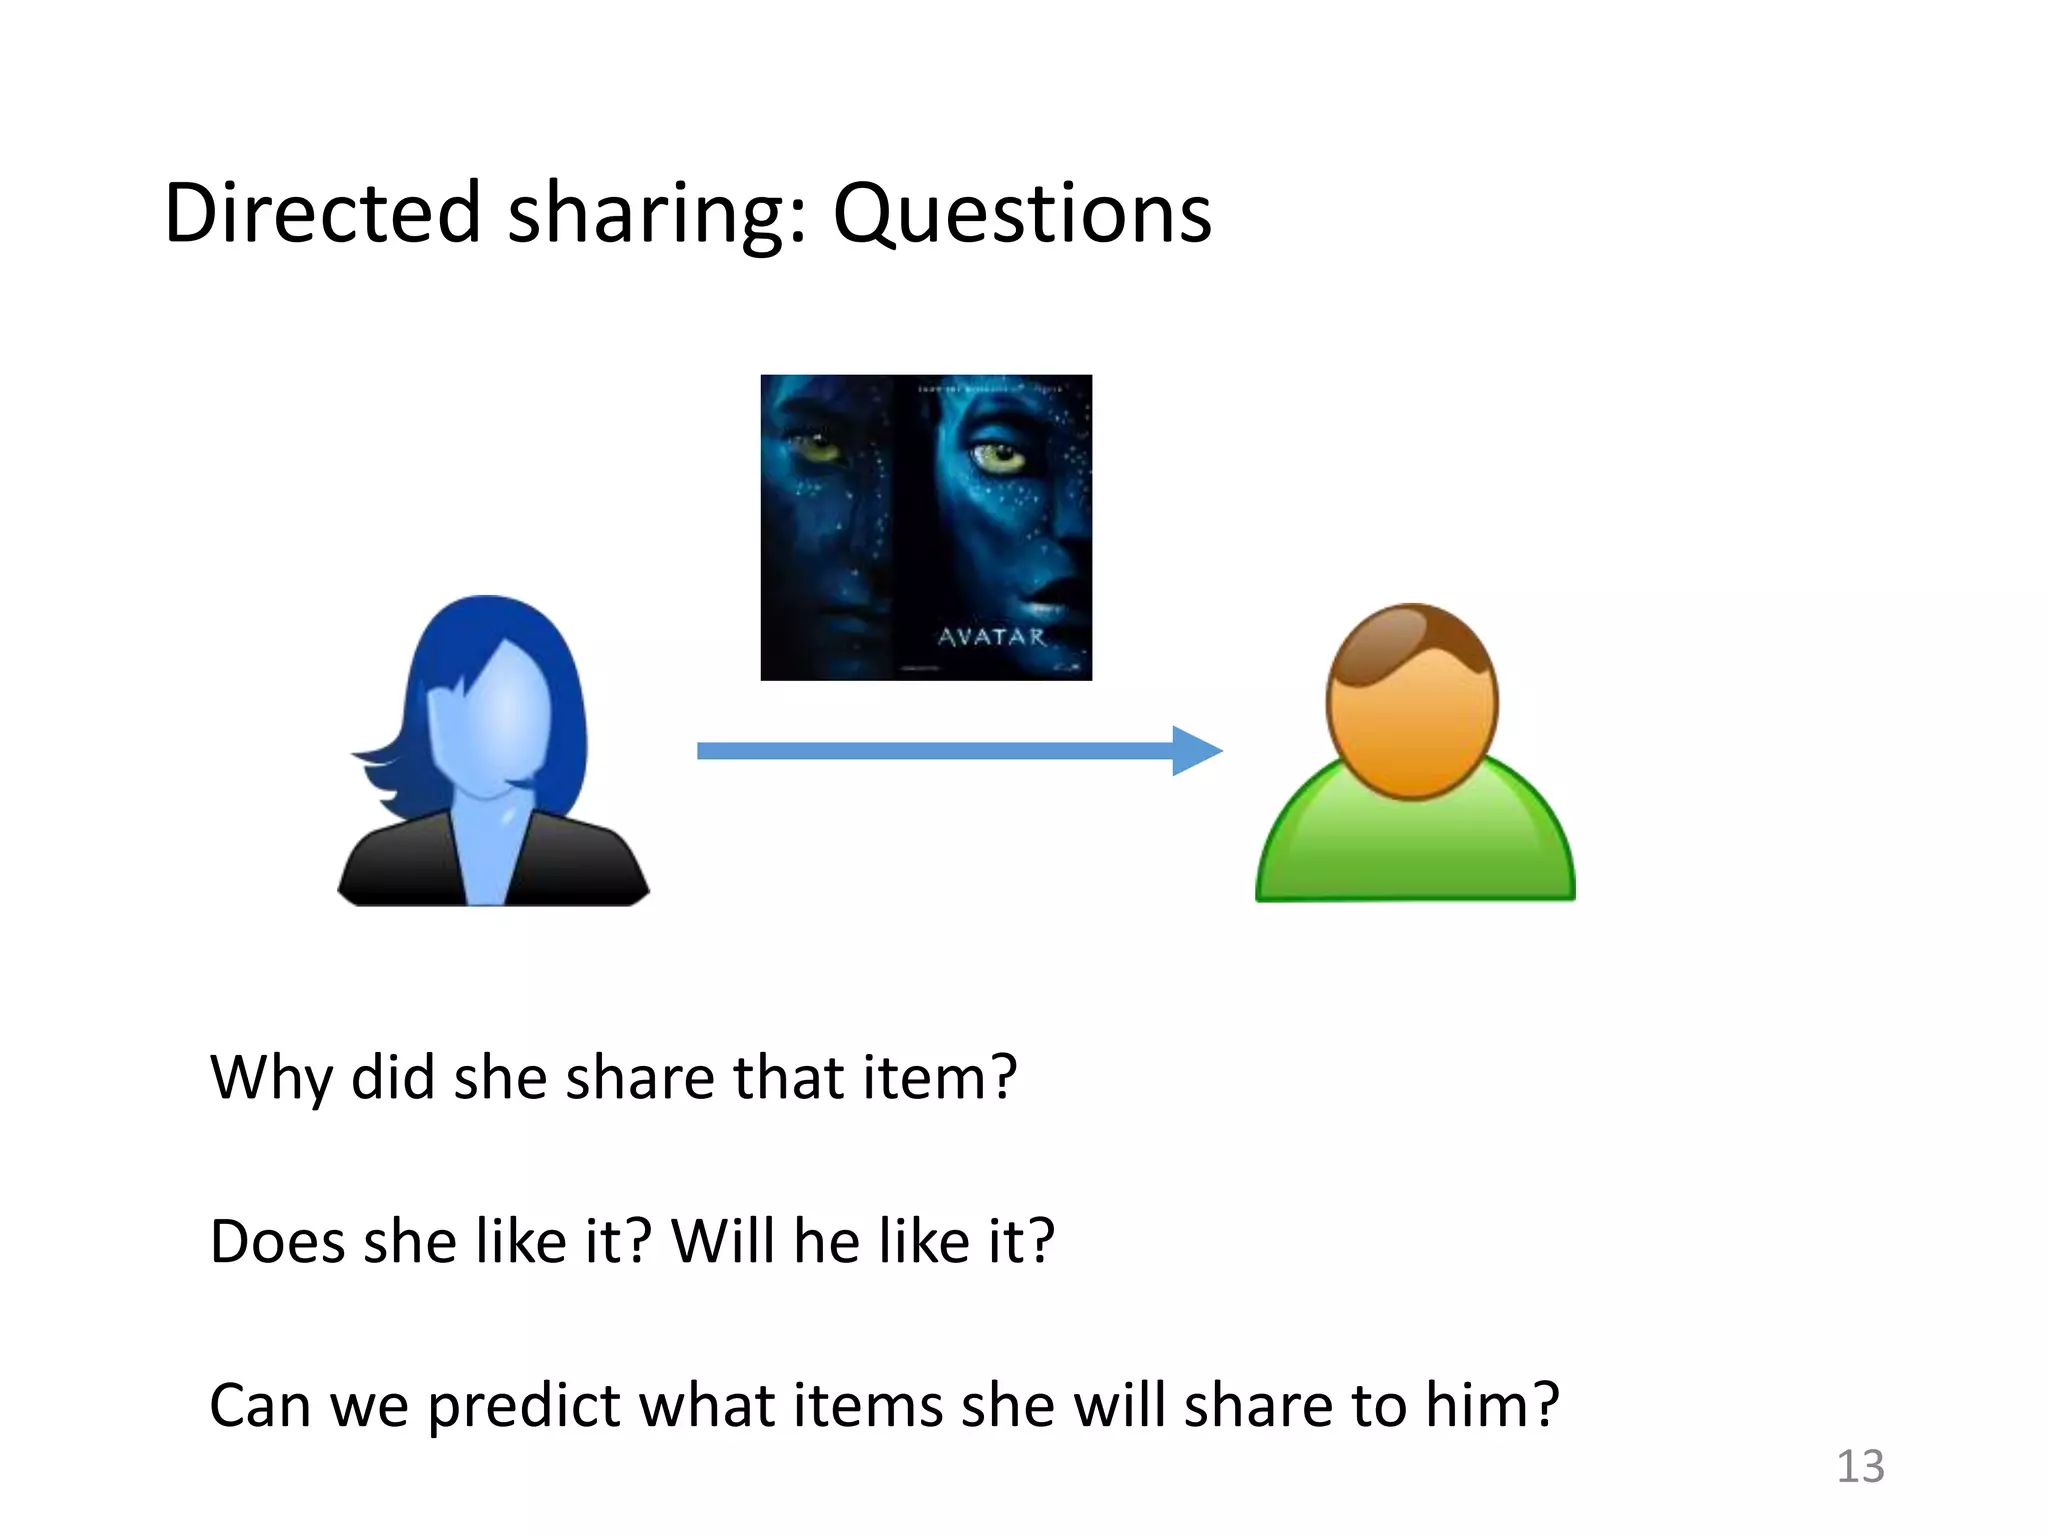
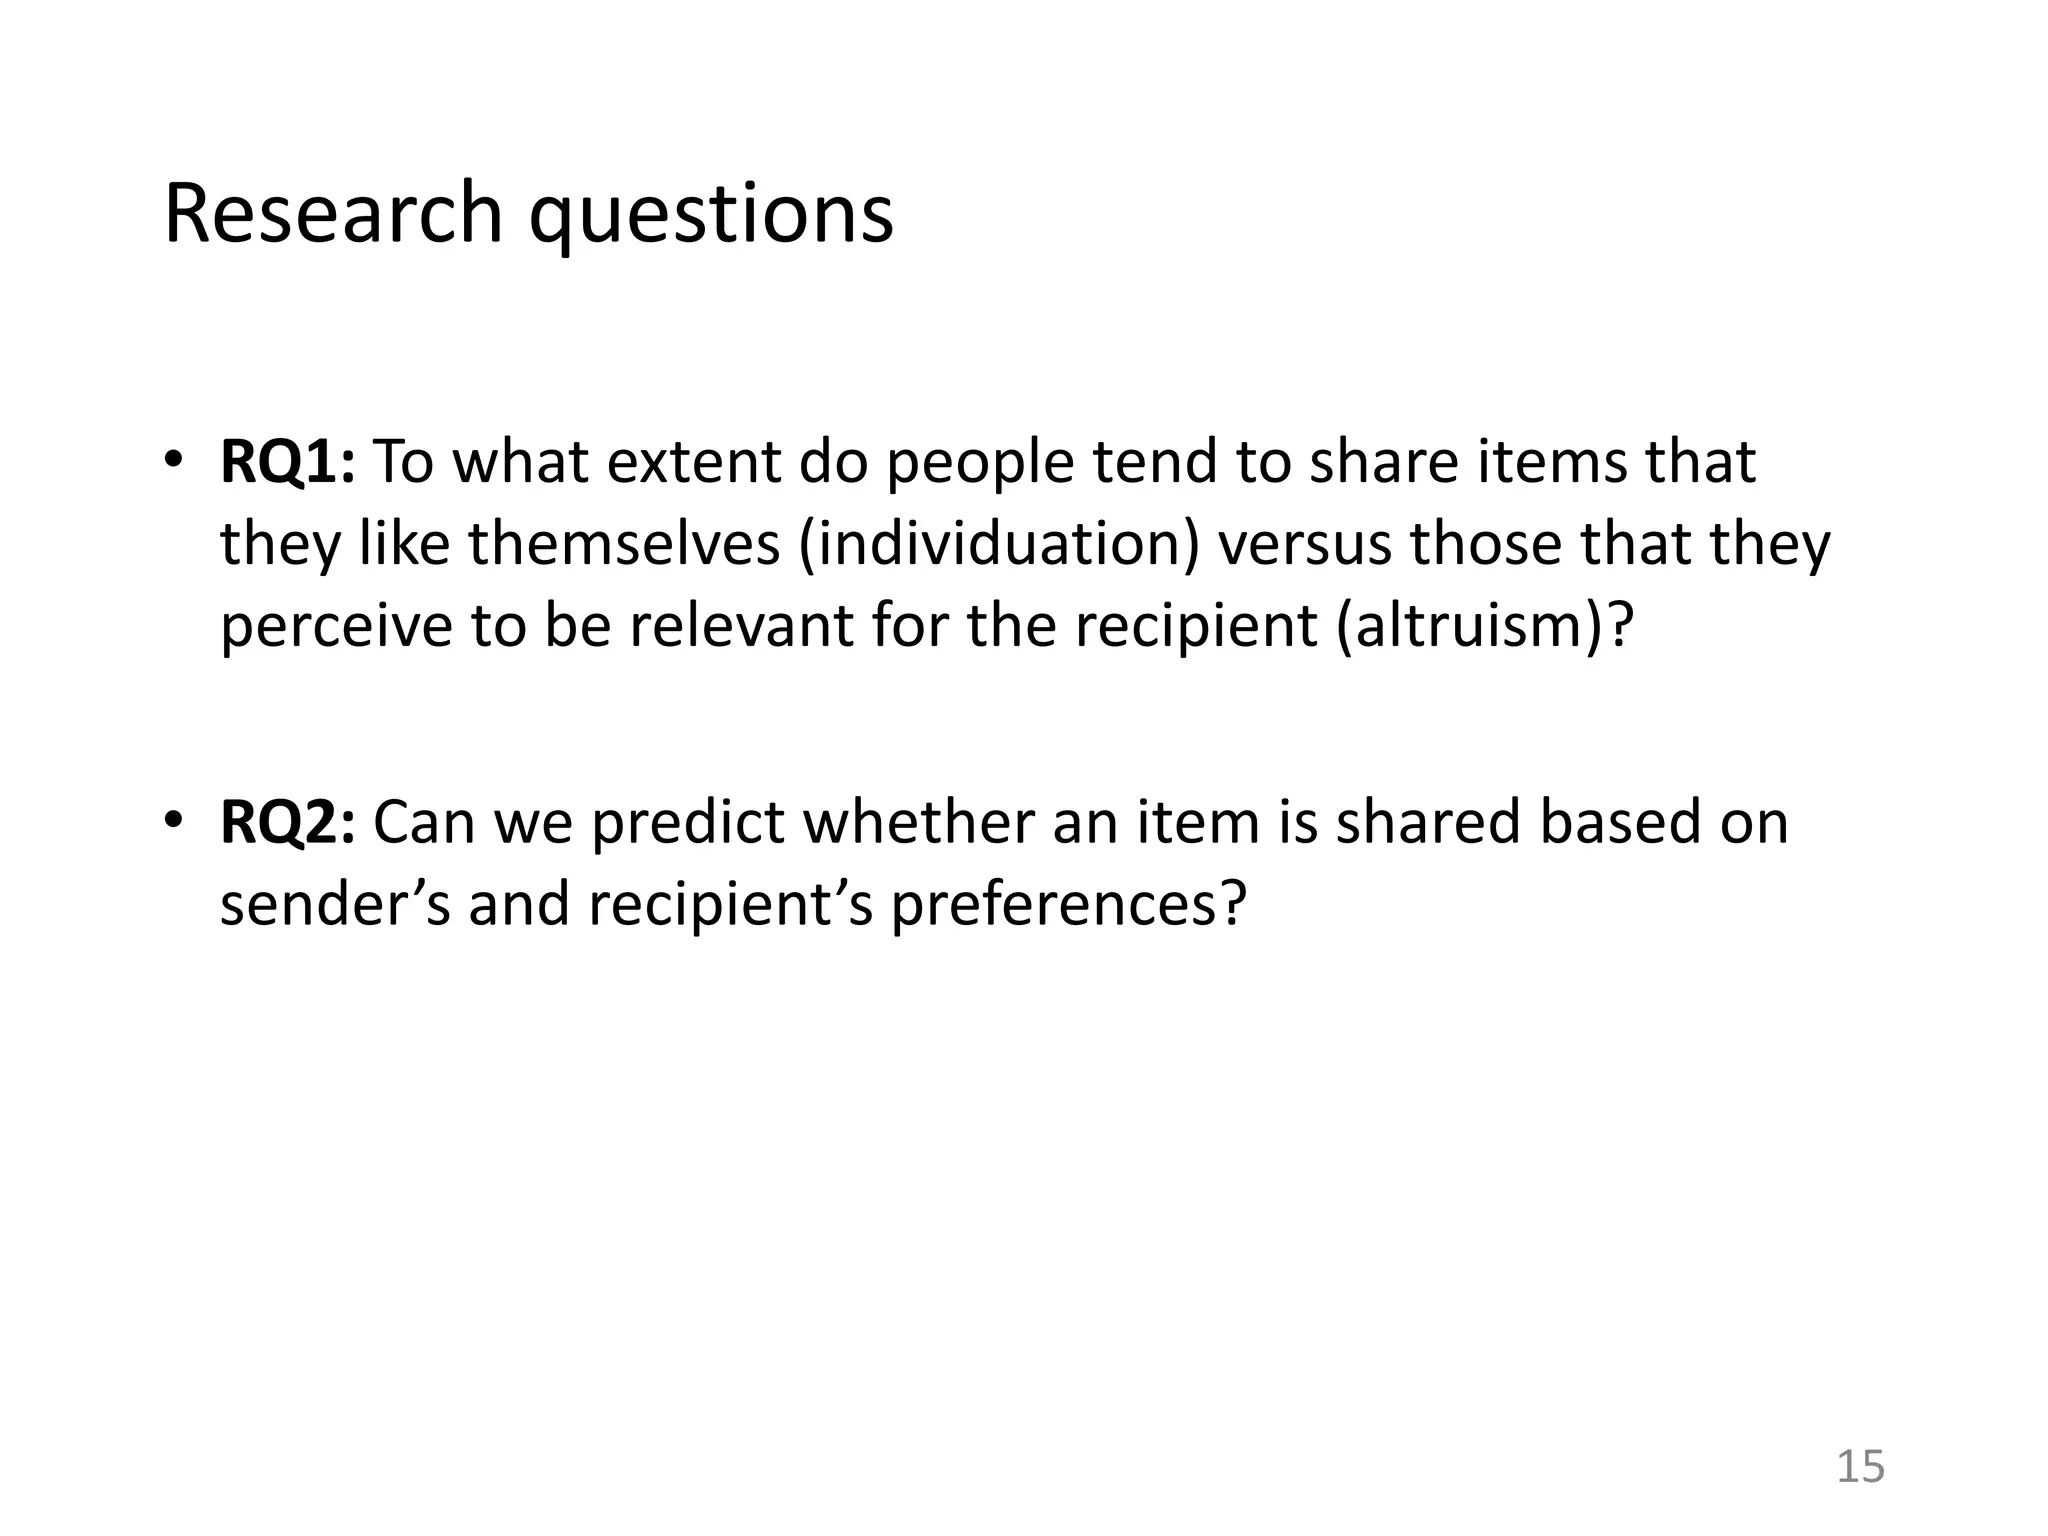
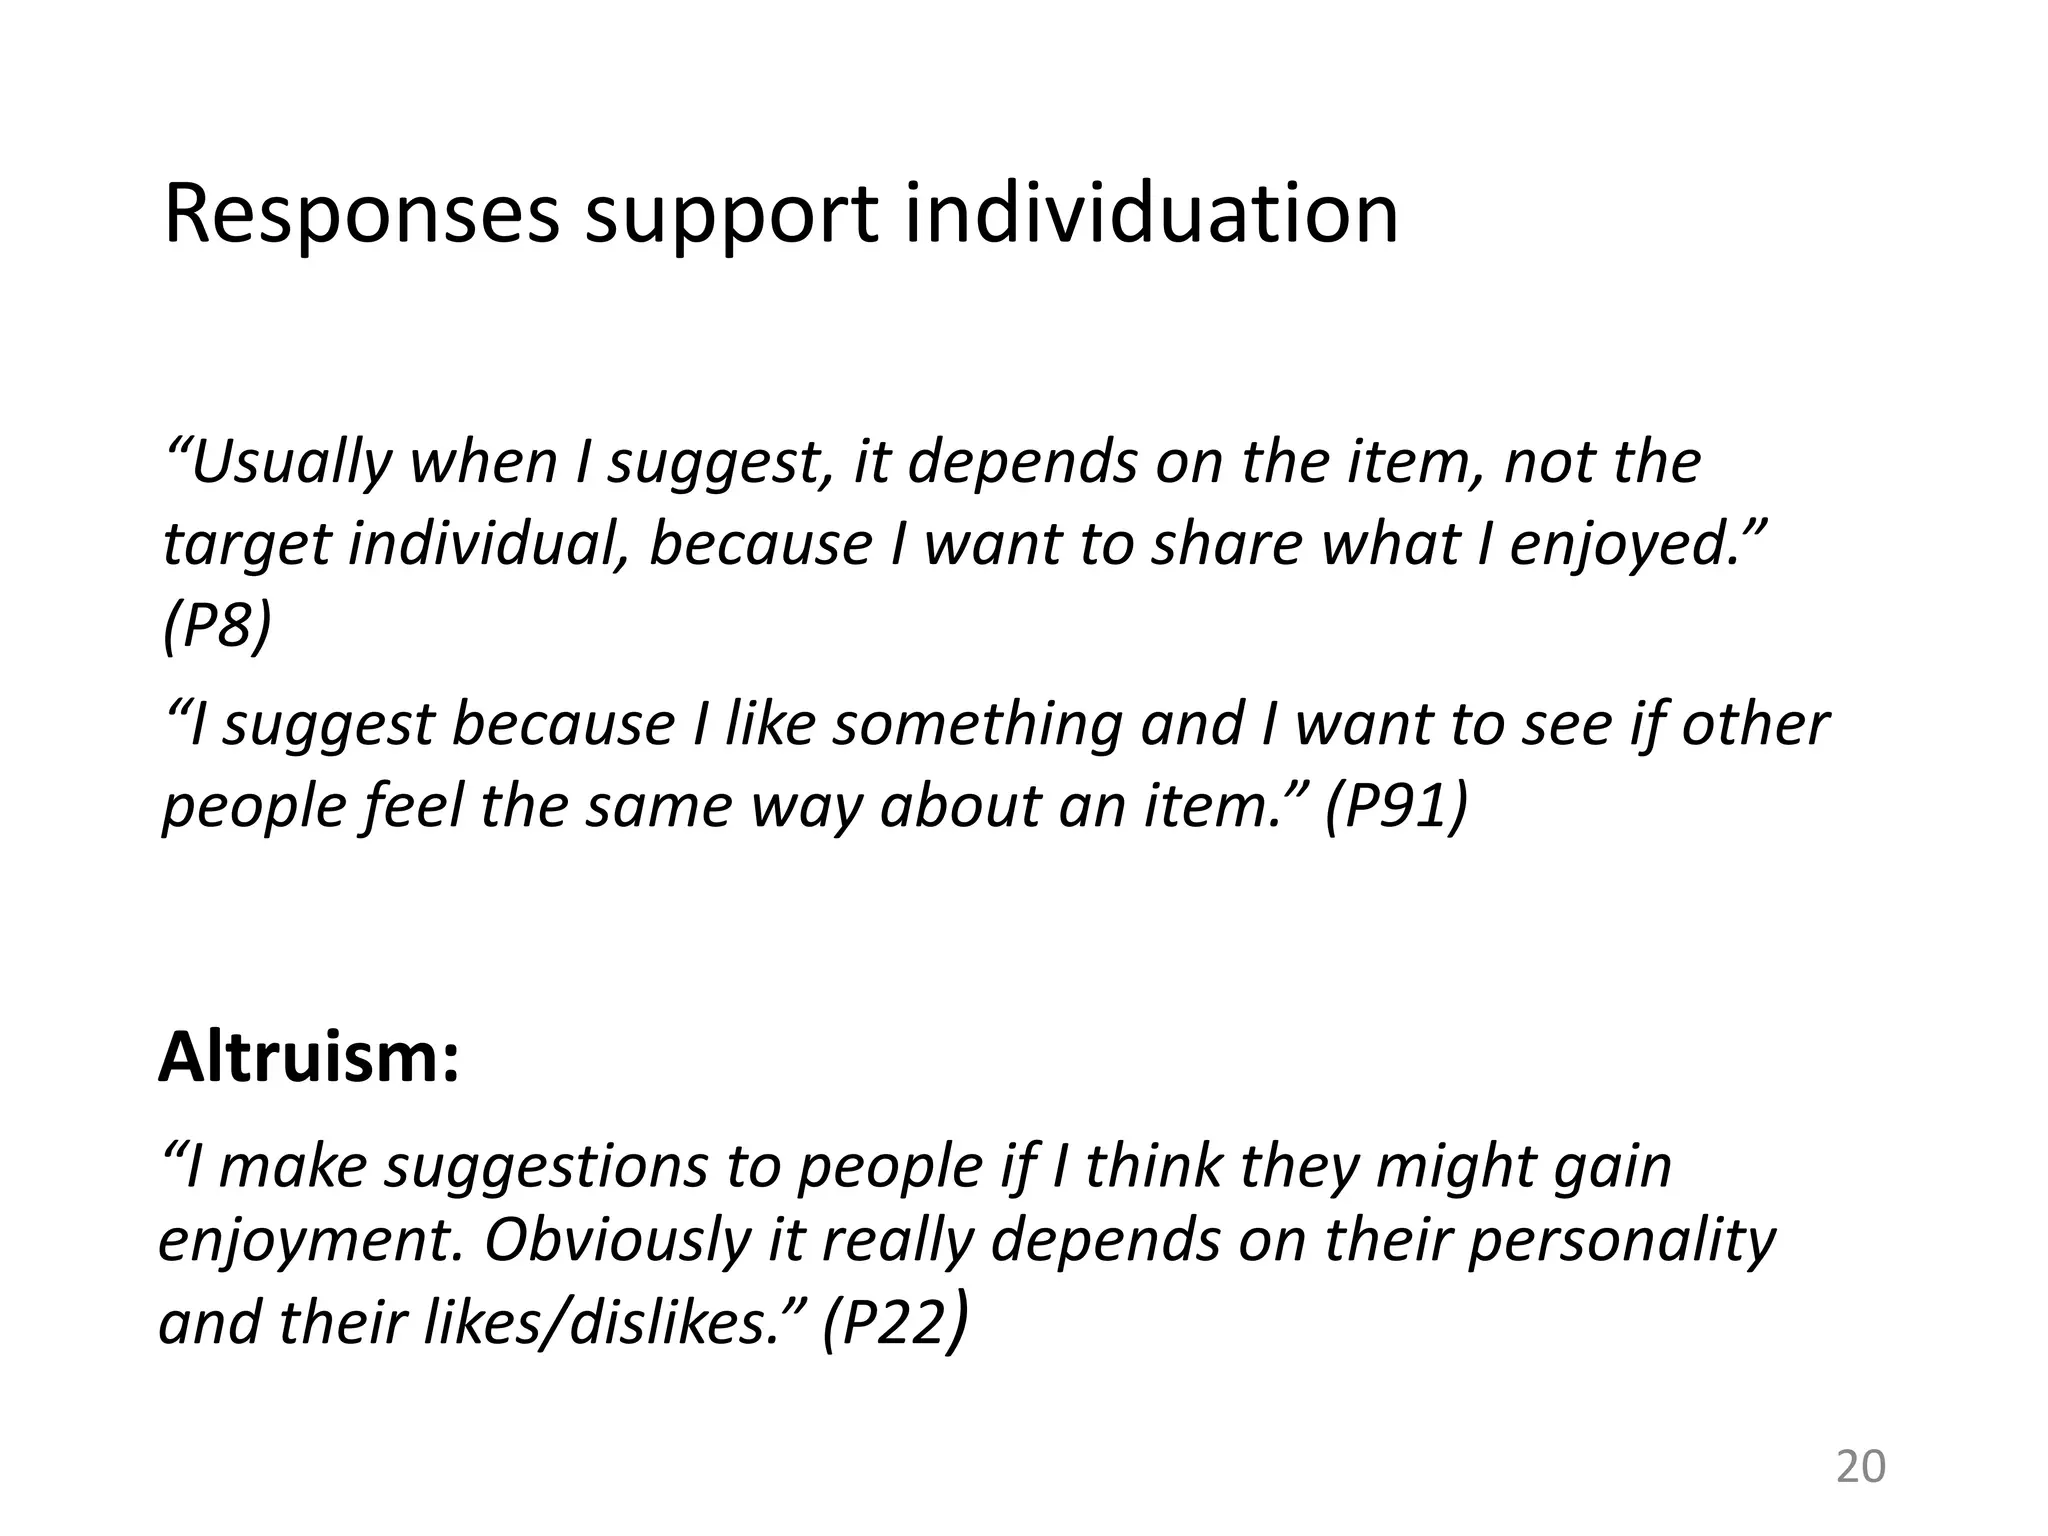
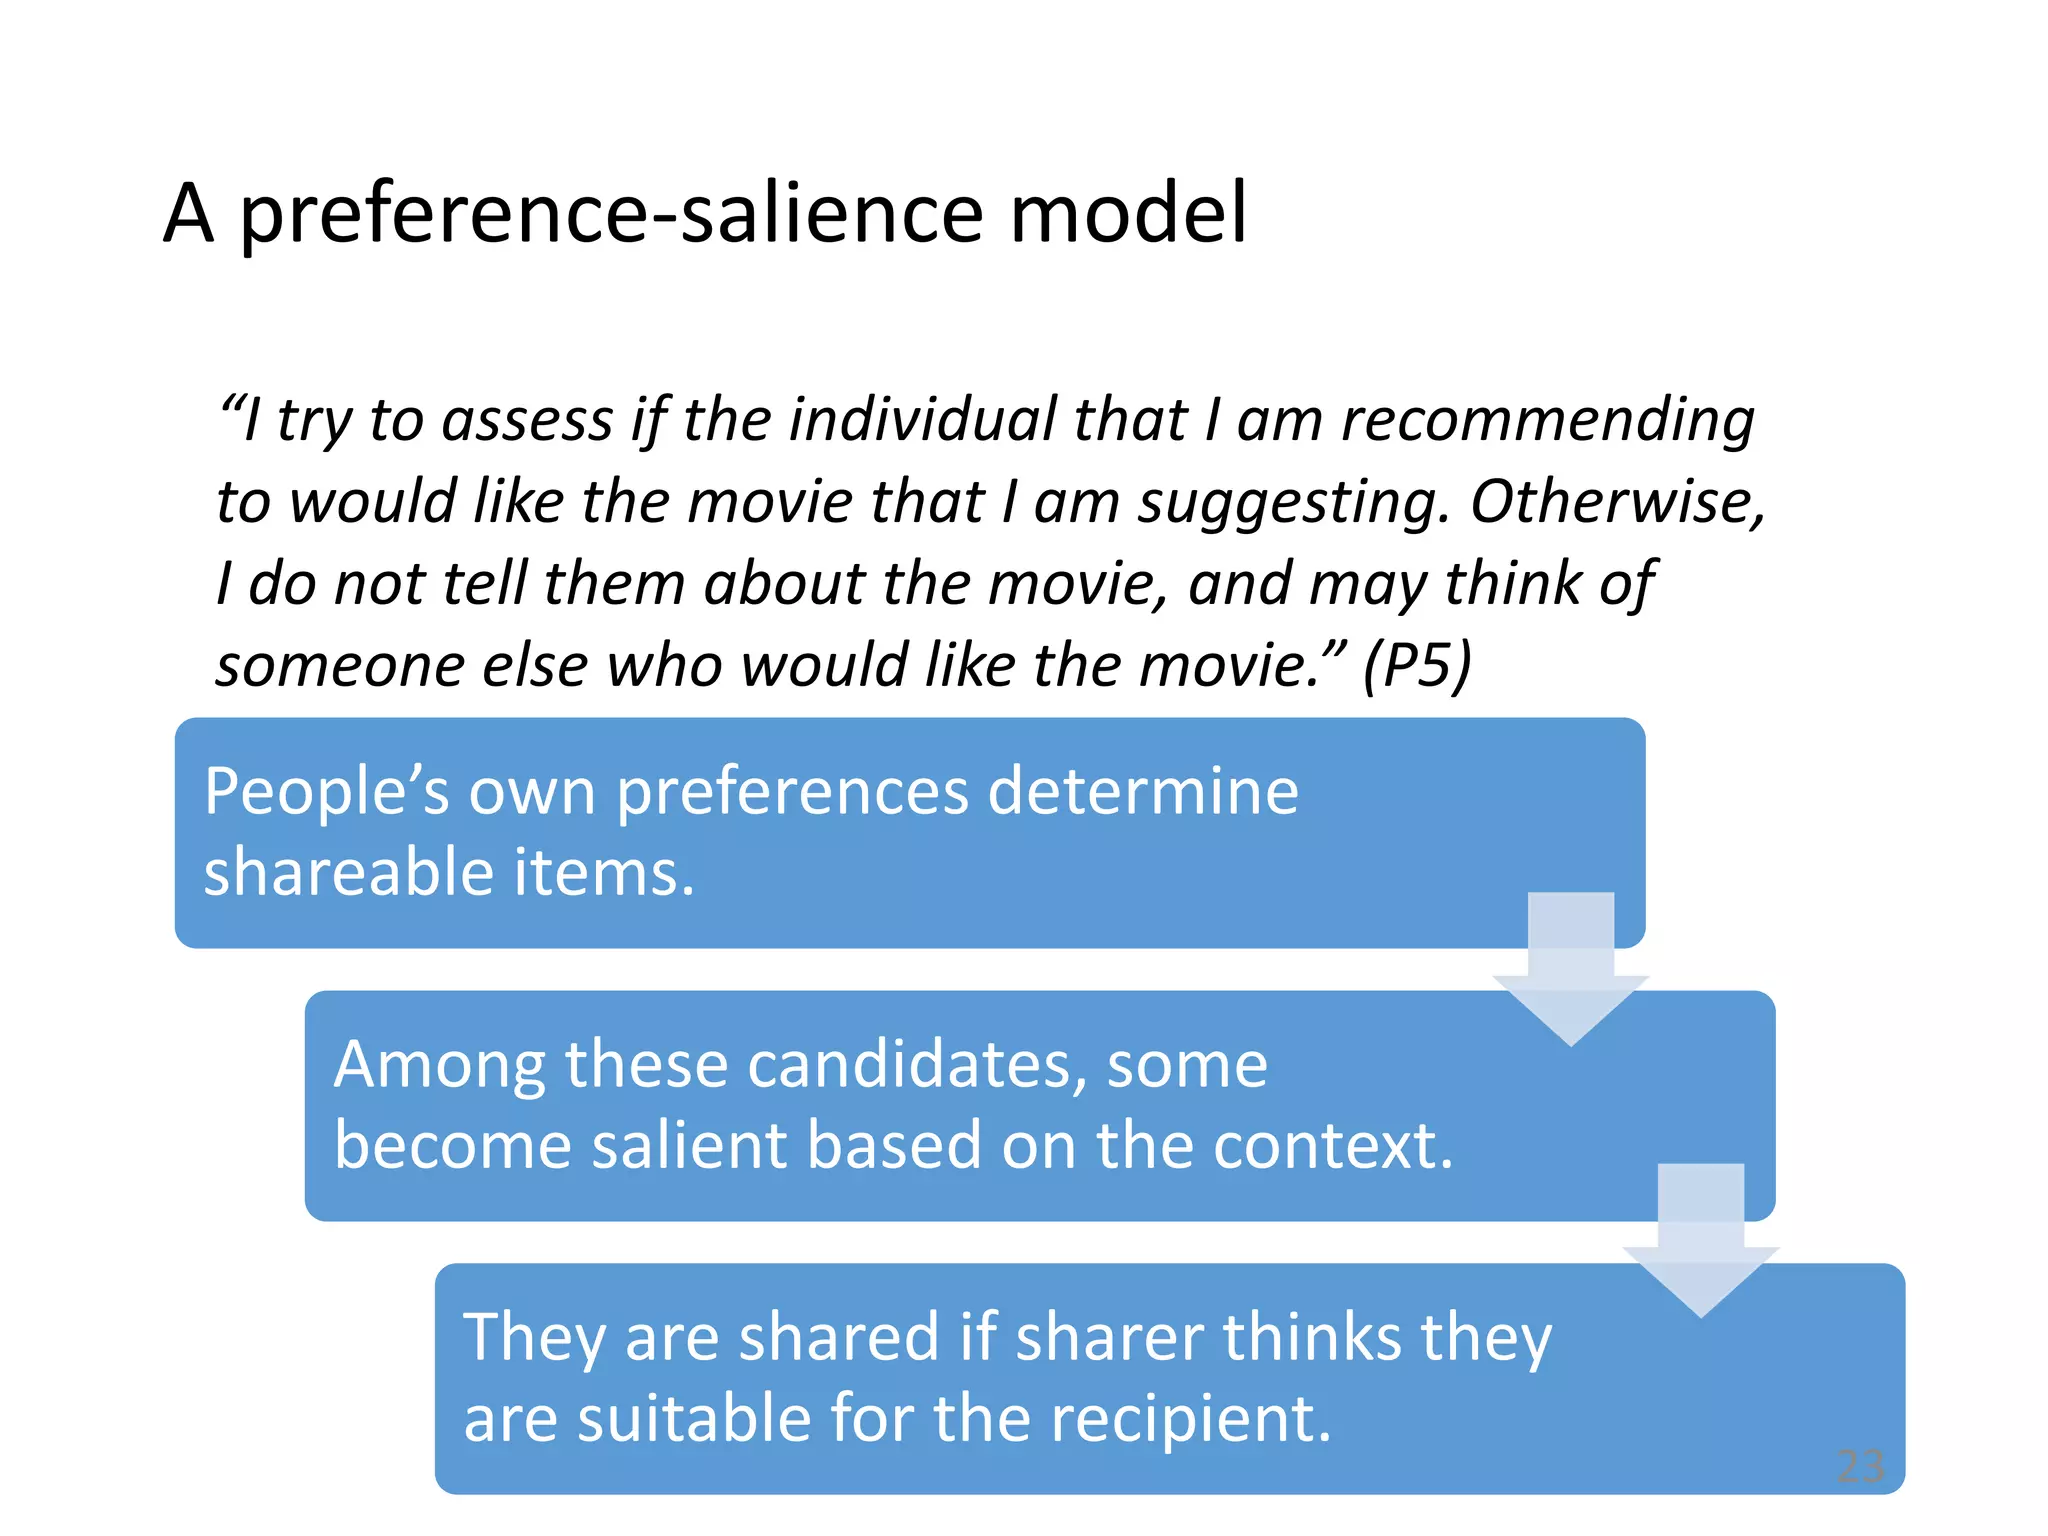
![Two motivations for sharing
Word-of-mouth
Individuation
– Establish a distinct identity
for oneself
Altruism
– Help others
[Dempsey et al. 2010]
Online Content sharing
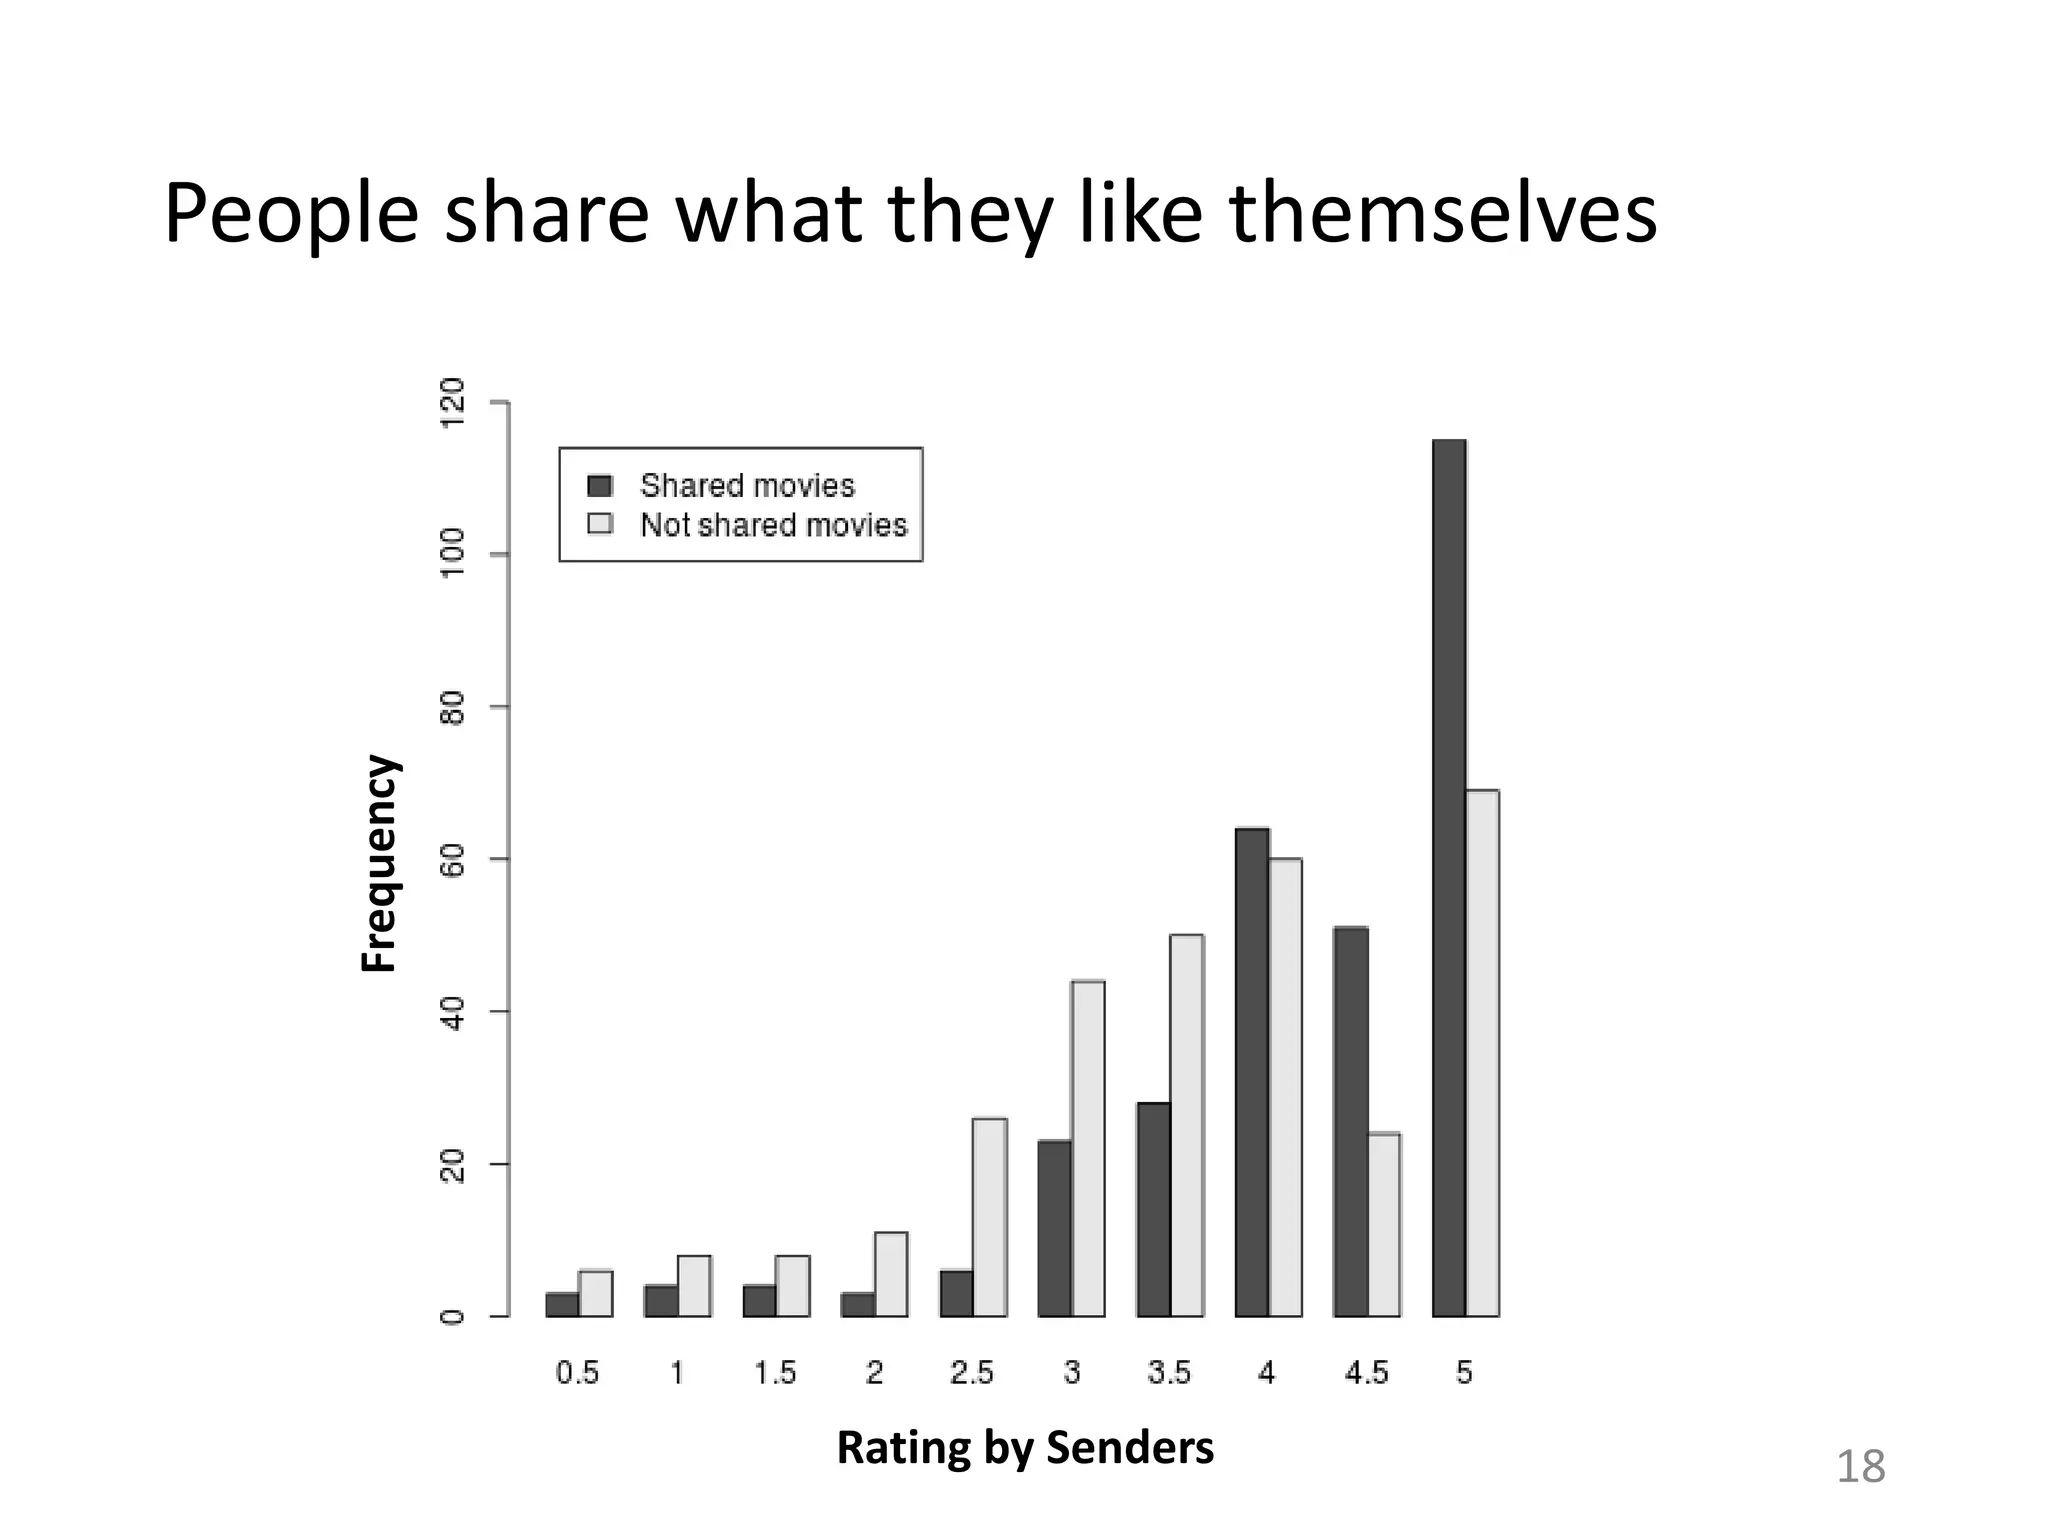
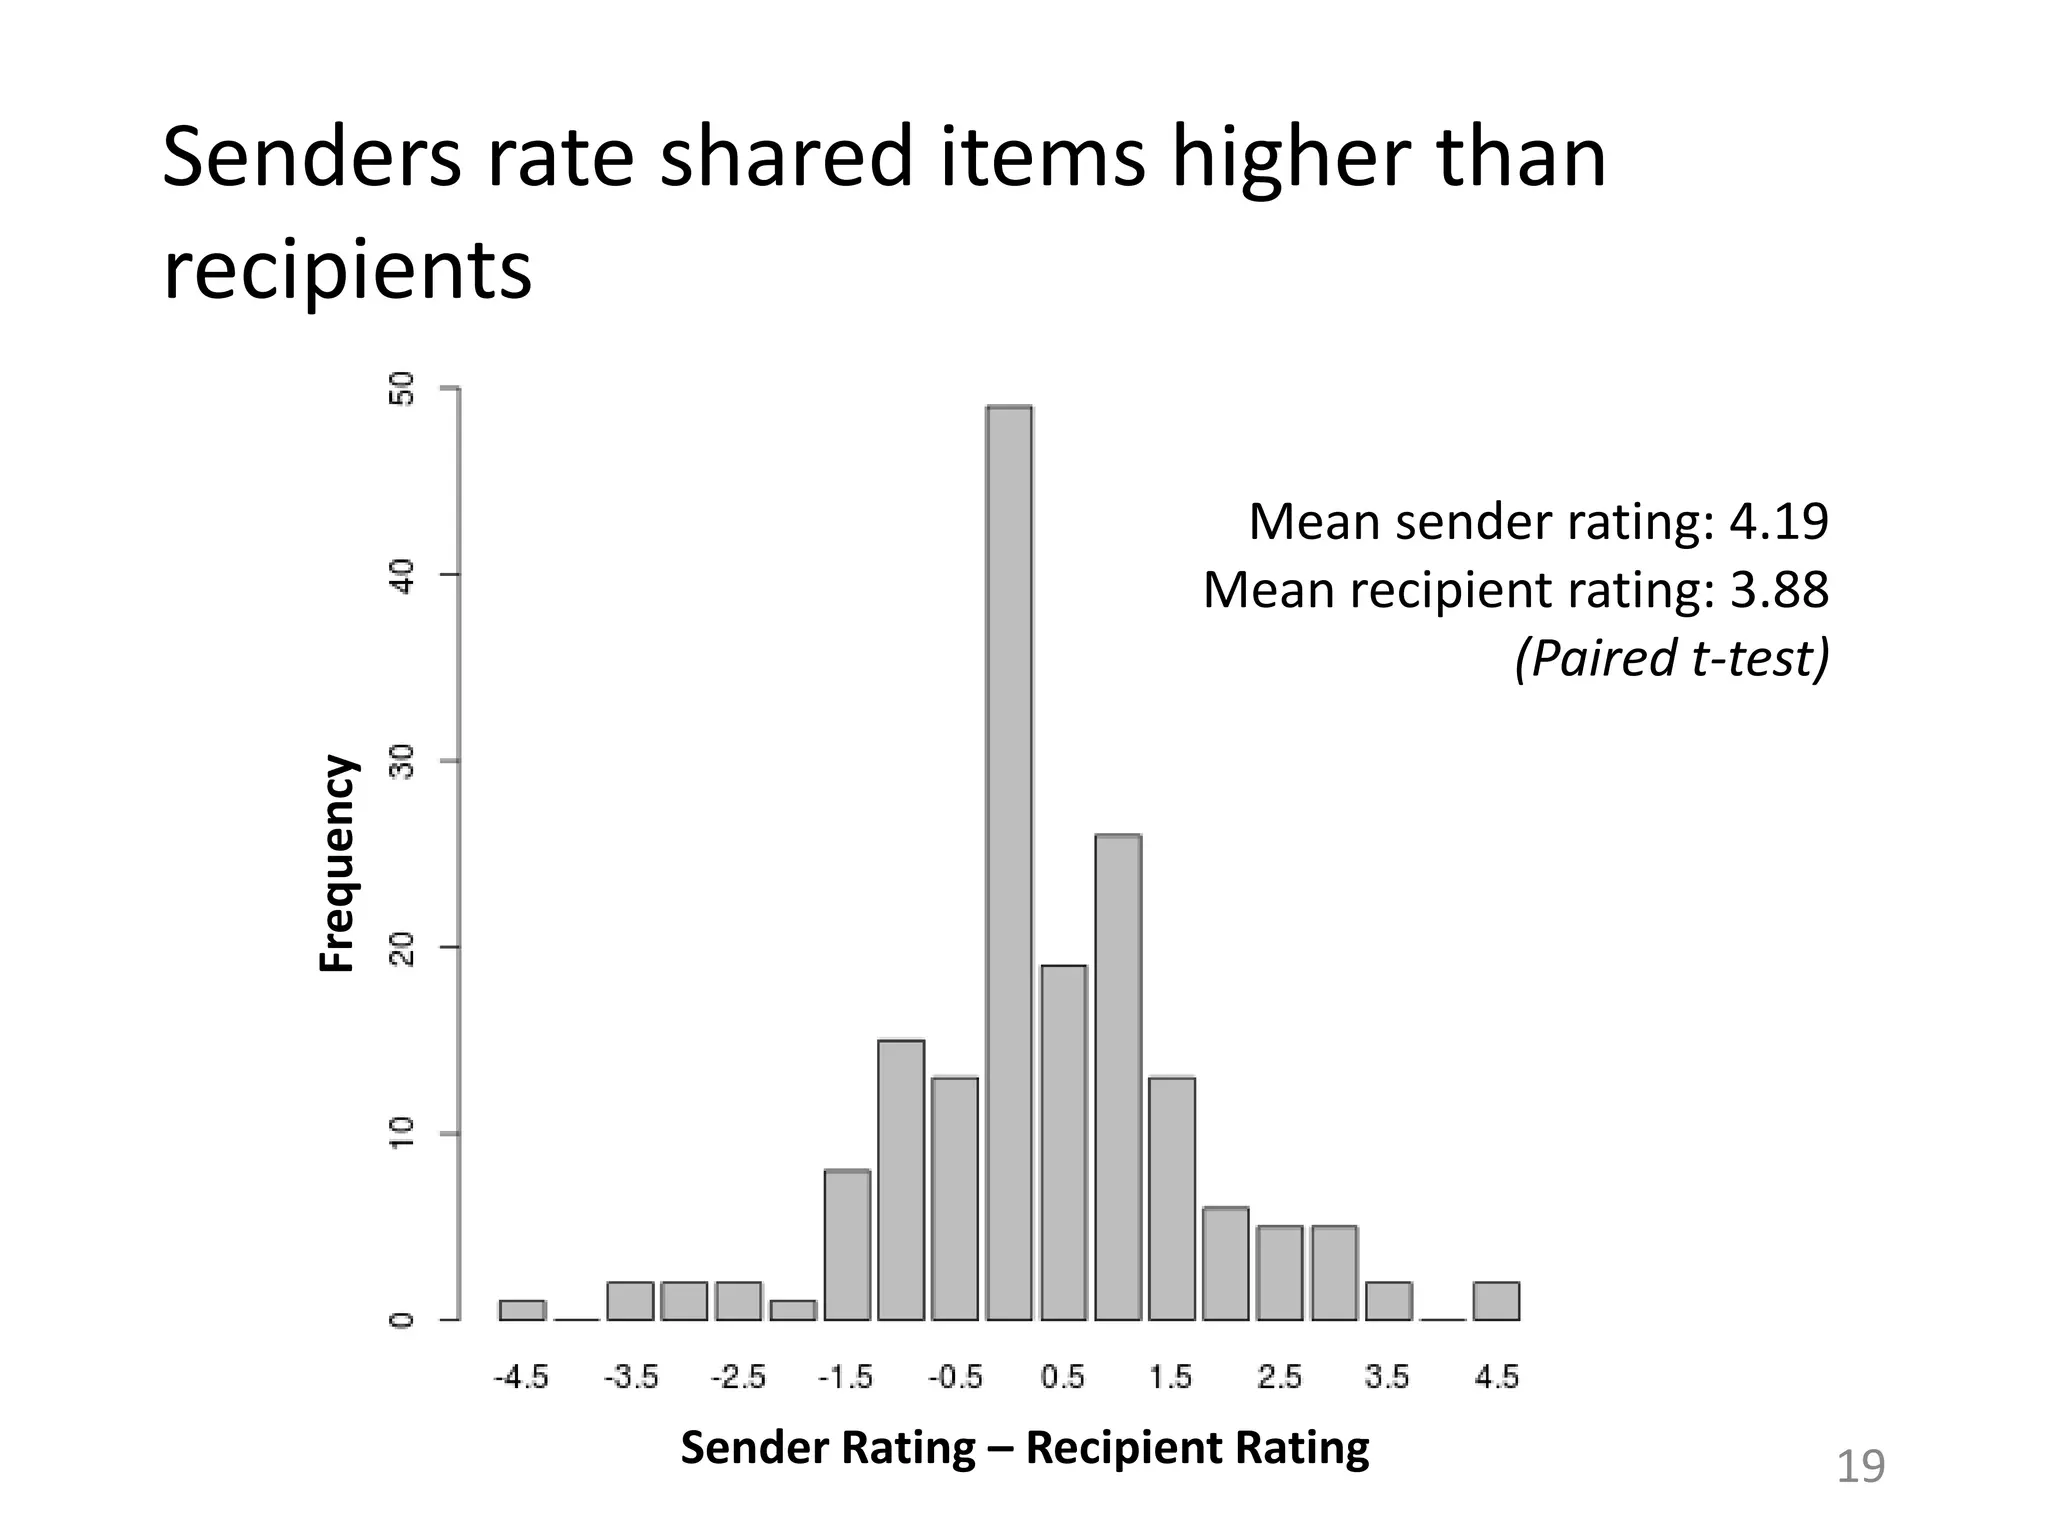
Sender’s preferences
– Sender shares what she
likes
Recipient’s preferences
– Sender shares what recipient
would like
Comparing sender’s rating versus recipient’s rating for a
shared item can indicate the relative effect of these
motivations. 14](https://image.slidesharecdn.com/b-examcornell-150610152114-lva1-app6891/75/The-interplay-of-personal-preference-and-social-influence-in-sharing-networks-Ph-D-defense-talk-14-2048.jpg)
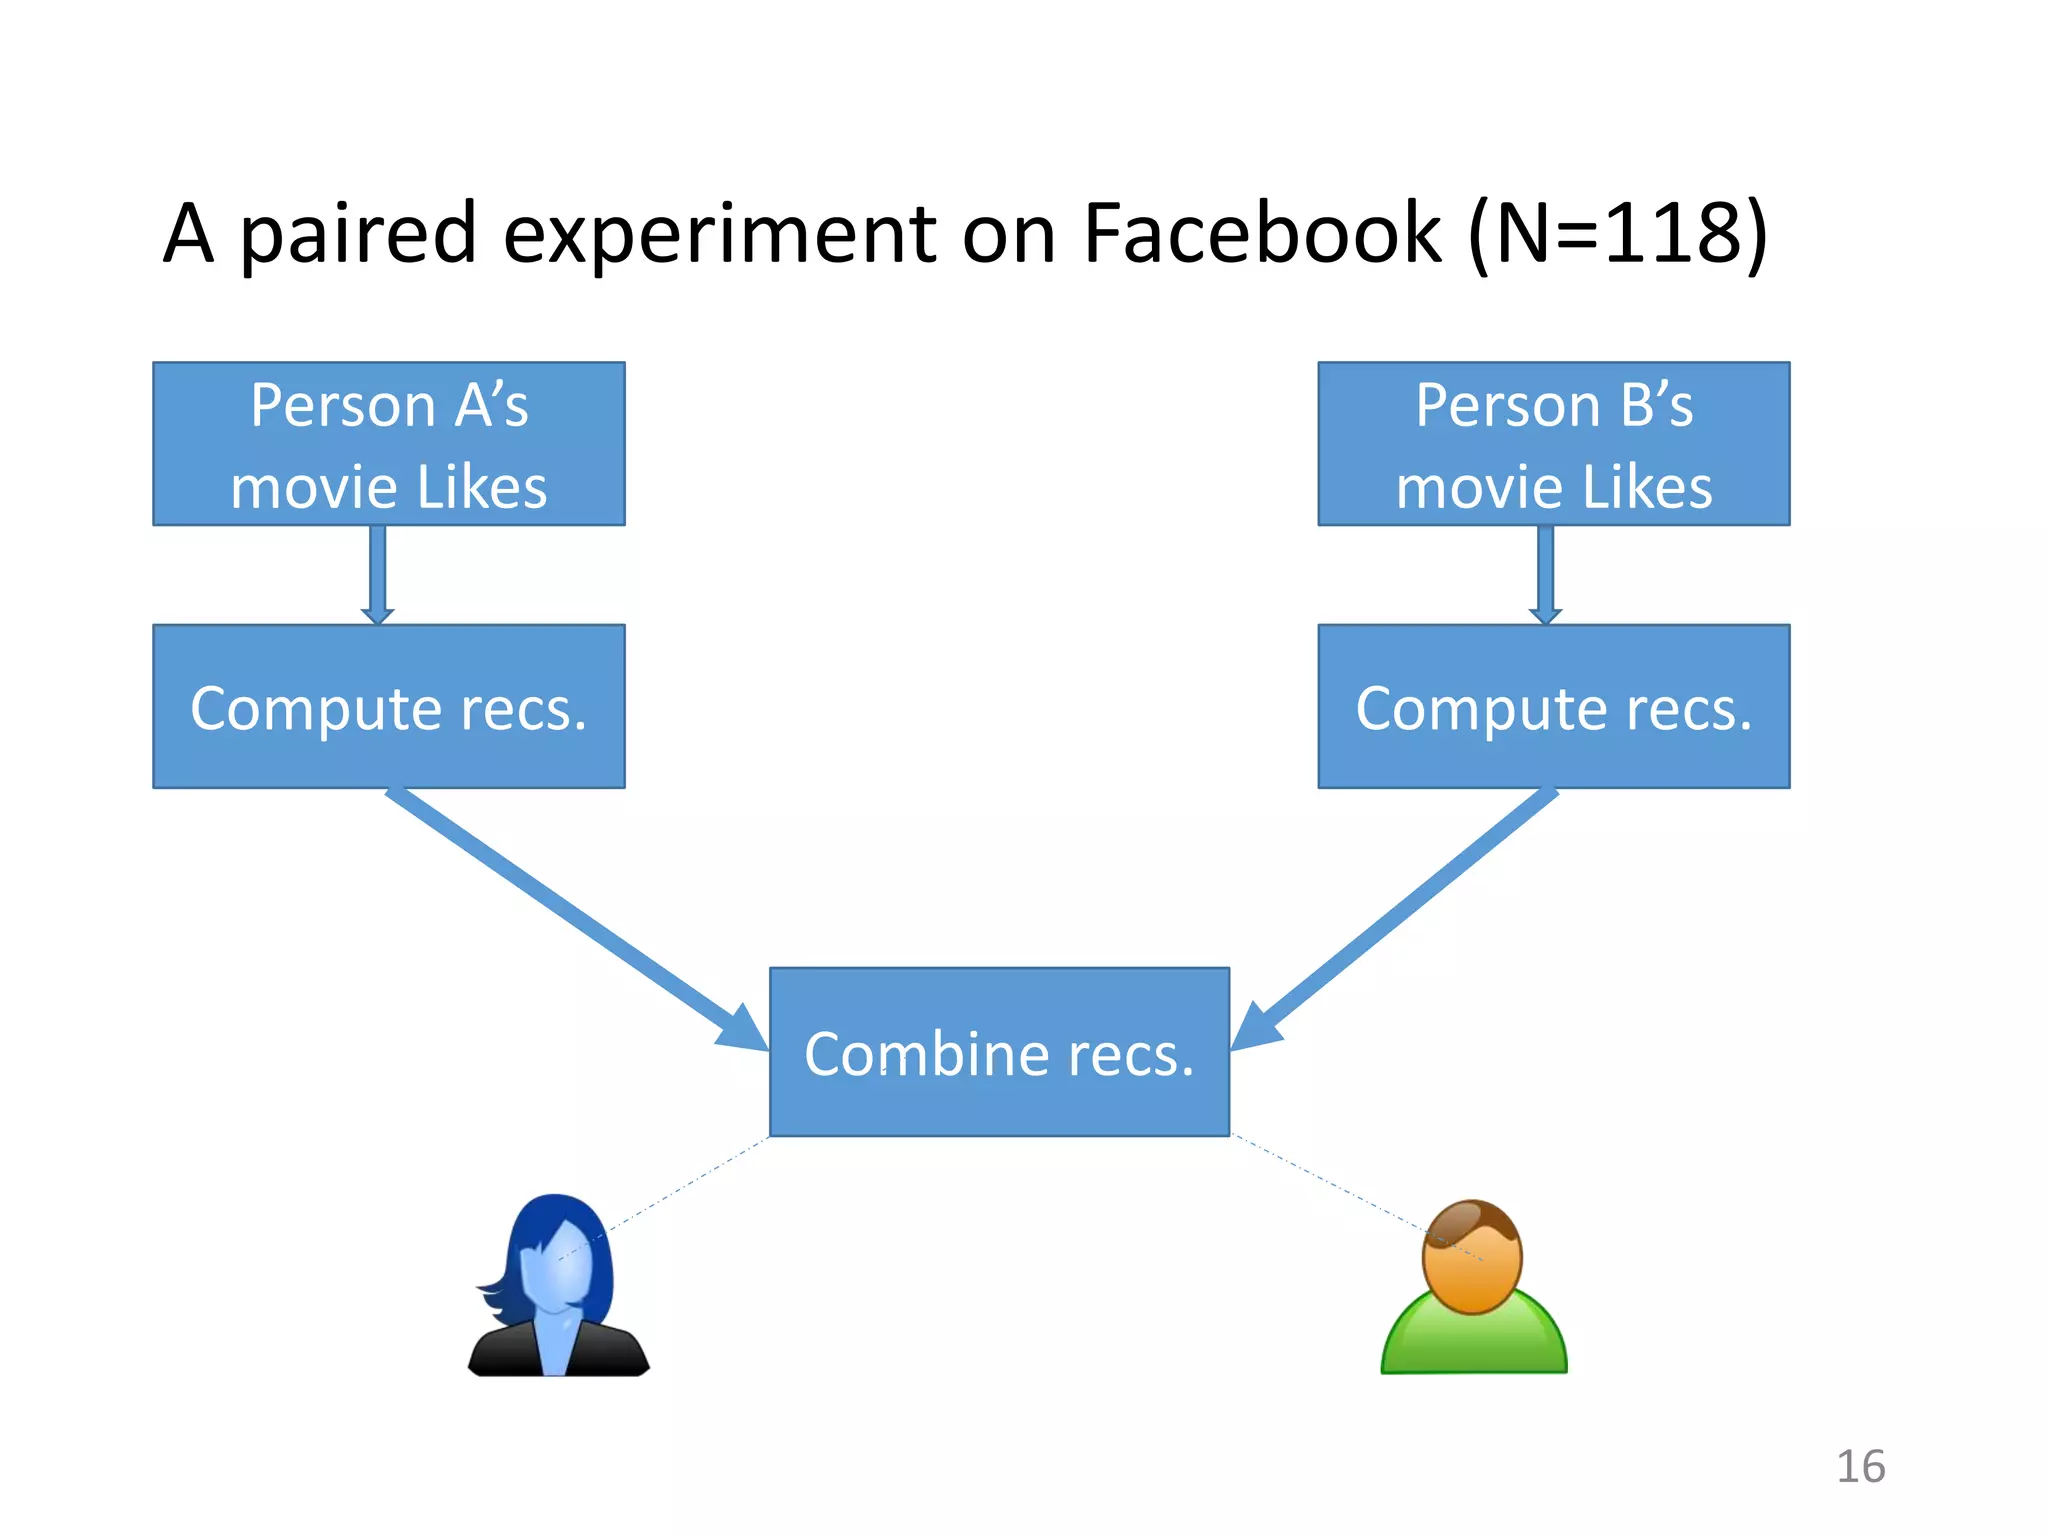
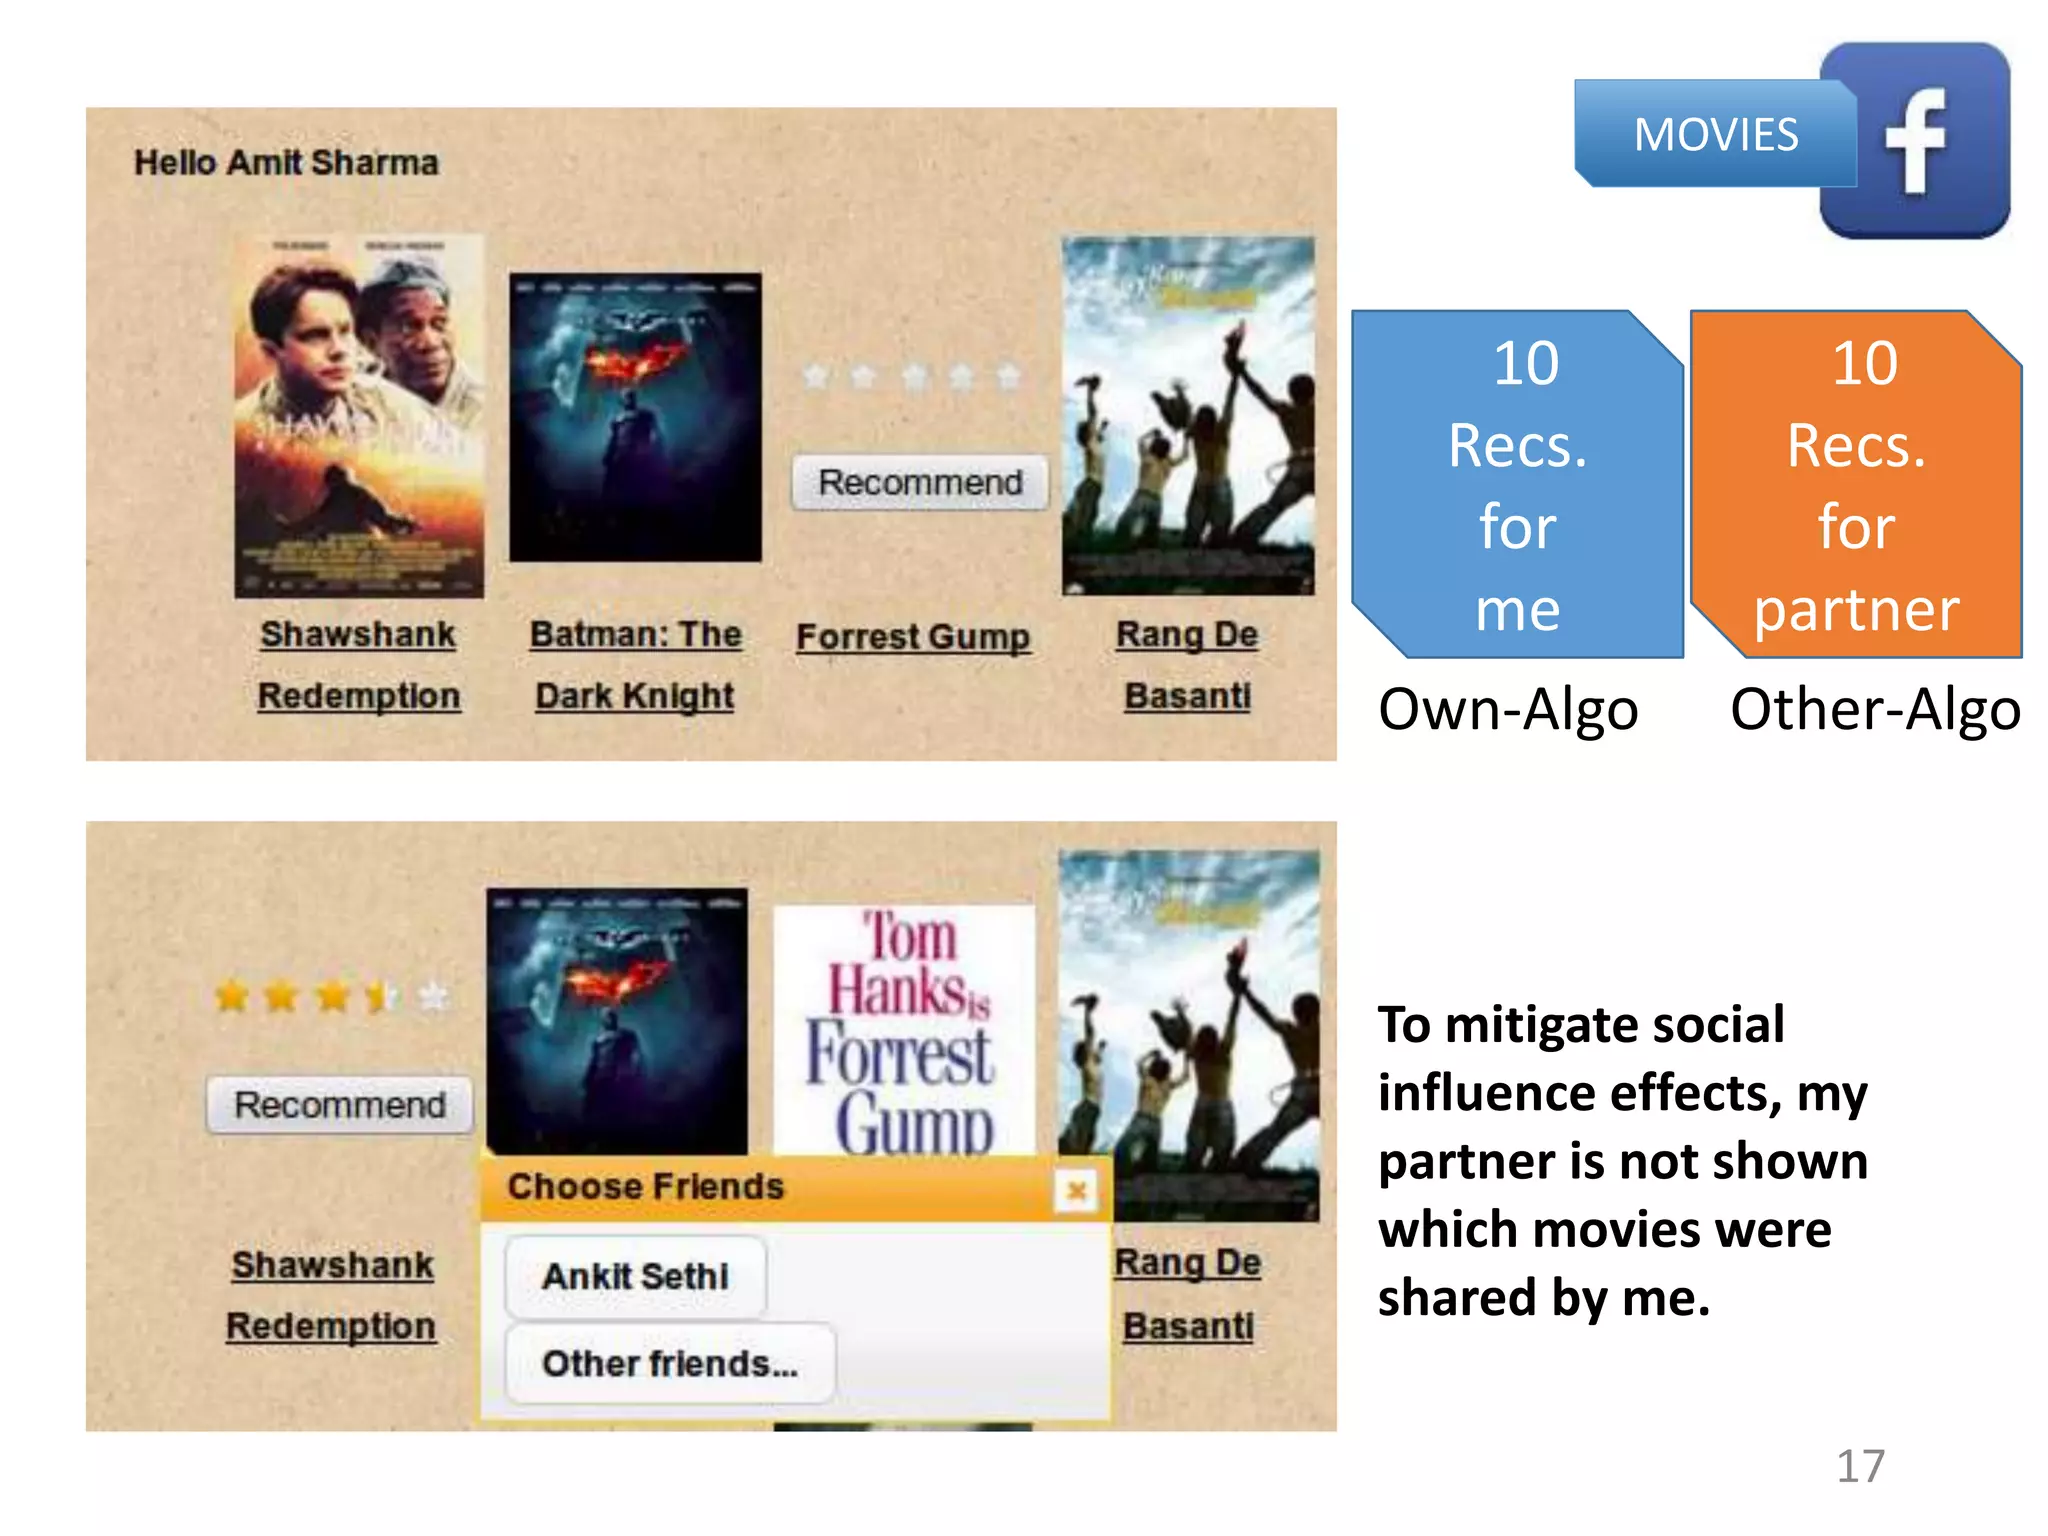
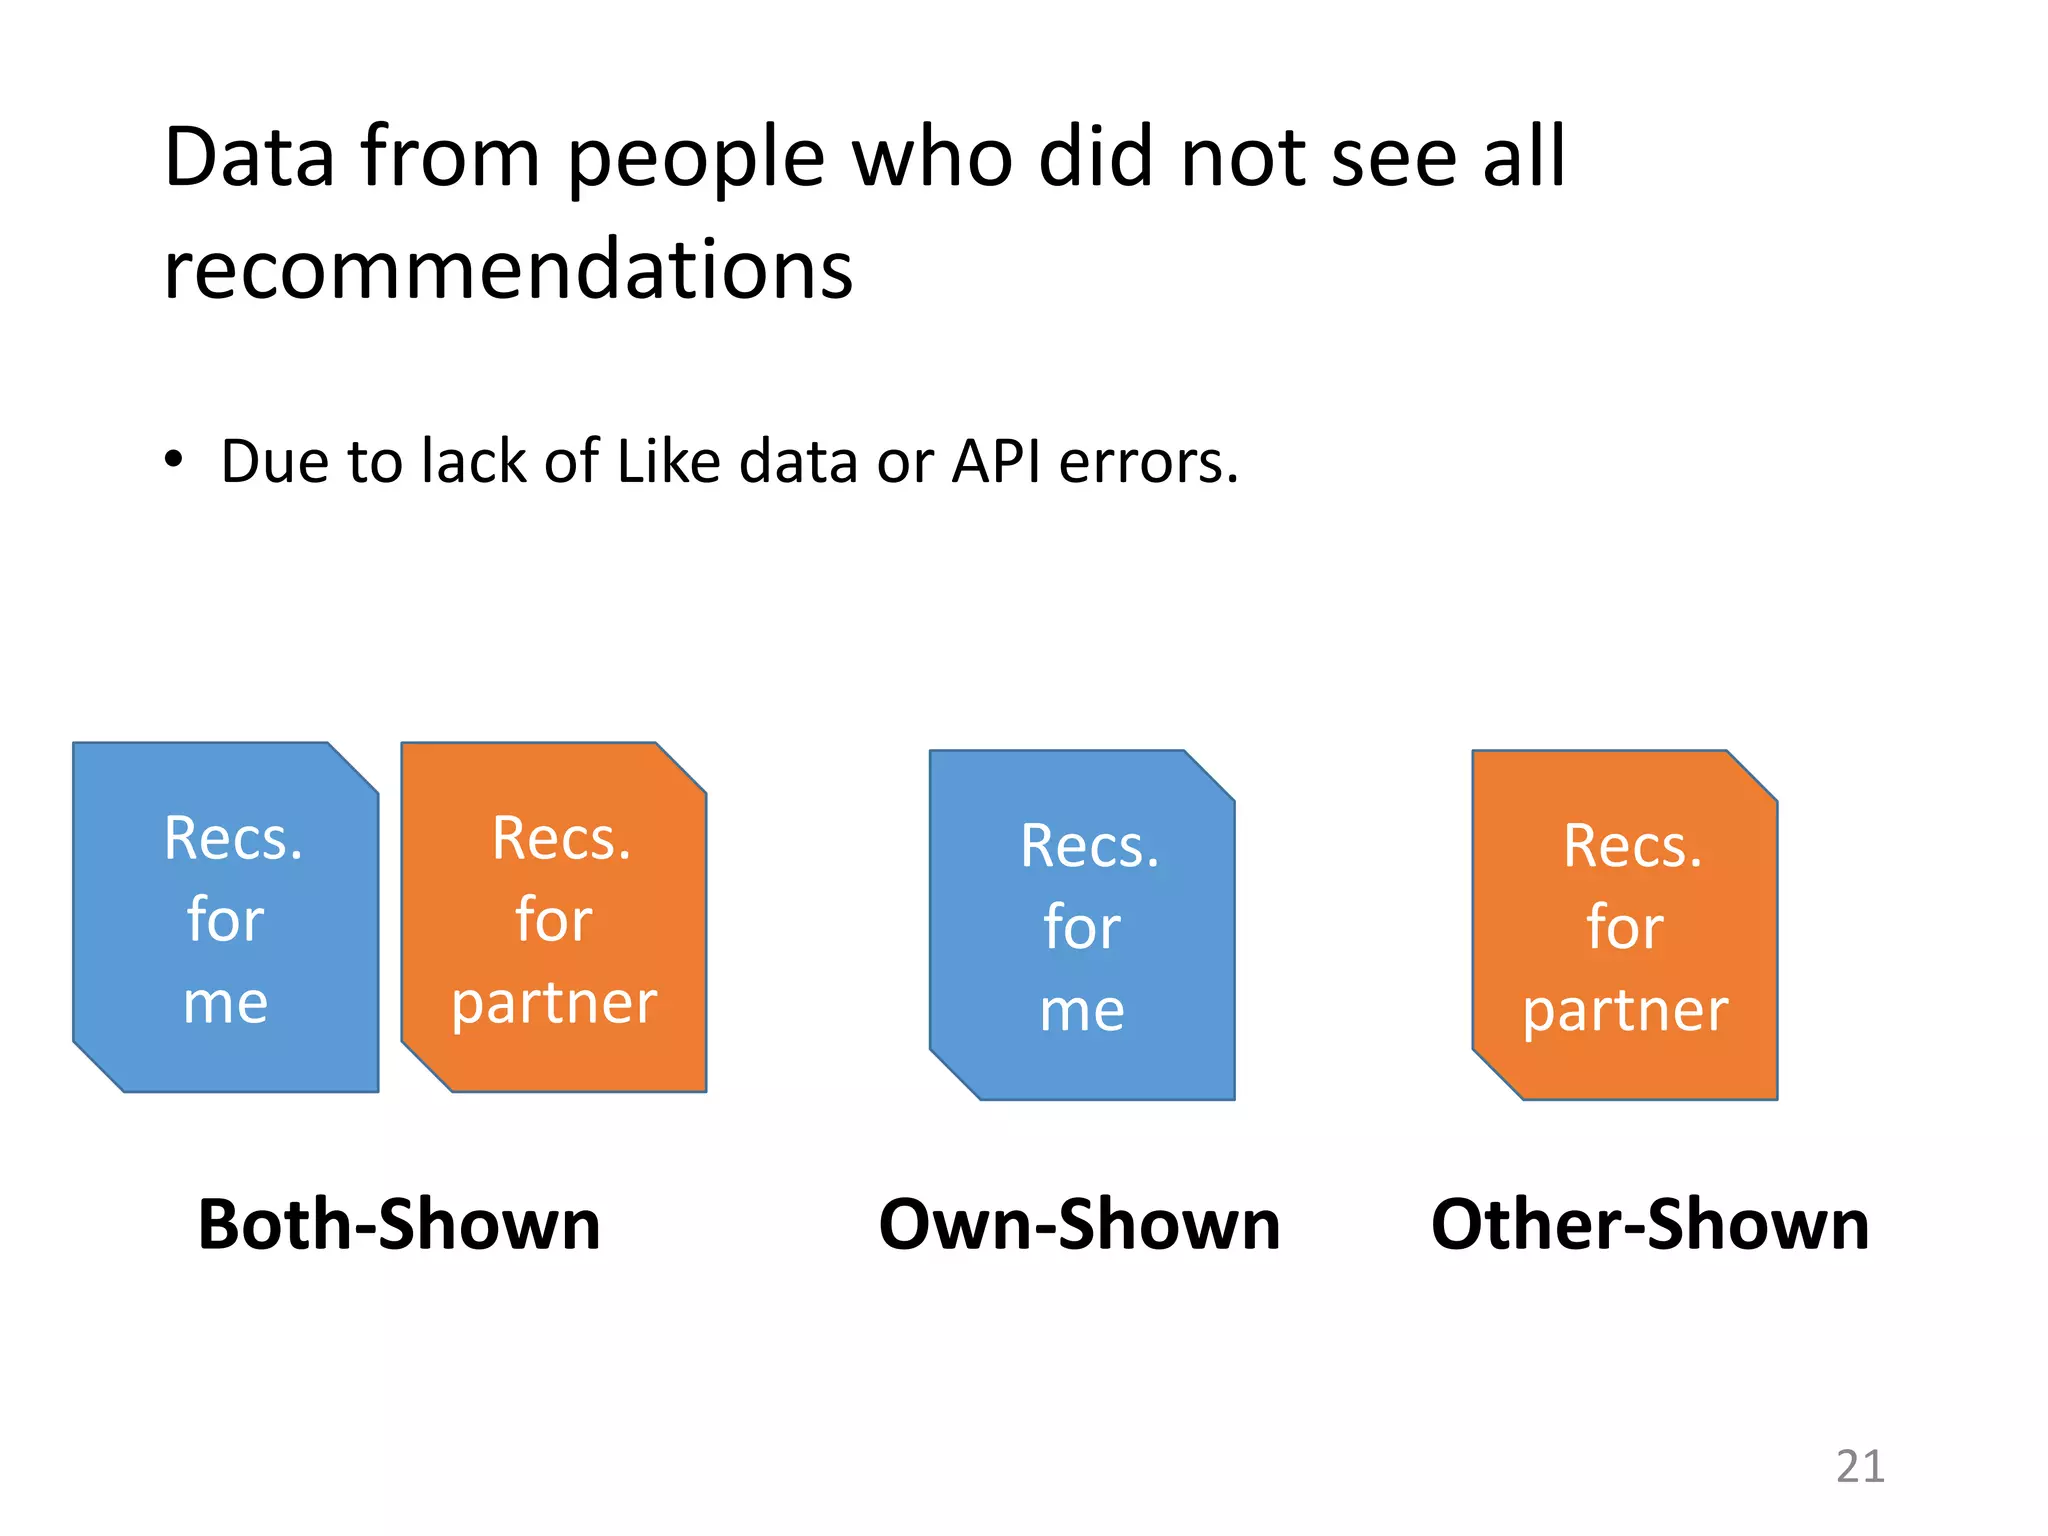
![Ratings for shared items depend on item set
shown
Recs.
for
me
Recs.
for
partner
Other-ShownOwn-Shown
22
Recs.
for
me
Recs.
for
partner
Both-Shown
Sender’s µ= 4.4
Recipient’s µ = 3.7
(***)
Sender’s µ = 4.06
Recipient’s µ = 4.28
(ns)
Own-Algo: (***)
Other-Algo: (ns)
[Paired t-test]
Salience of items impacts what gets shared.](https://image.slidesharecdn.com/b-examcornell-150610152114-lva1-app6891/75/The-interplay-of-personal-preference-and-social-influence-in-sharing-networks-Ph-D-defense-talk-22-2048.jpg)
![How much and why do people copy feed
actions?
29
Virality is rare, vast majority of shares spread
to zero or one degree [Goel et al. ‘12].
Most studies on social media find a nontrivial
correlation between the activities of a user
and her friends [Sharma and Cosley ’13].
Q: Can we ascribe how many copy actions are
caused by influence from friends?
In general, hard to infer from observational
data alone [Shalizi and Thomas ‘11].](https://image.slidesharecdn.com/b-examcornell-150610152114-lva1-app6891/75/The-interplay-of-personal-preference-and-social-influence-in-sharing-networks-Ph-D-defense-talk-29-2048.jpg)
![Many processes for generating a common
action by friends
• Social Influence
• Homophily
30
Without controlling for homophily, we may
overestimate influence [Aral et al. ’09, Lewis et al. ‘12].](https://image.slidesharecdn.com/b-examcornell-150610152114-lva1-app6891/75/The-interplay-of-personal-preference-and-social-influence-in-sharing-networks-Ph-D-defense-talk-30-2048.jpg)
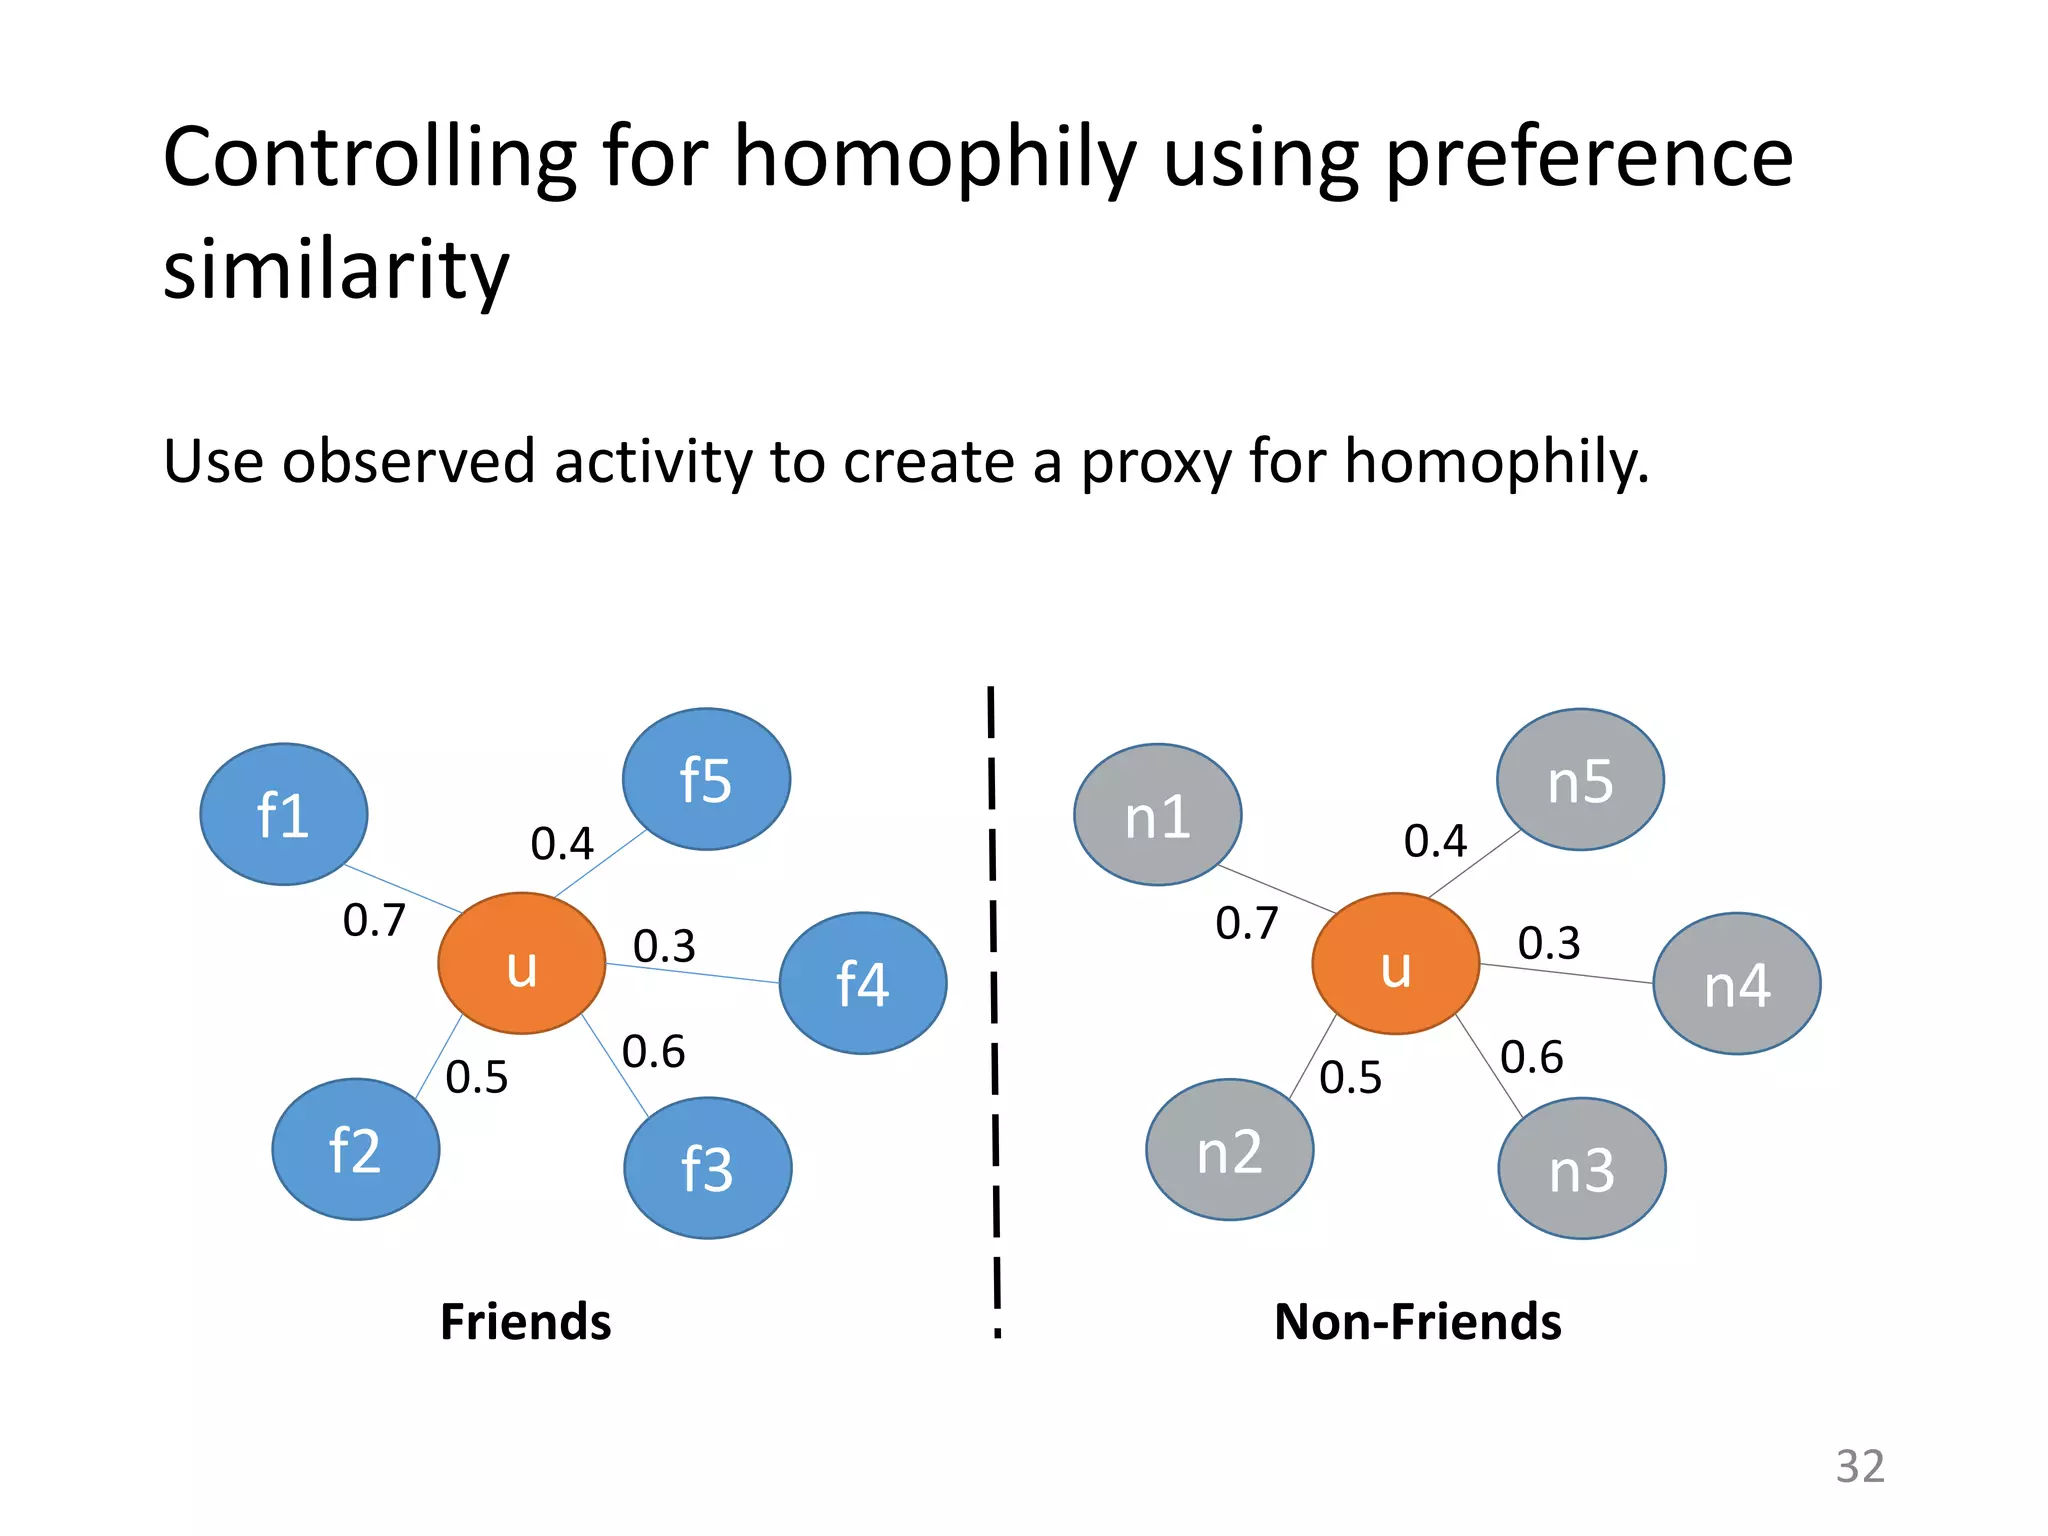
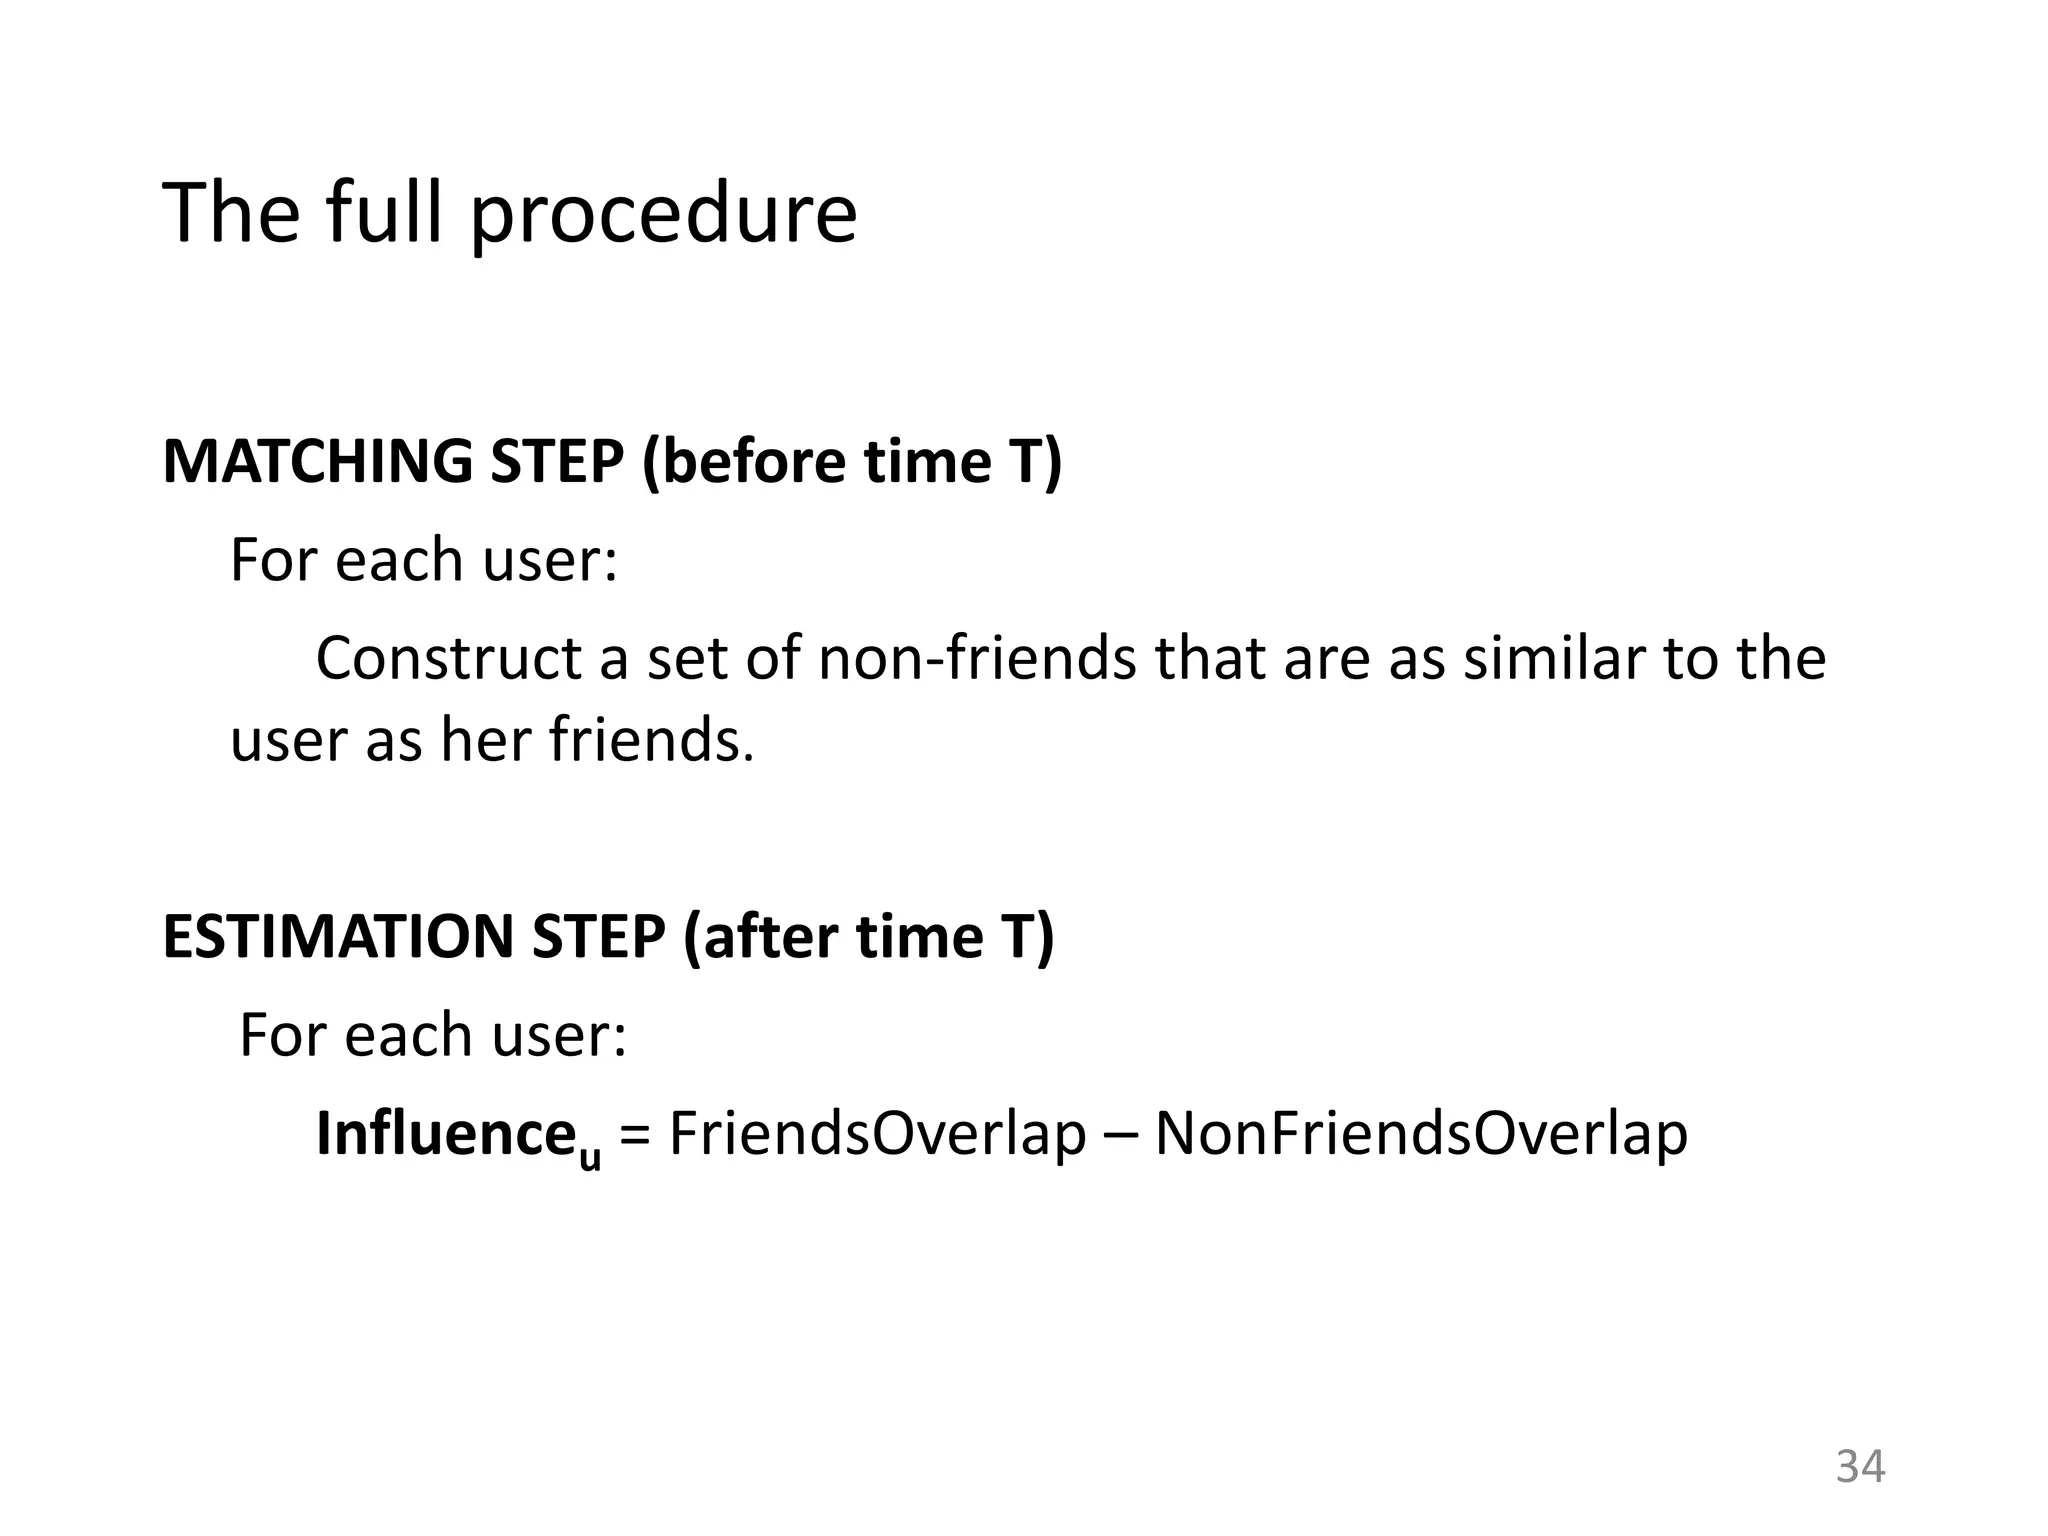
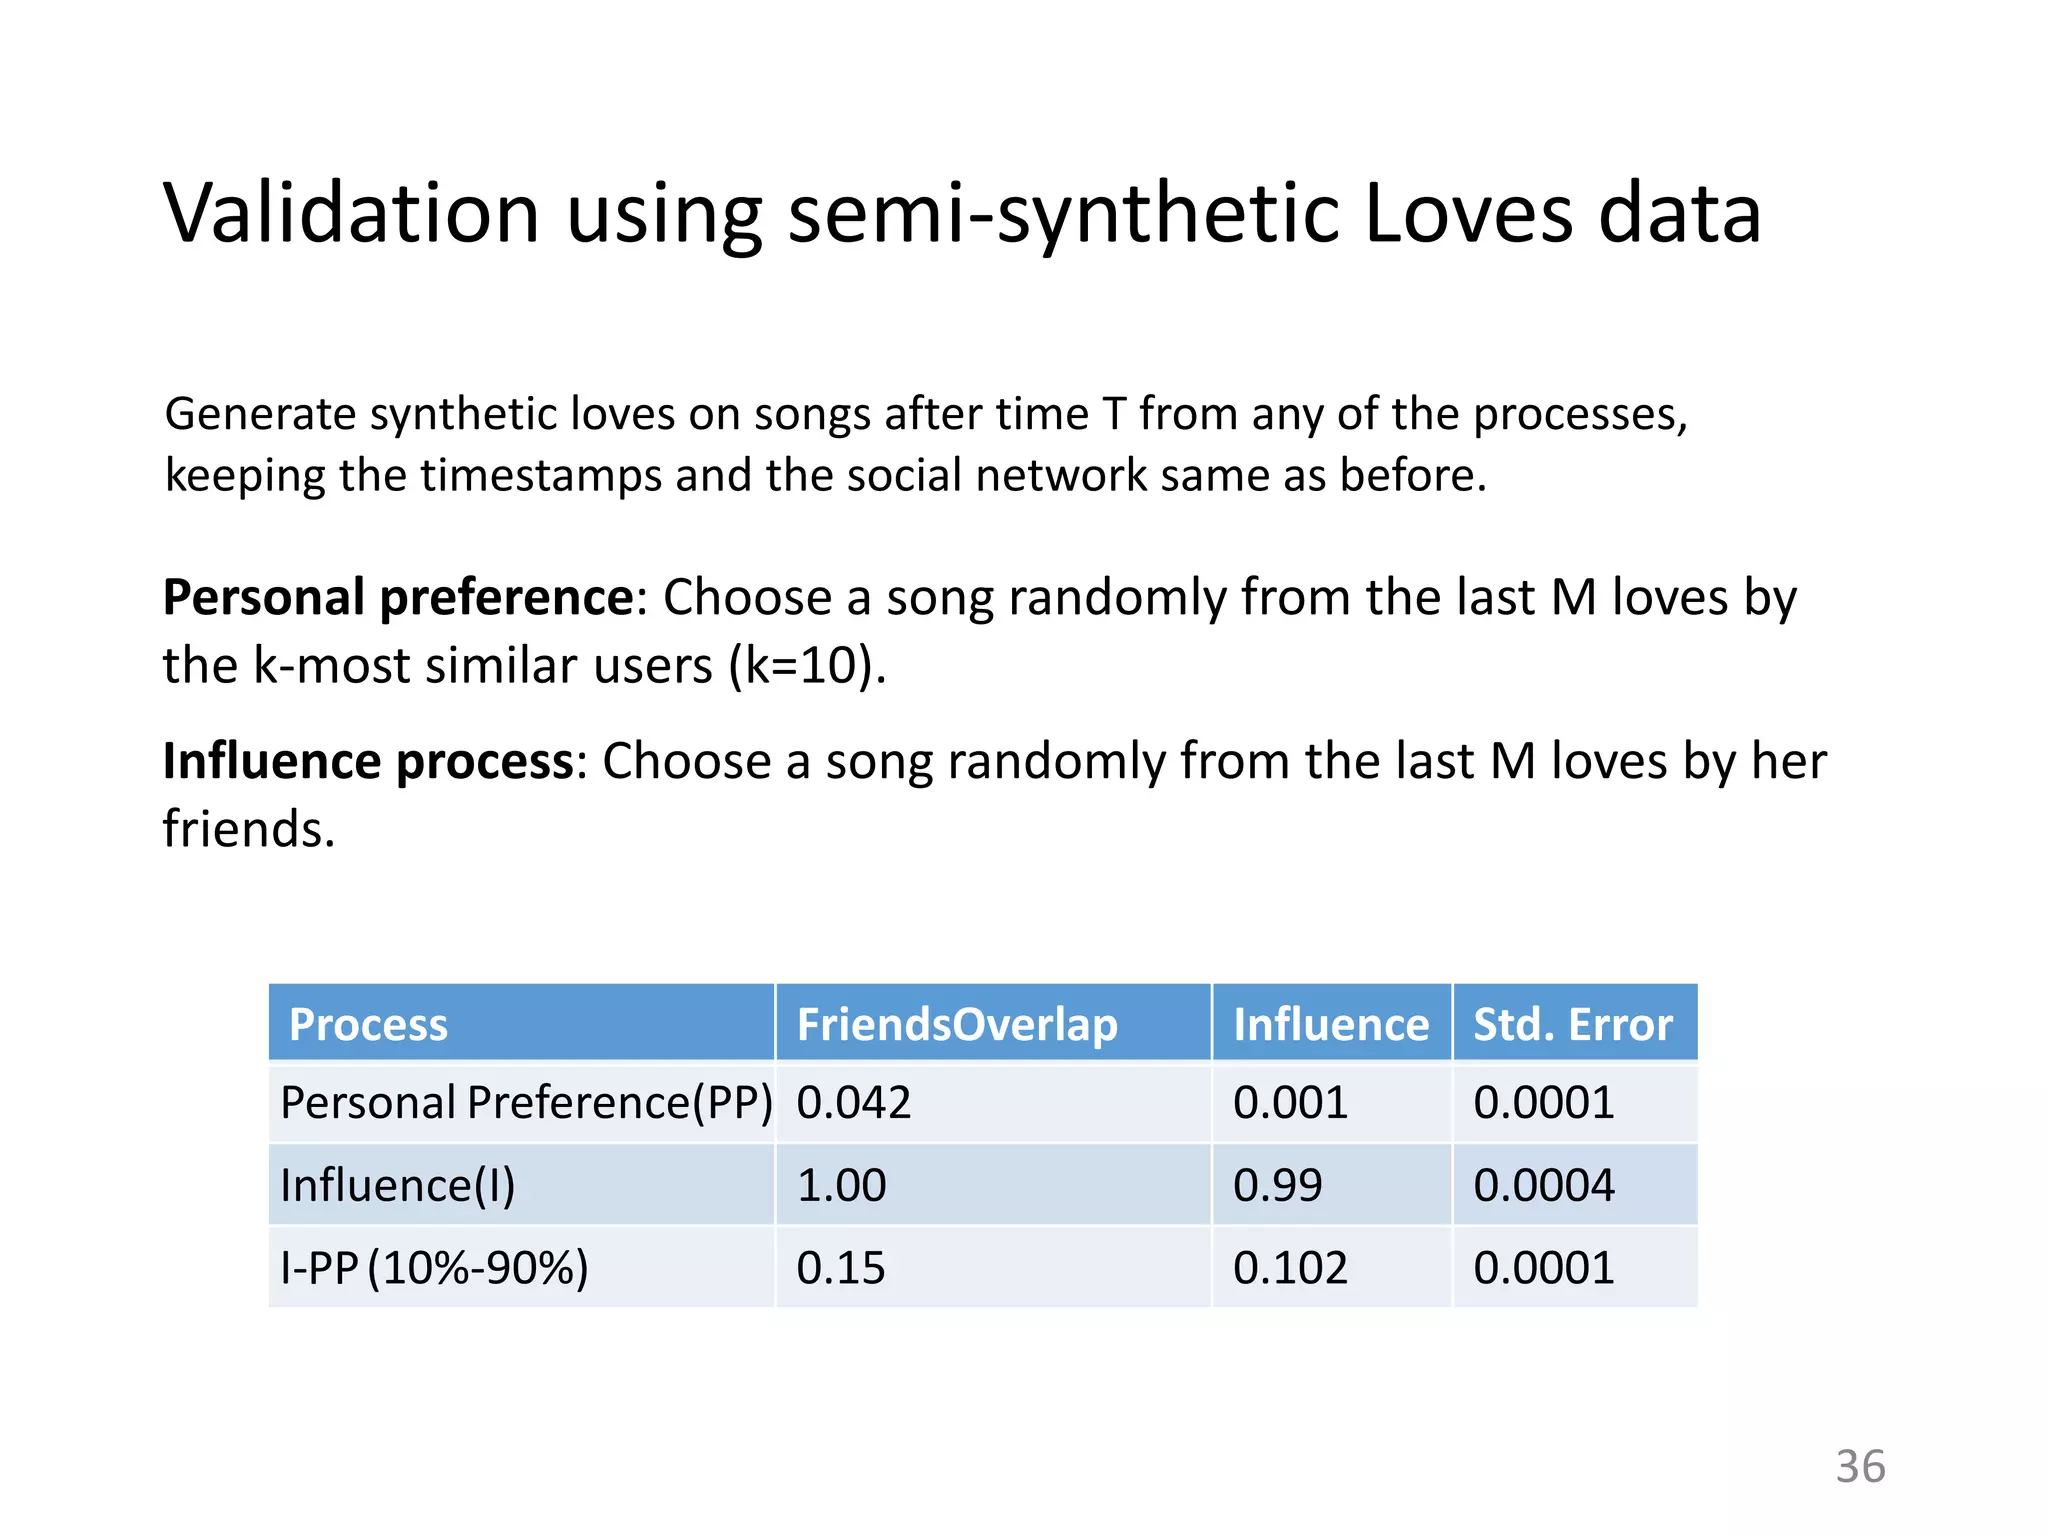
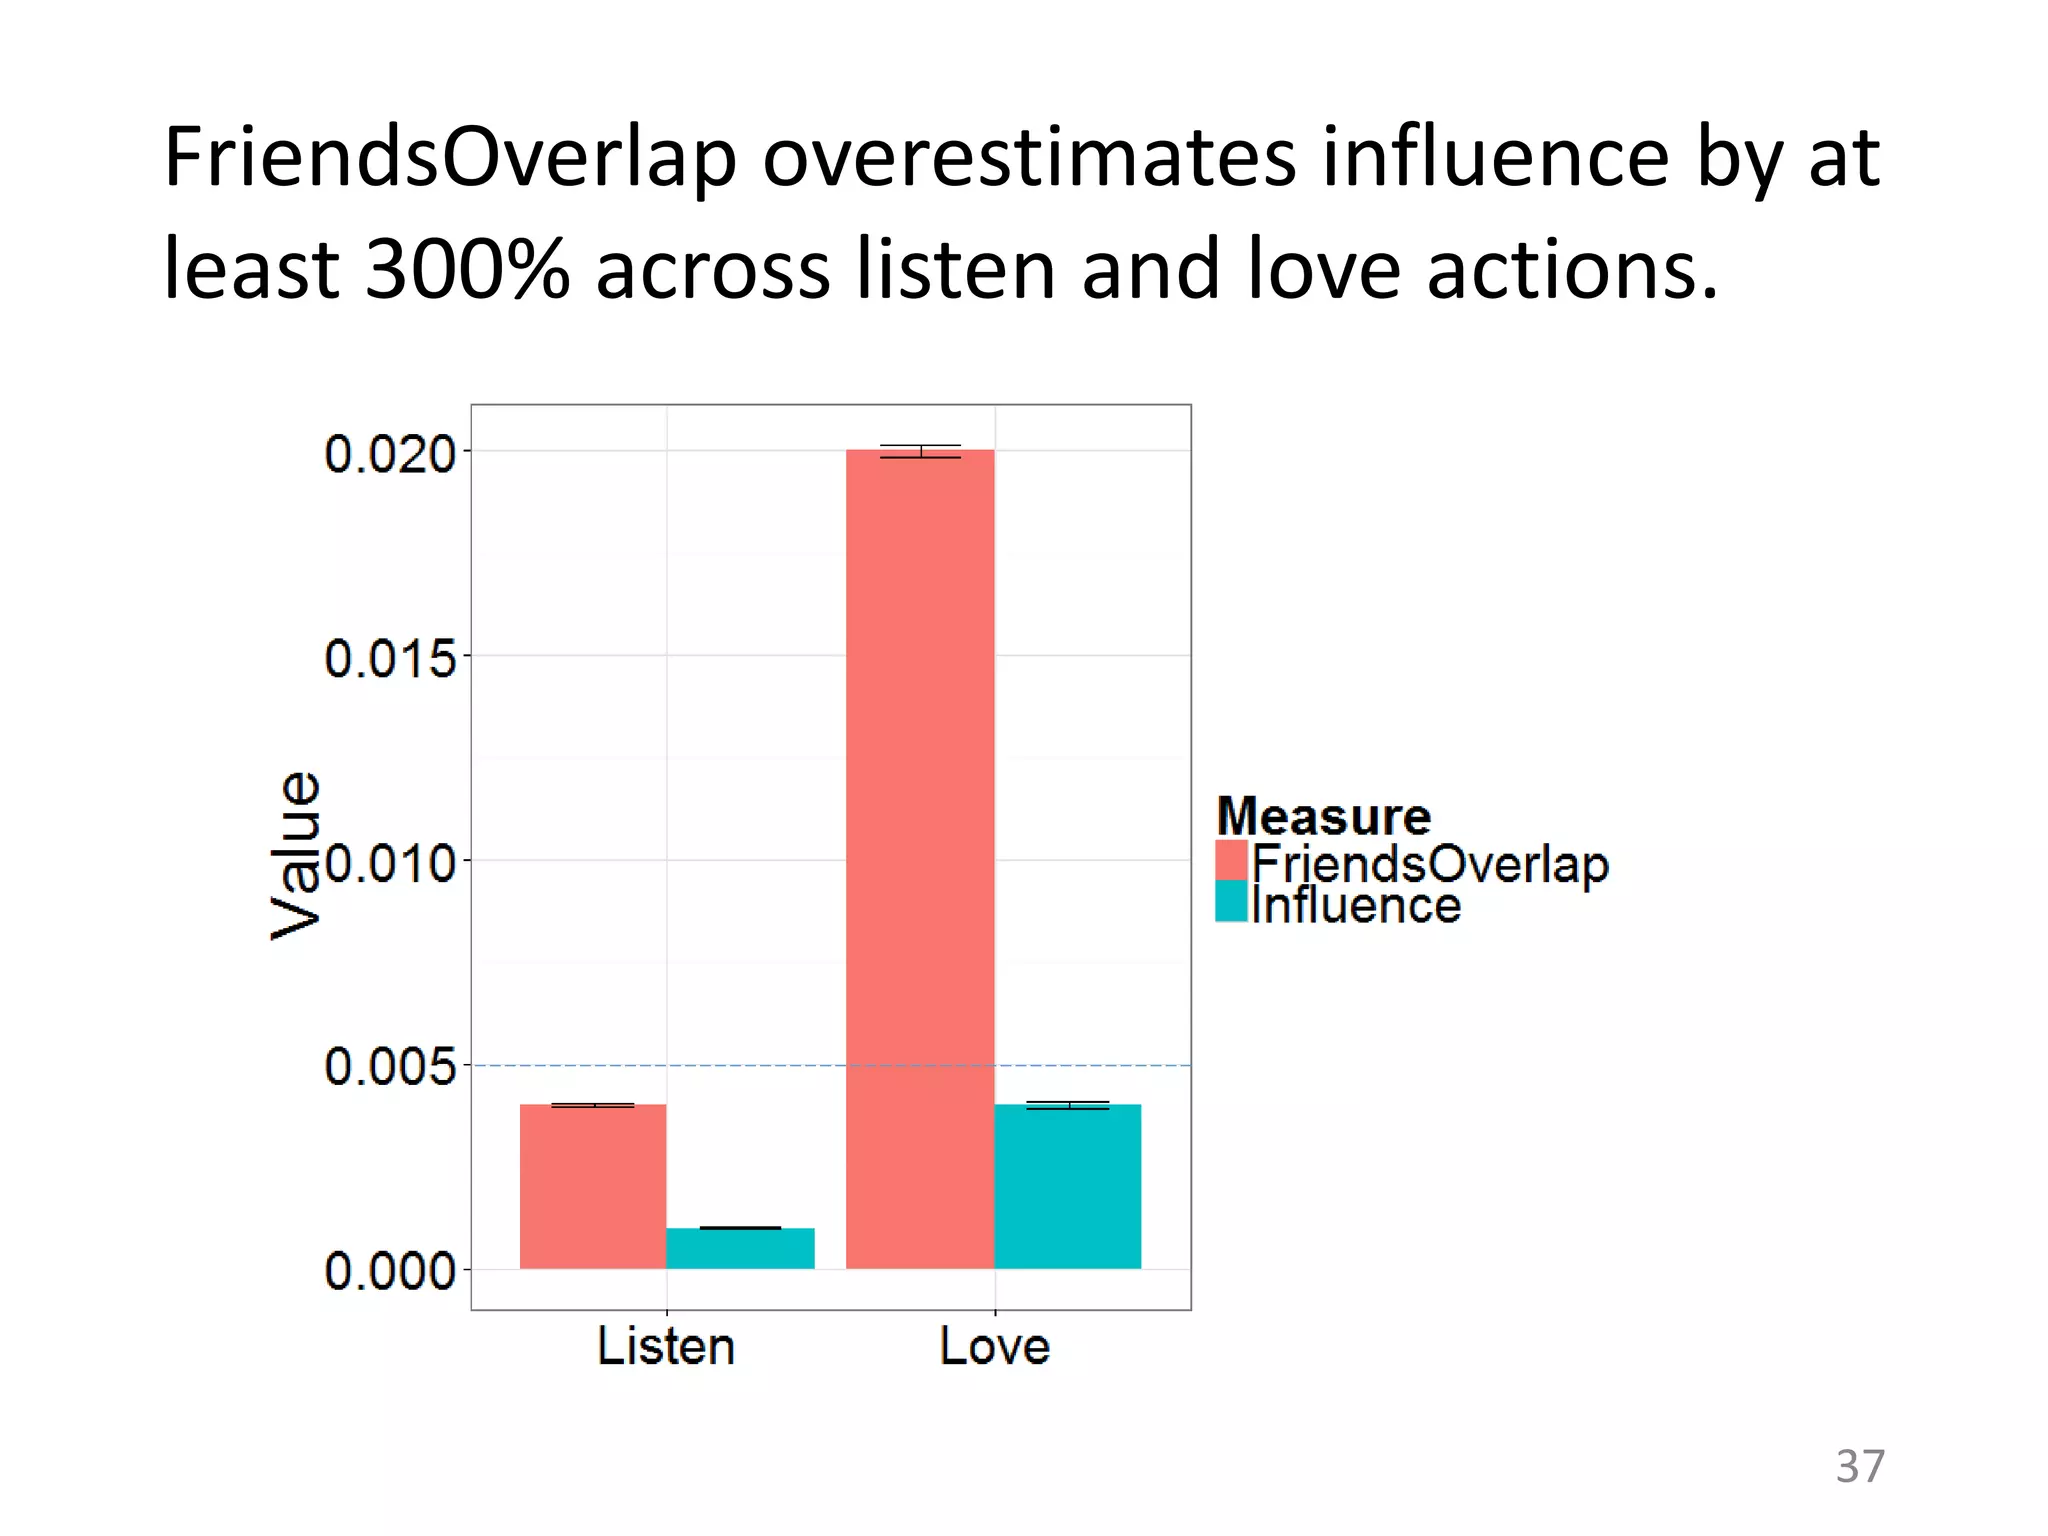
![Estimating the actions due to influence
For each action by a user, construct feeds from friends and
non-friends containing their last M actions respectively.
Friends Overlap = Fraction of actions done by u that are also
in the friends’ Feed
(Naïve measure of influence [Ghosh et al. ‘10, Bakshy et
al. ‘11]).
NonFriends Overlap = Fraction of actions done by u that are
also in the non-friends’ Feed.
33](https://image.slidesharecdn.com/b-examcornell-150610152114-lva1-app6891/75/The-interplay-of-personal-preference-and-social-influence-in-sharing-networks-Ph-D-defense-talk-33-2048.jpg)
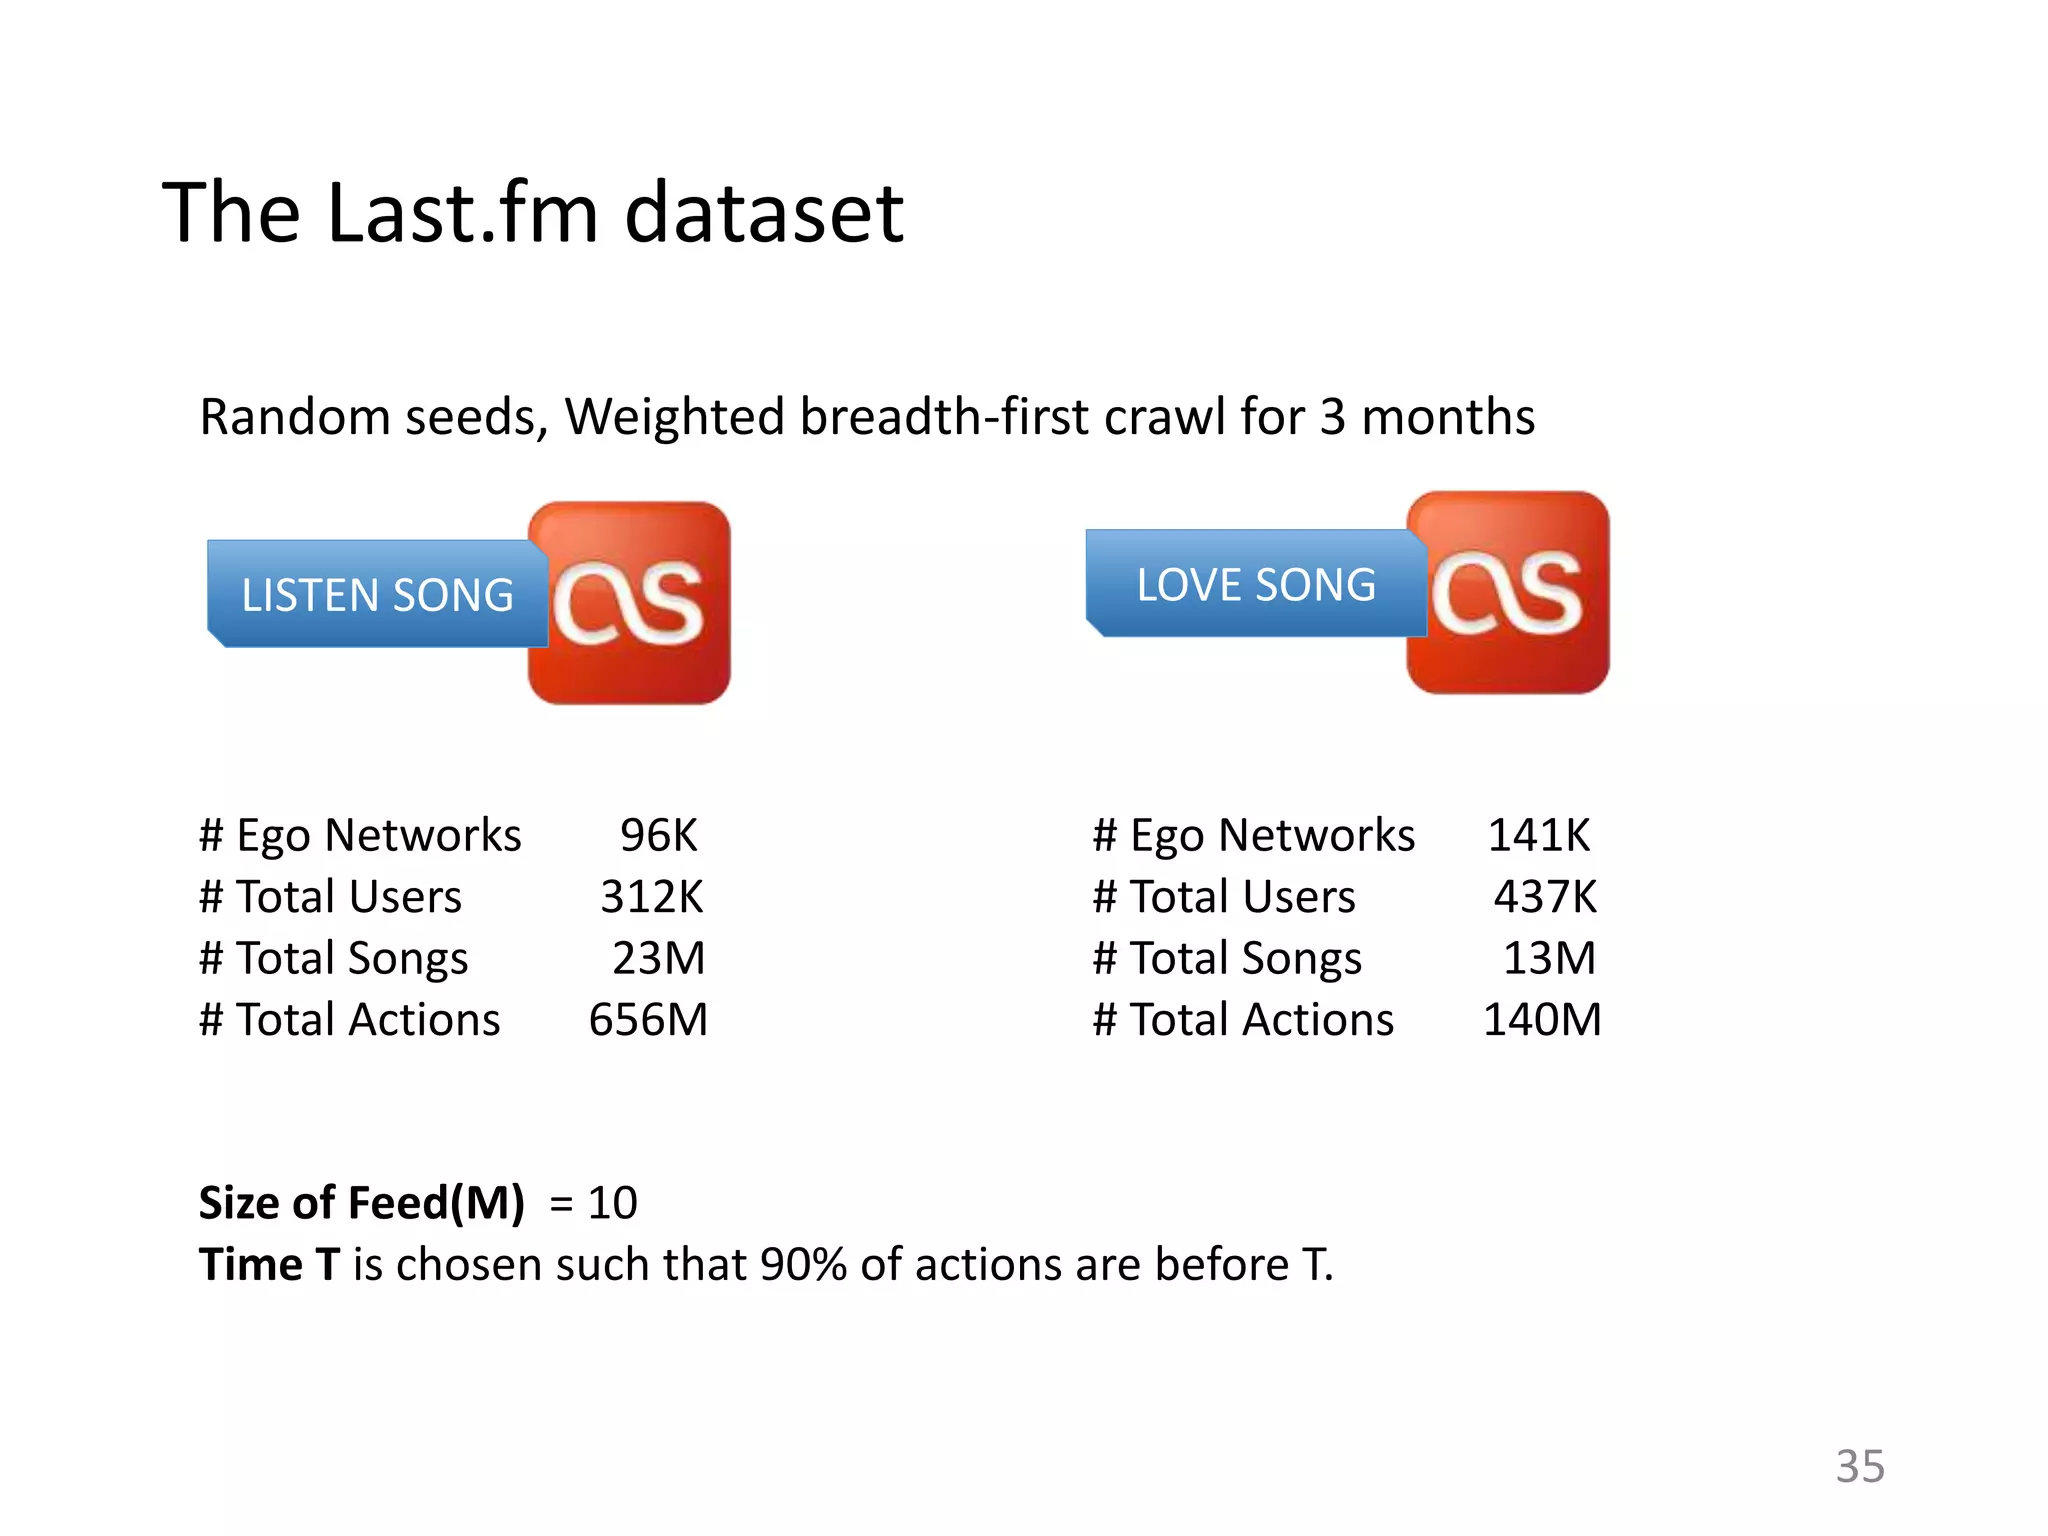
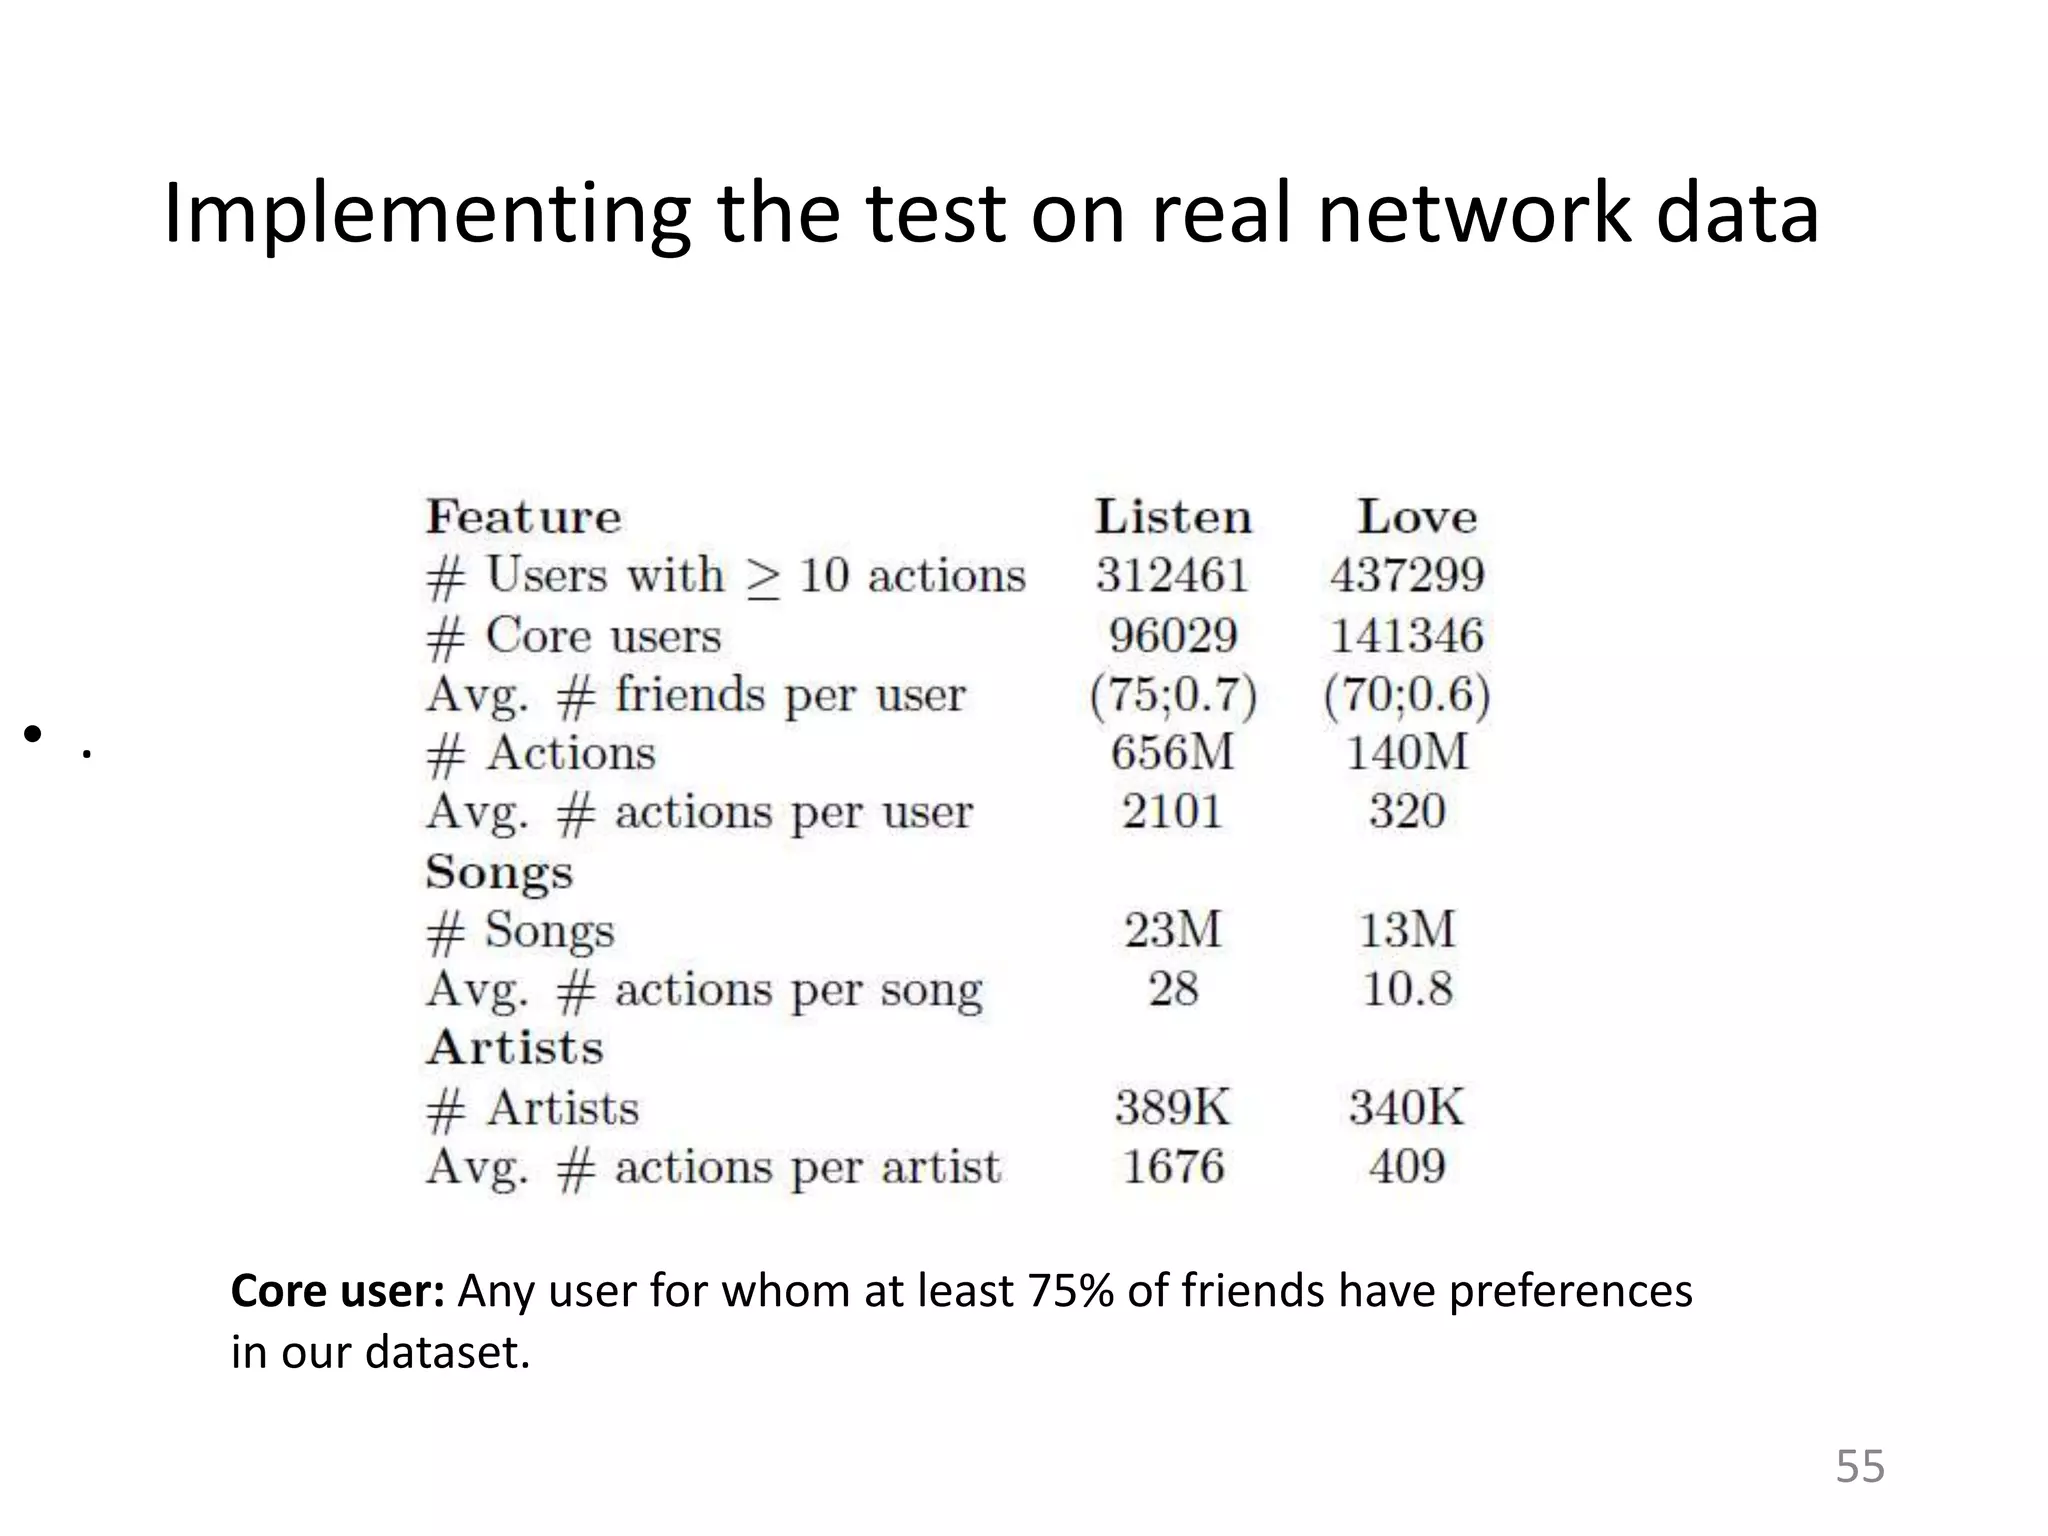
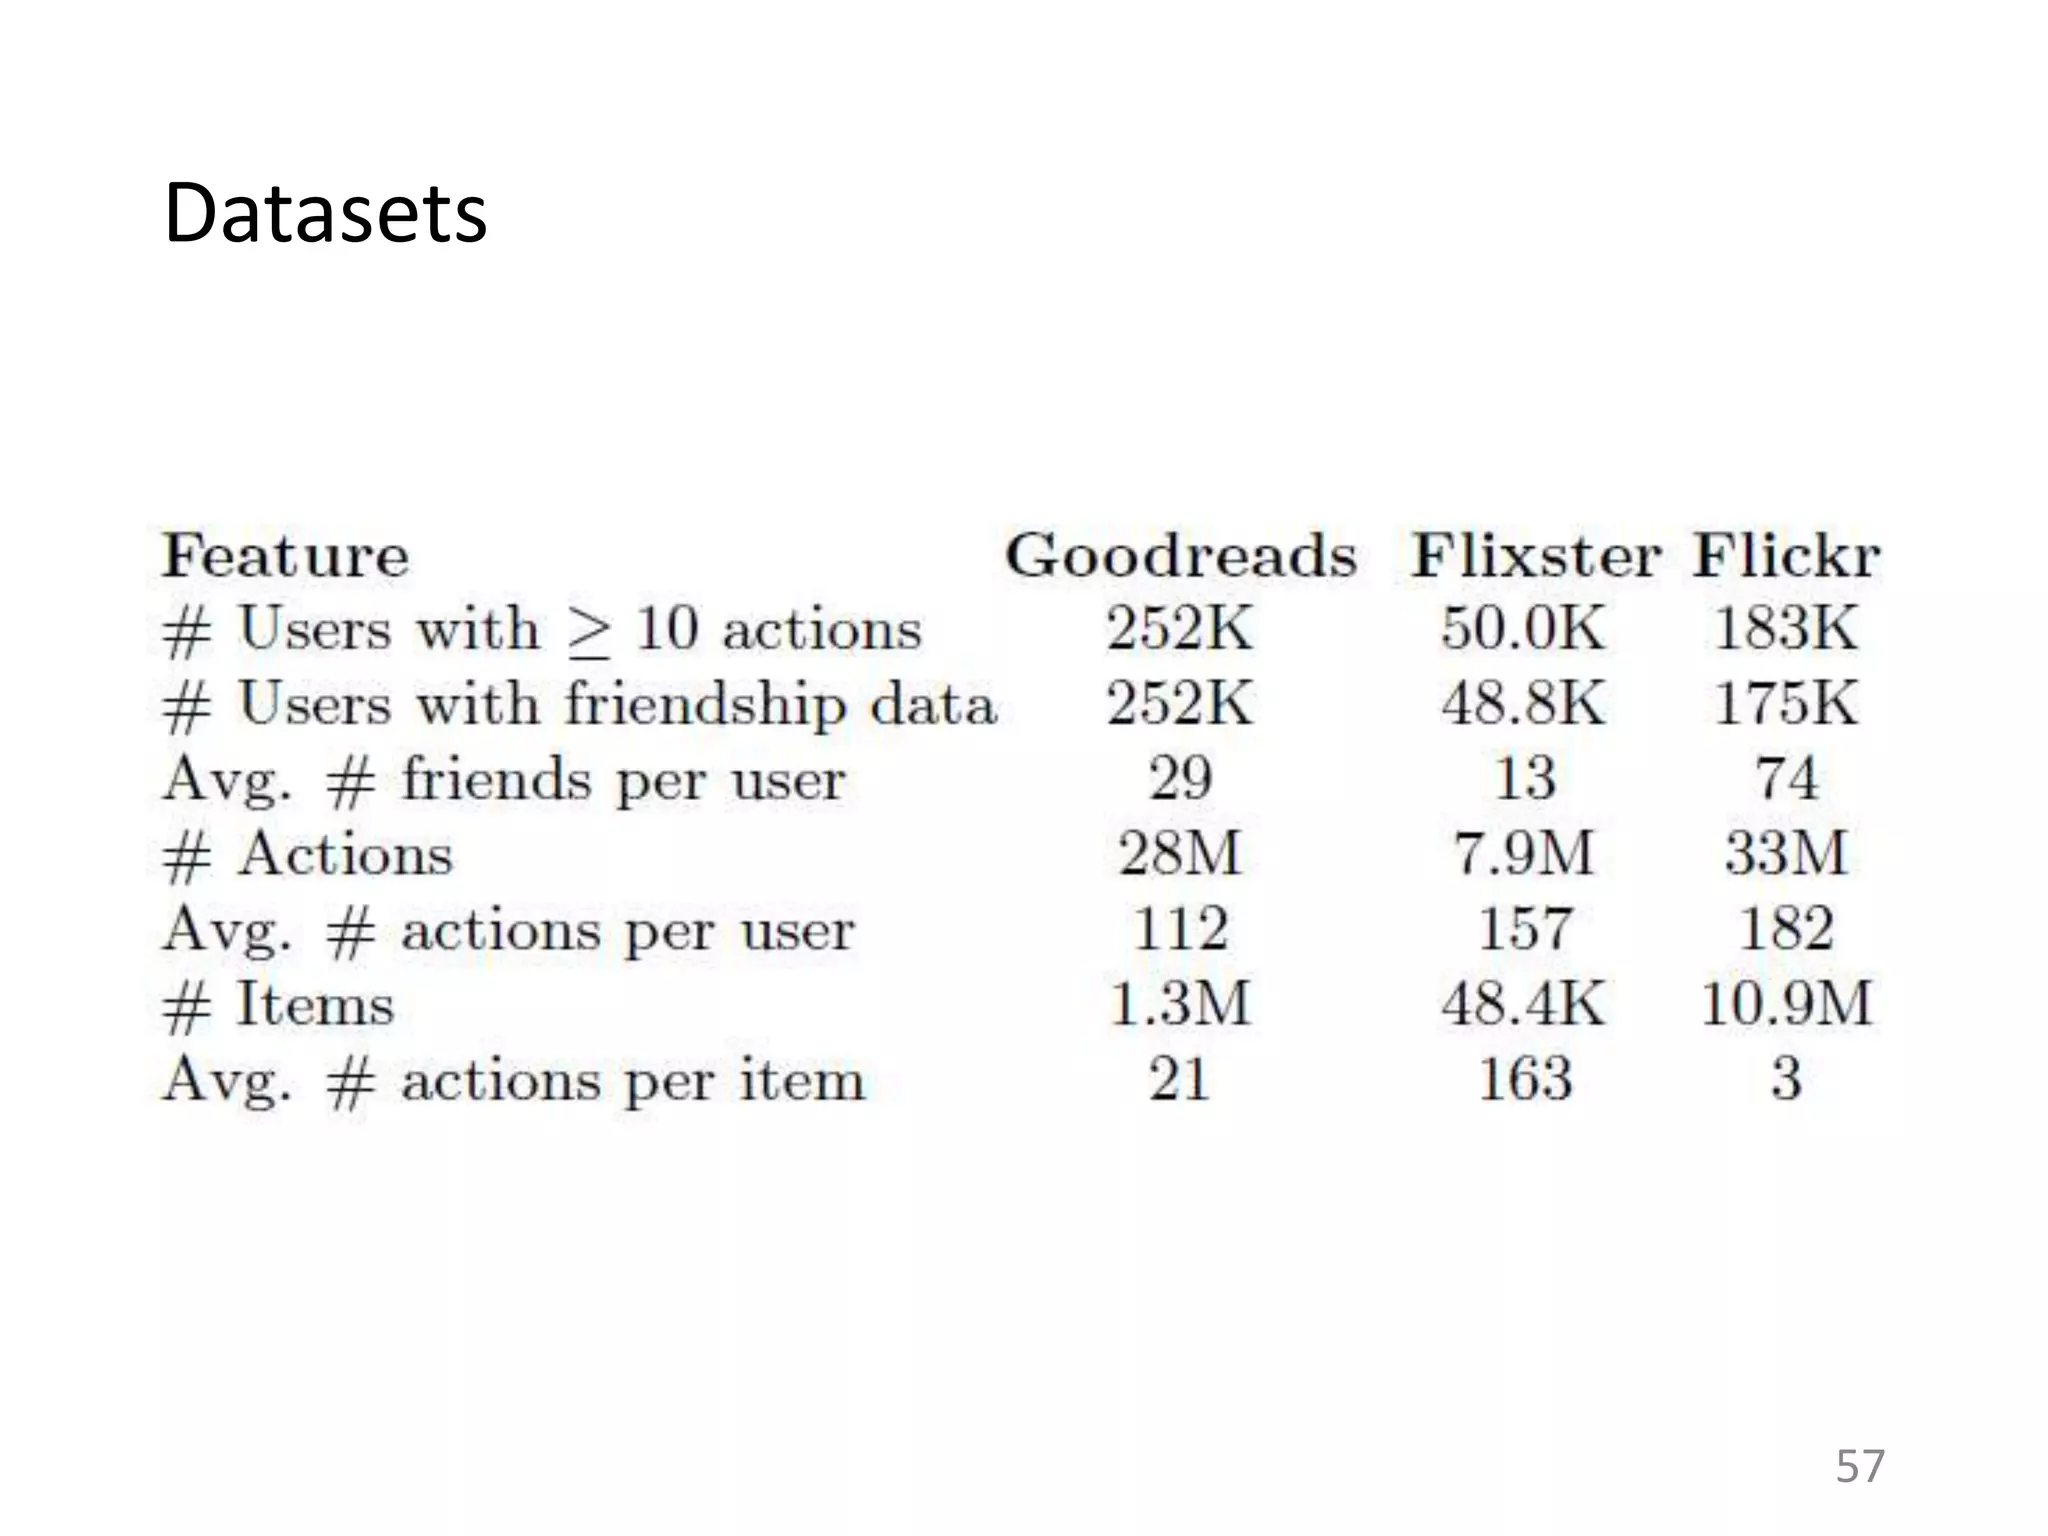
![Is this specific to Last.fm?
38
Assumptions of Influence Estimation:
Reverse chronological feed
Preferences as a proxy for homophily
Can be applied to any sharing platform that shows friends’ activities in a
(loosely) reverse chronological order.
RATE BOOKS
FAVORITE
PHOTOS
RATE MOVIES
# Ego Networks 252K
# Total Users 252K
# Total Items 1.3M
# Total Actions 28M
# Ego Networks 49K
# Total Users 50K
# Total Items 48K
# Total Actions 7.9M
# Ego Networks 175K
# Total Users 183K
# Total Items 11M
# Total Actions 33M
[Huang et al. ‘12] [Jamali and Ester ‘10] [Cha et al. ‘09]](https://image.slidesharecdn.com/b-examcornell-150610152114-lva1-app6891/75/The-interplay-of-personal-preference-and-social-influence-in-sharing-networks-Ph-D-defense-talk-38-2048.jpg)
![Directed sharing: More altruism?
• Meformers versus informers: ~80% of content shared on
Twitter was about the user [Naaman et al. 2008]
• In directed sharing, there is a known recipient
– Expect altruism to be more important
45](https://image.slidesharecdn.com/b-examcornell-150610152114-lva1-app6891/75/The-interplay-of-personal-preference-and-social-influence-in-sharing-networks-Ph-D-defense-talk-45-2048.jpg)
![Design implications
Recommender systems for effective sharing
• Recommending what to share, who to share it to.
E.g., Feedme system [Bernstein et al. 2010]
Diffusion models with directed sharing
• Accounting for sender and recipient preferences
46](https://image.slidesharecdn.com/b-examcornell-150610152114-lva1-app6891/75/The-interplay-of-personal-preference-and-social-influence-in-sharing-networks-Ph-D-defense-talk-46-2048.jpg)
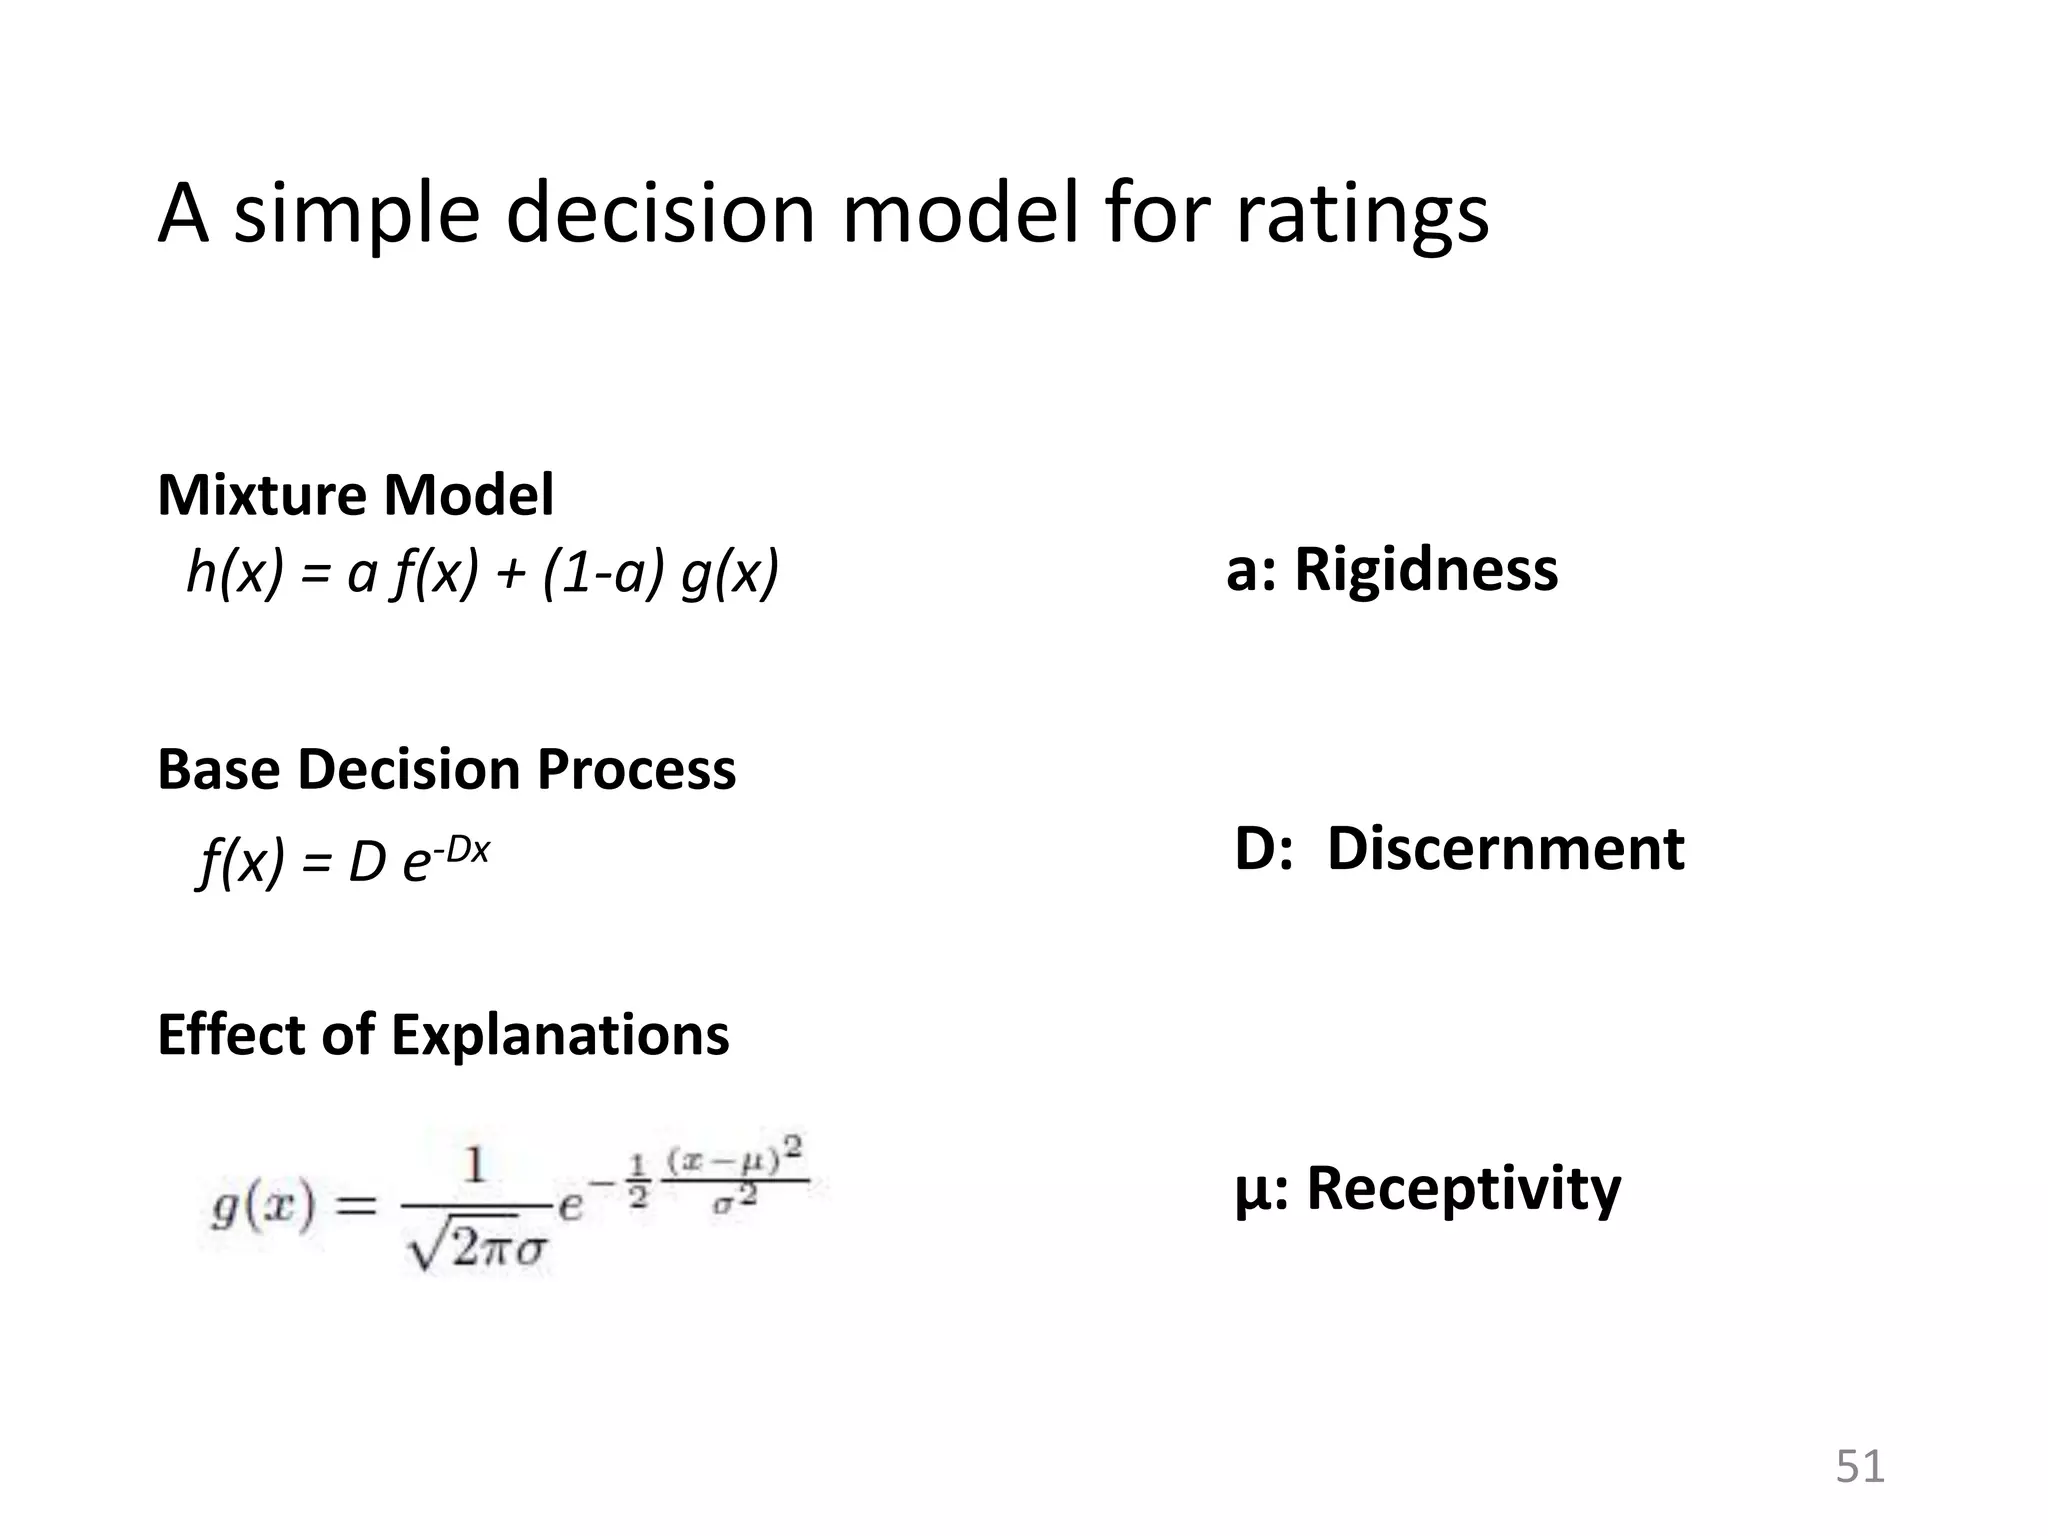
![A simple decision model for ratings
User's receptiveness to
an explanation.
[Effect of Explanation]
User's discernment in music.
[Base Decision Process]
Coldplay
+
Amit Sharma likes
this.
50](https://image.slidesharecdn.com/b-examcornell-150610152114-lva1-app6891/75/The-interplay-of-personal-preference-and-social-influence-in-sharing-networks-Ph-D-defense-talk-50-2048.jpg)

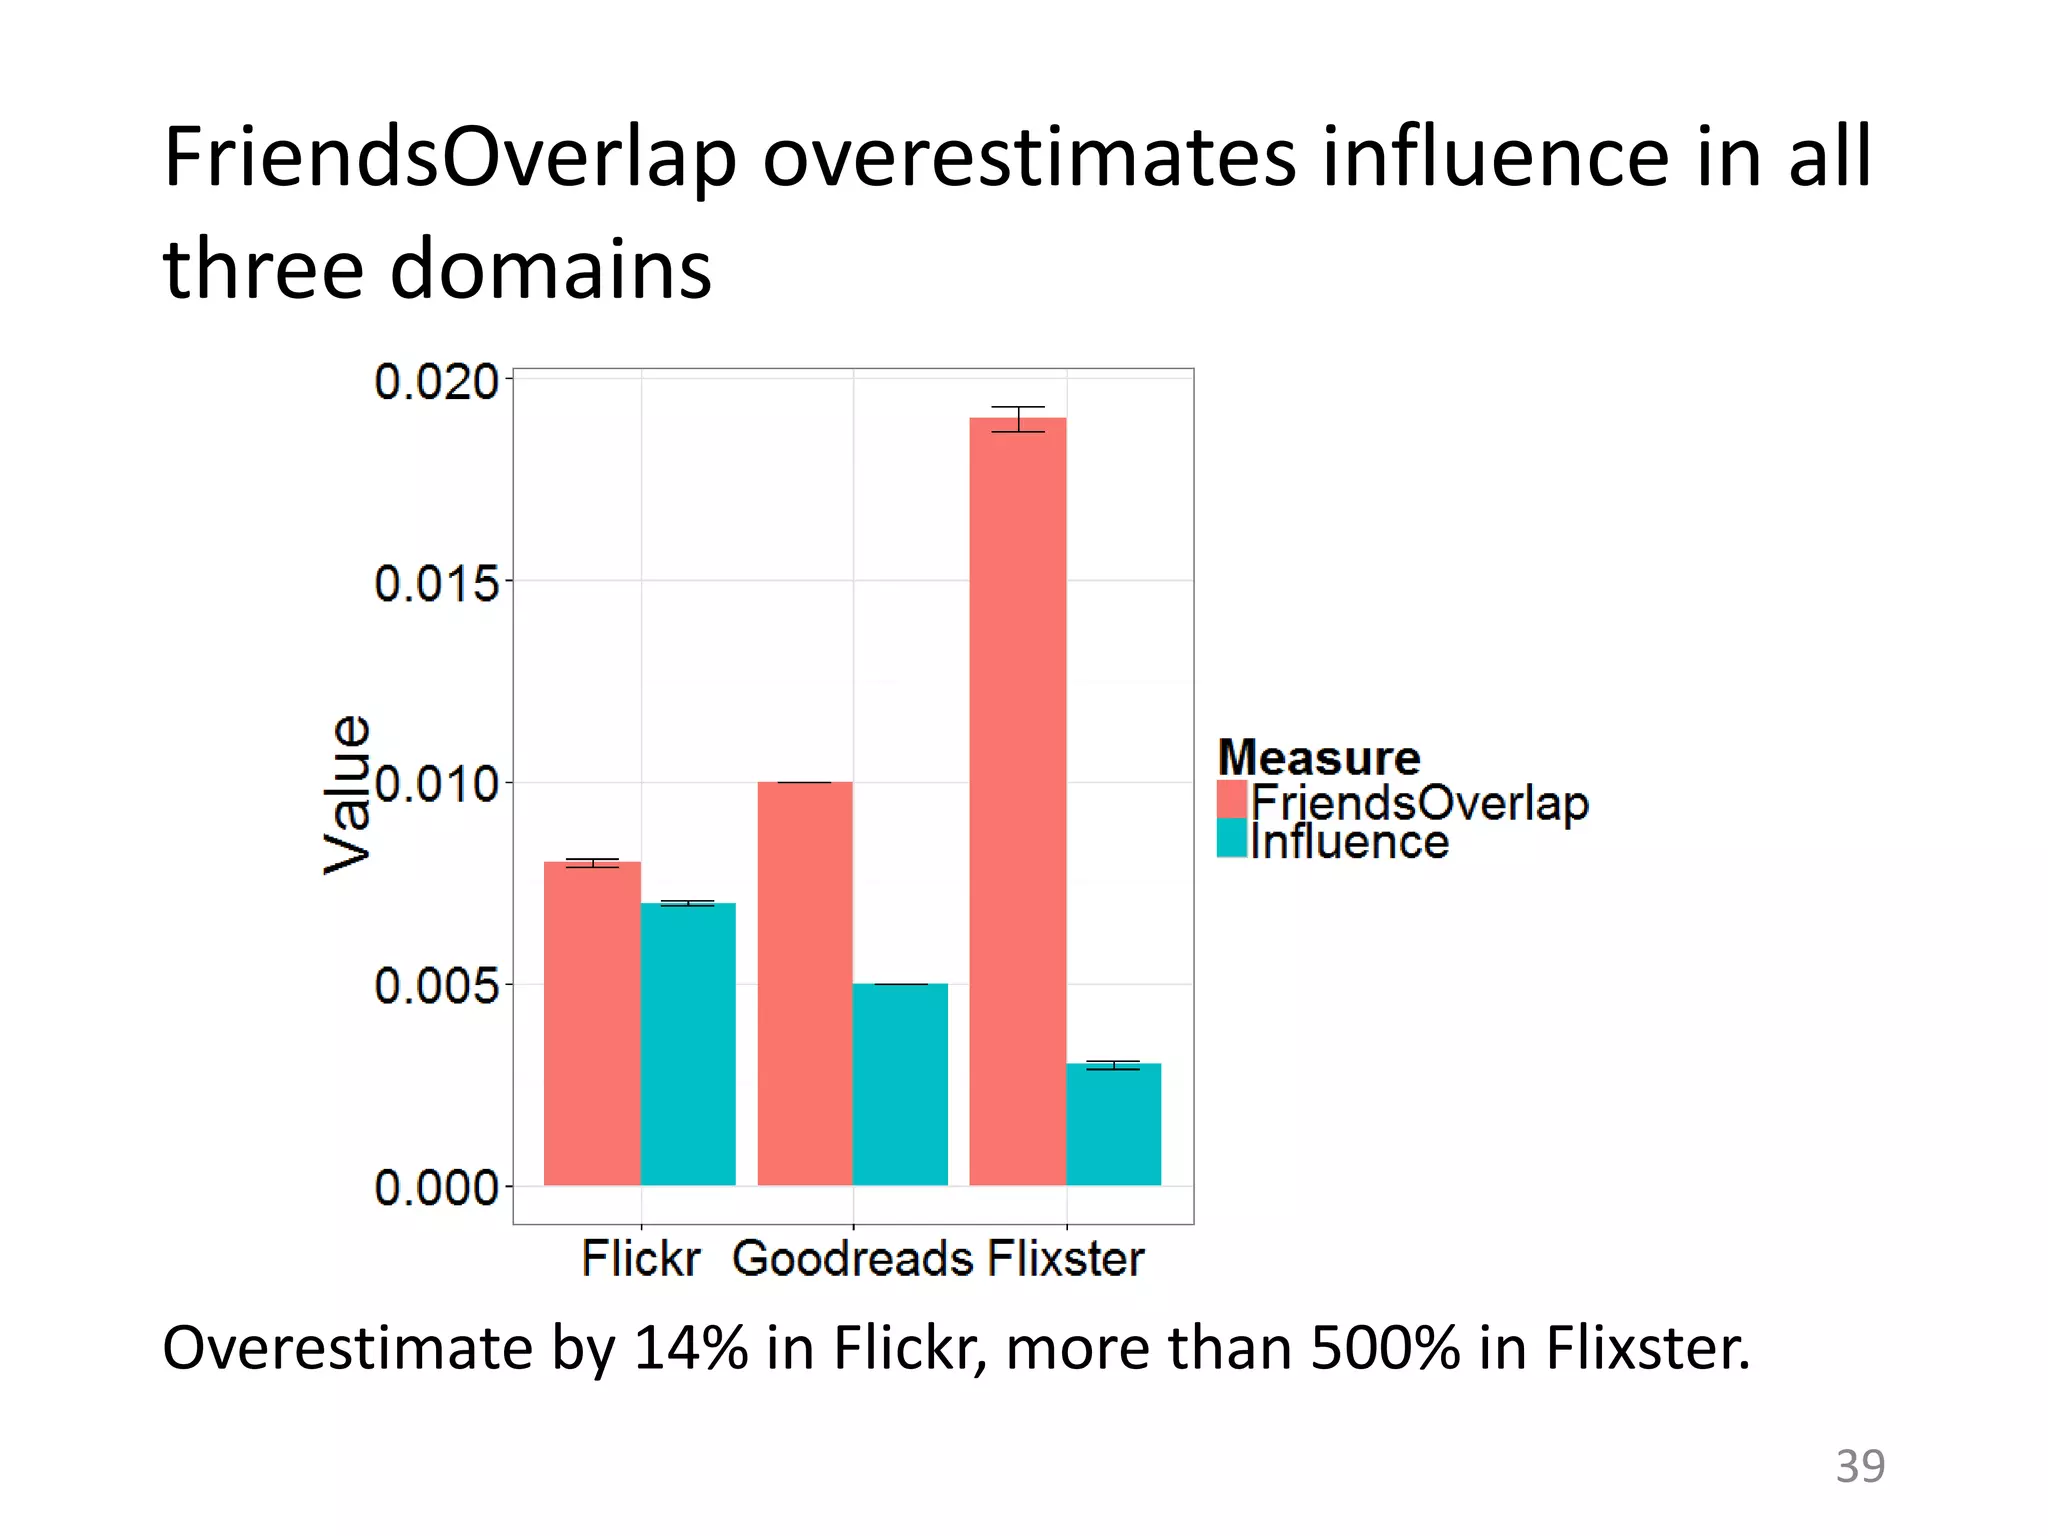
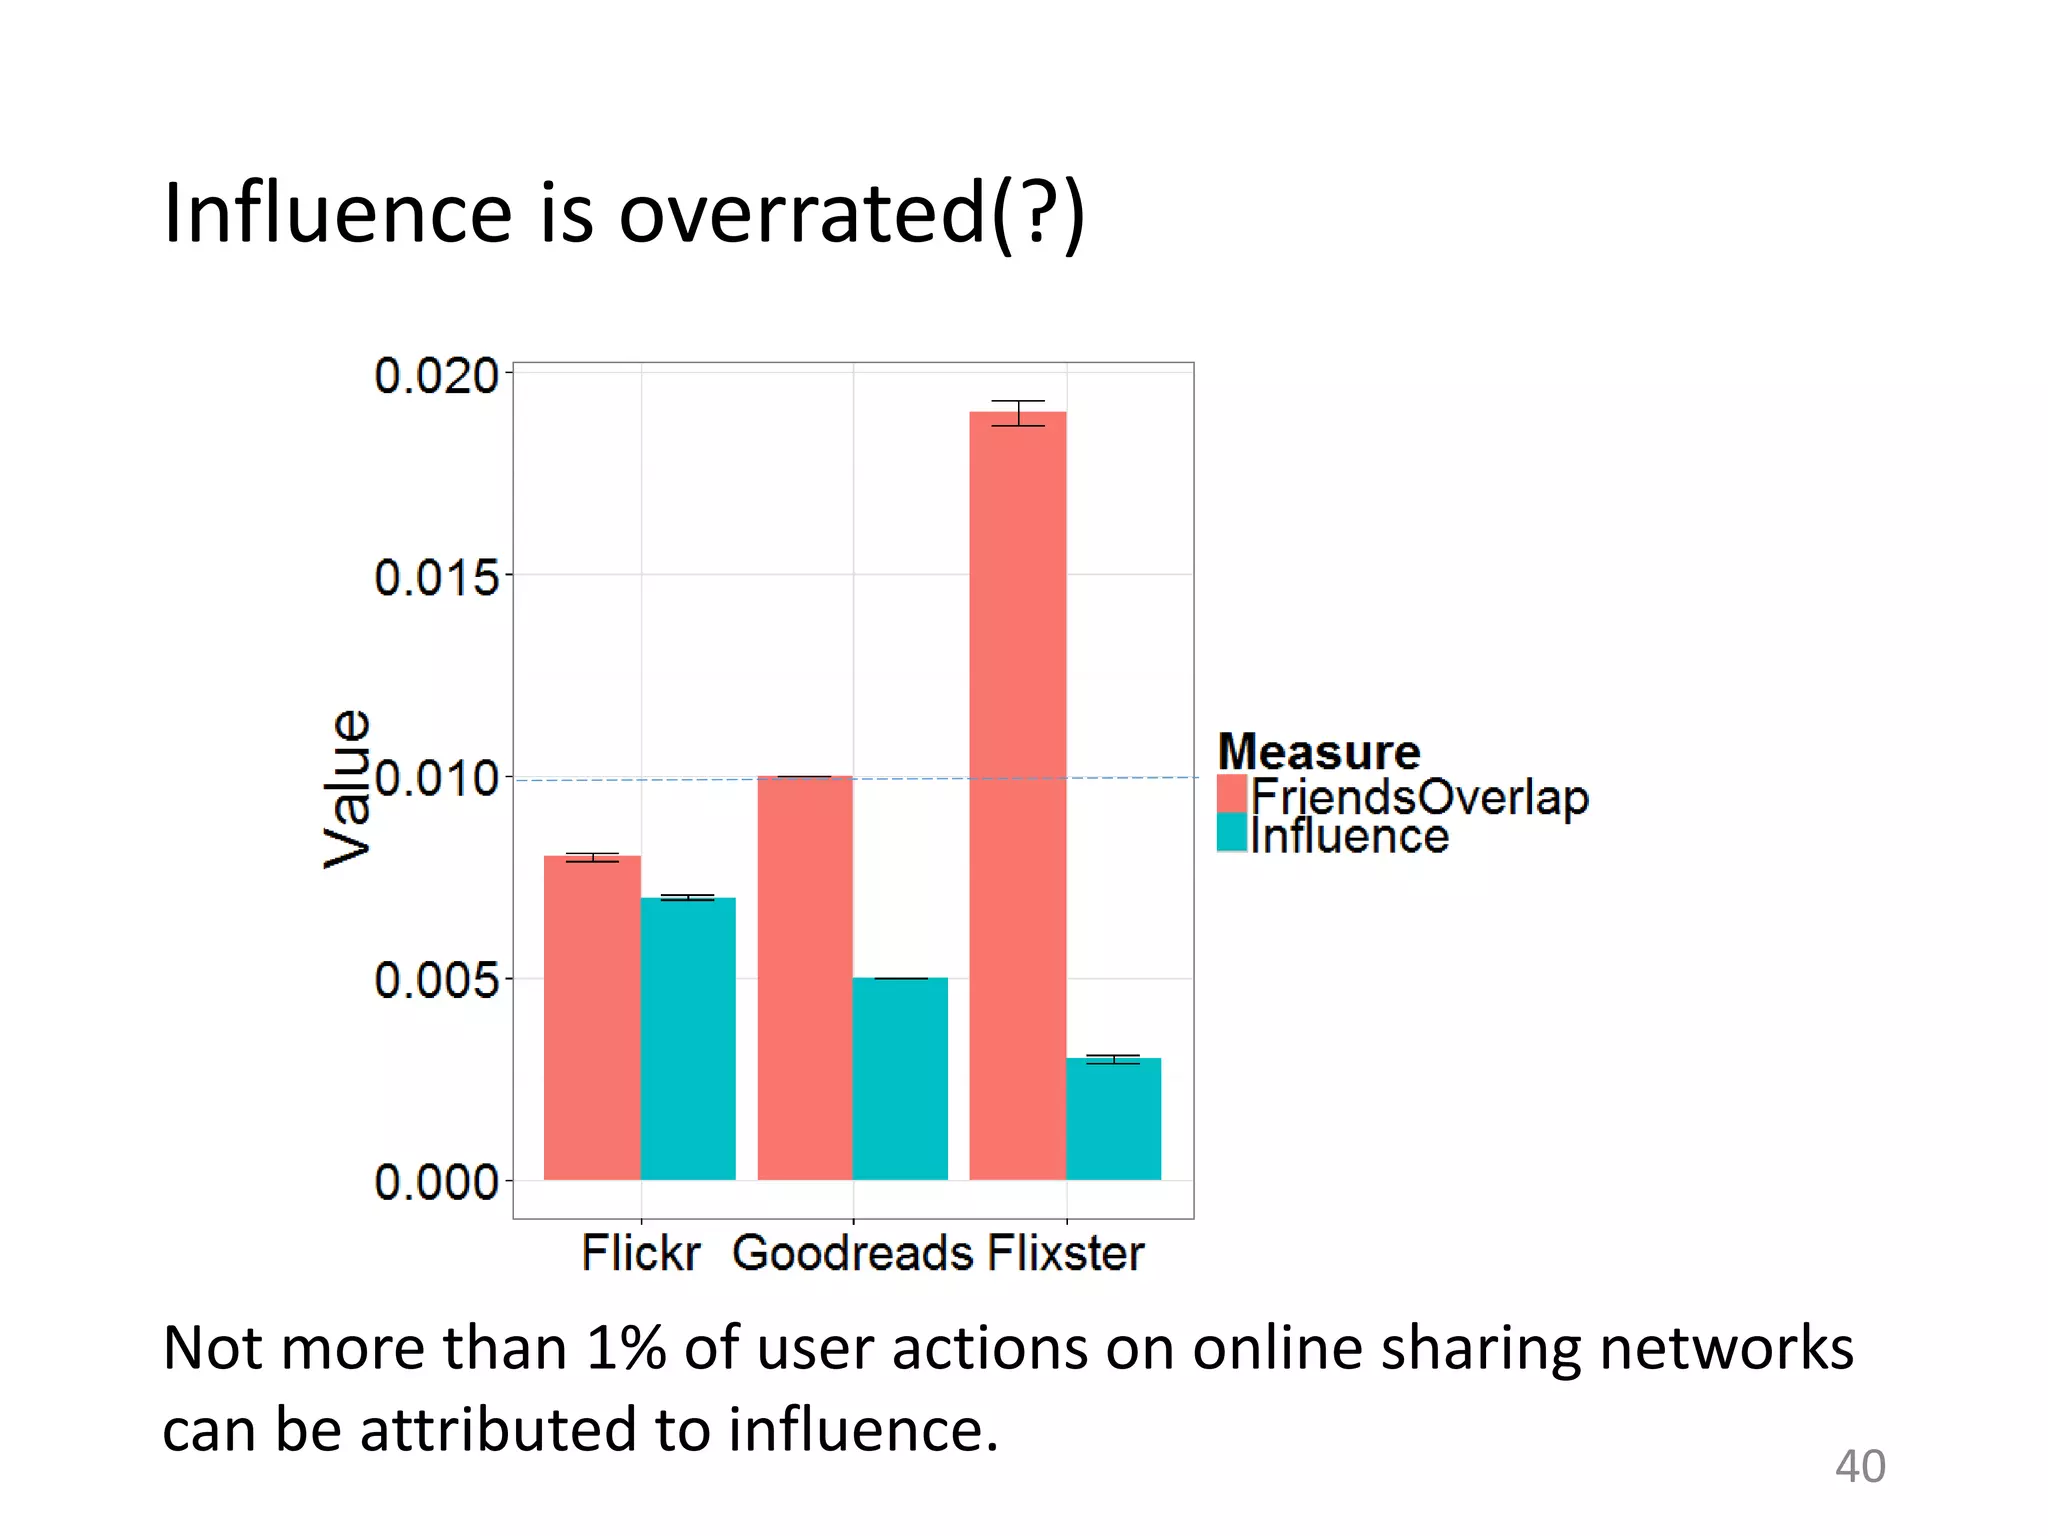
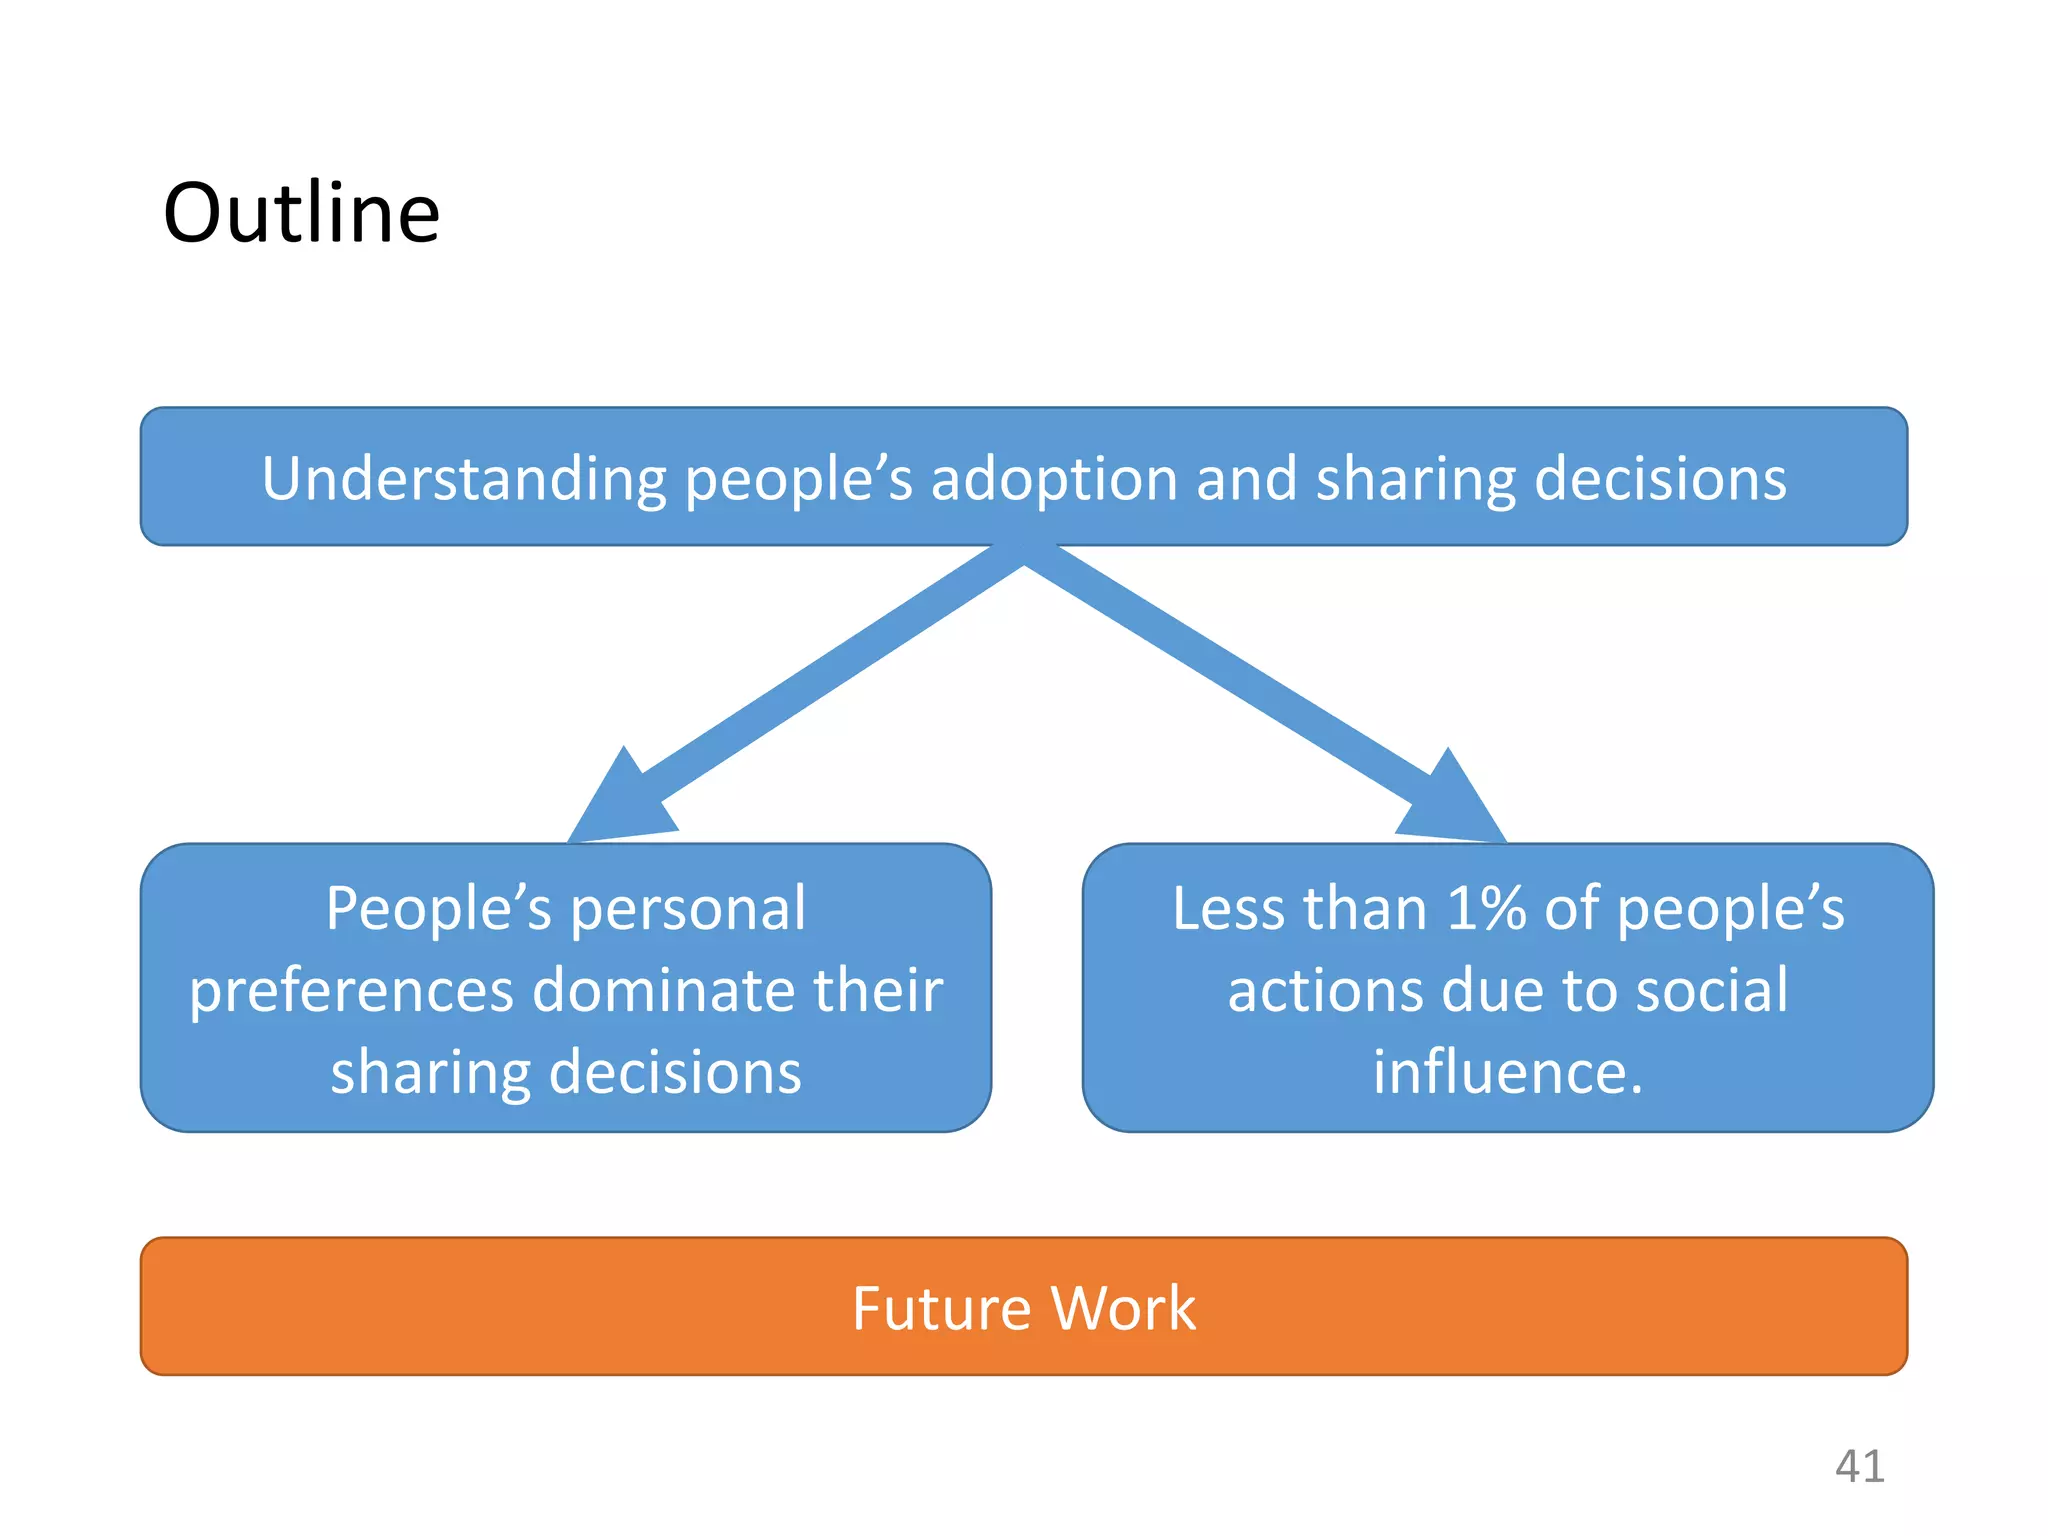
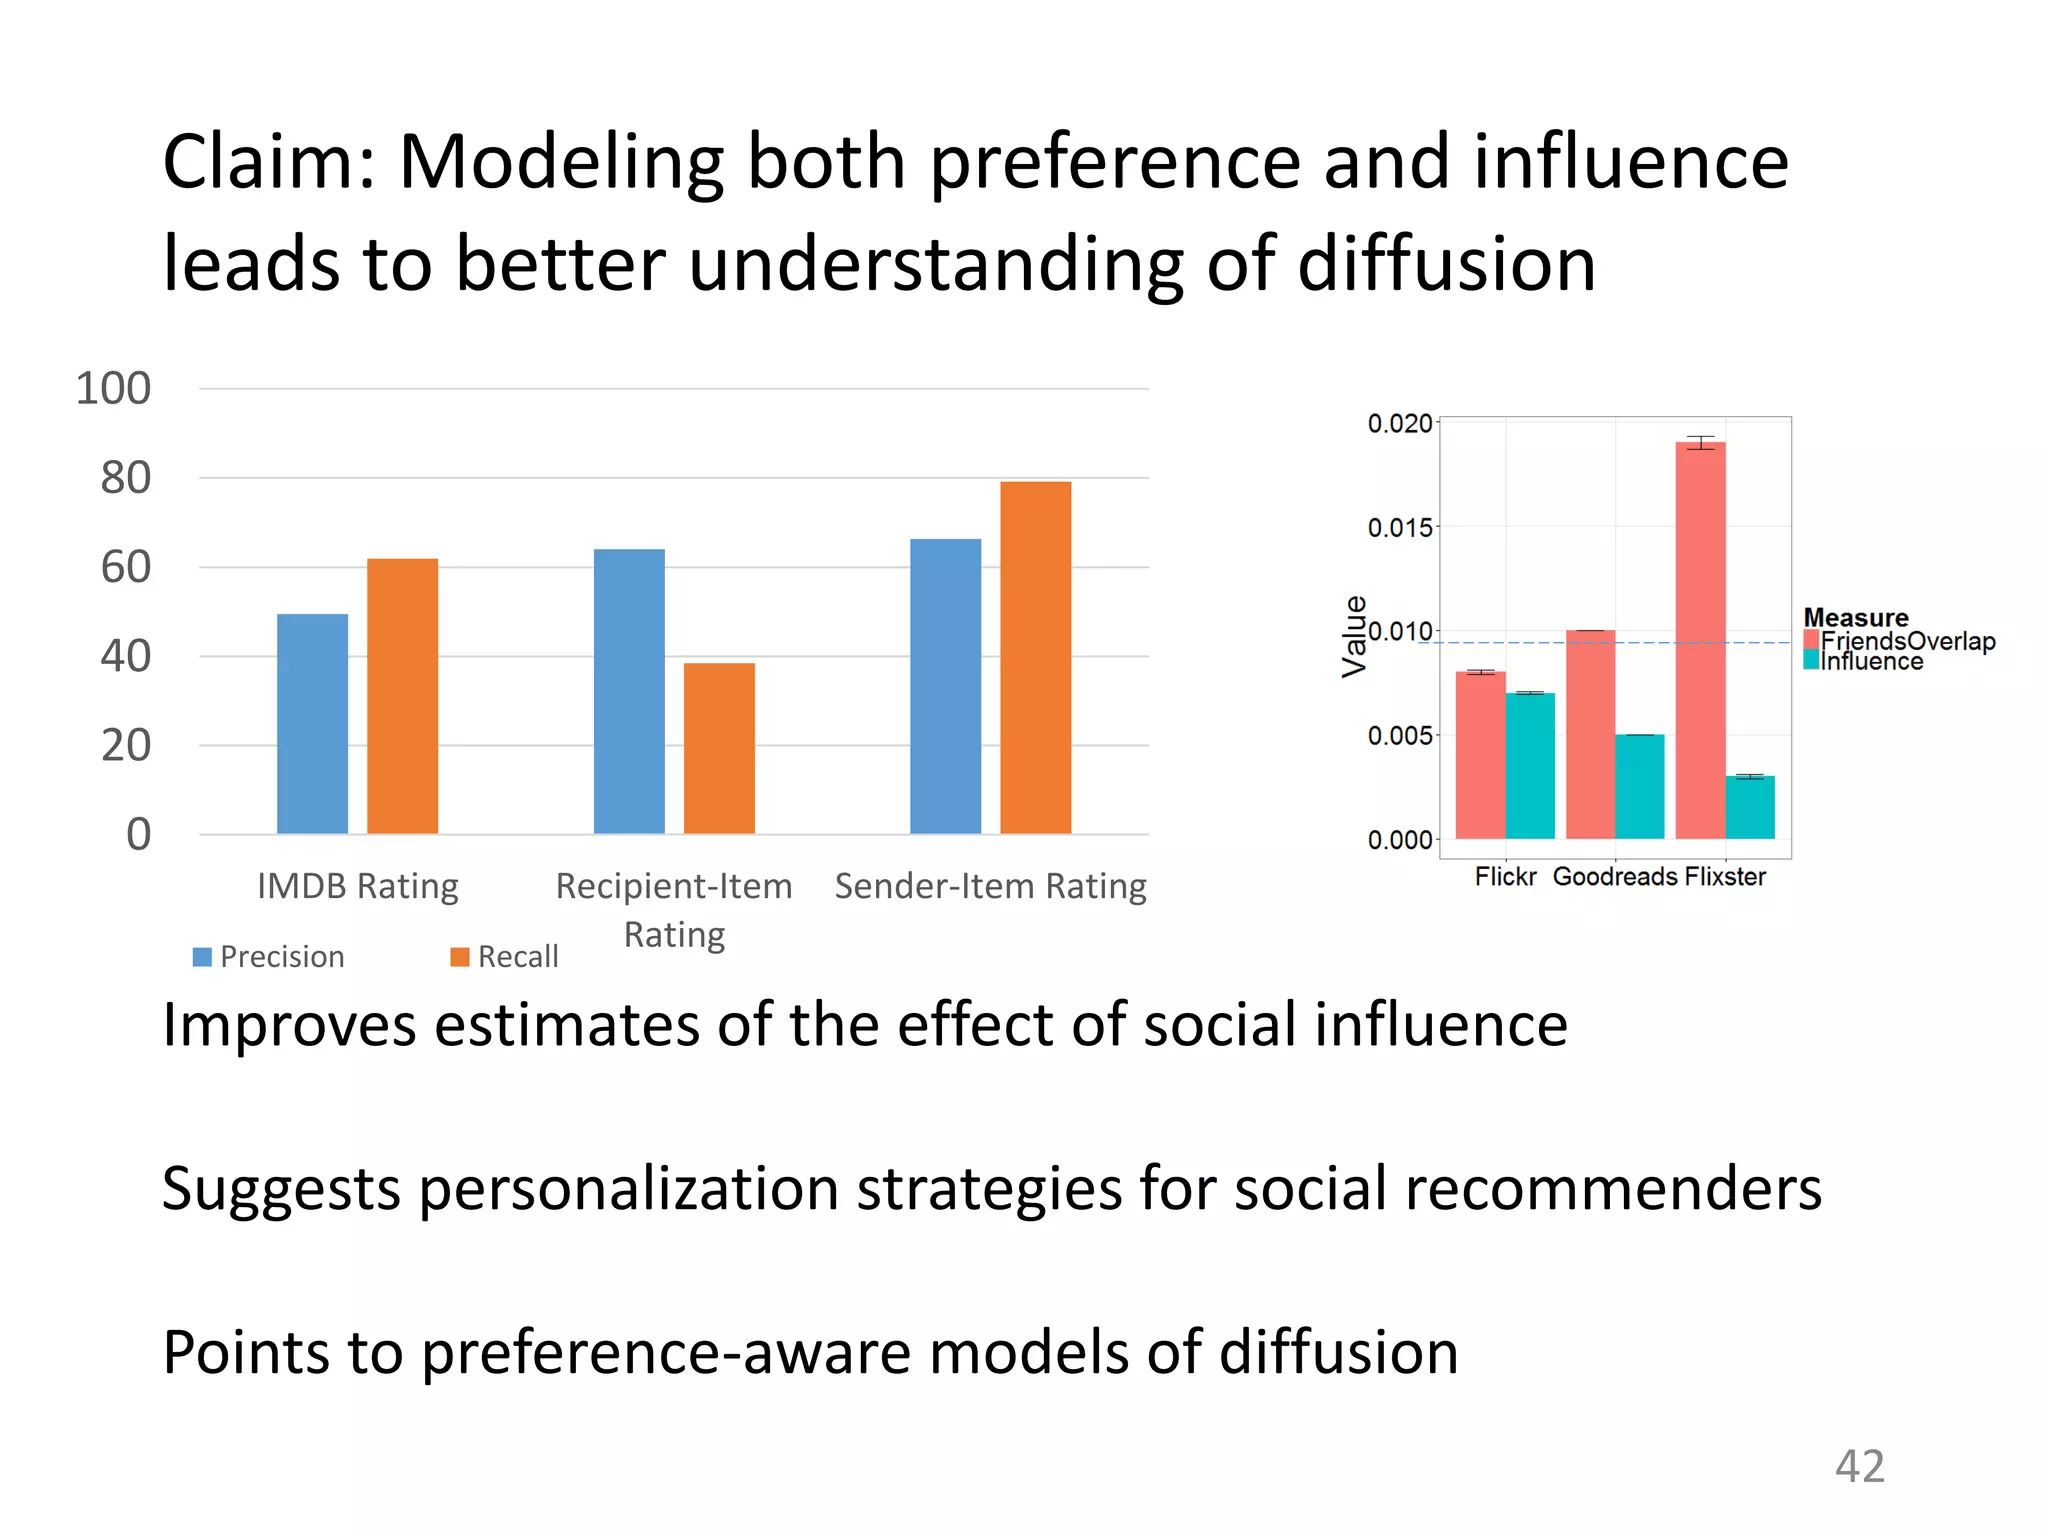
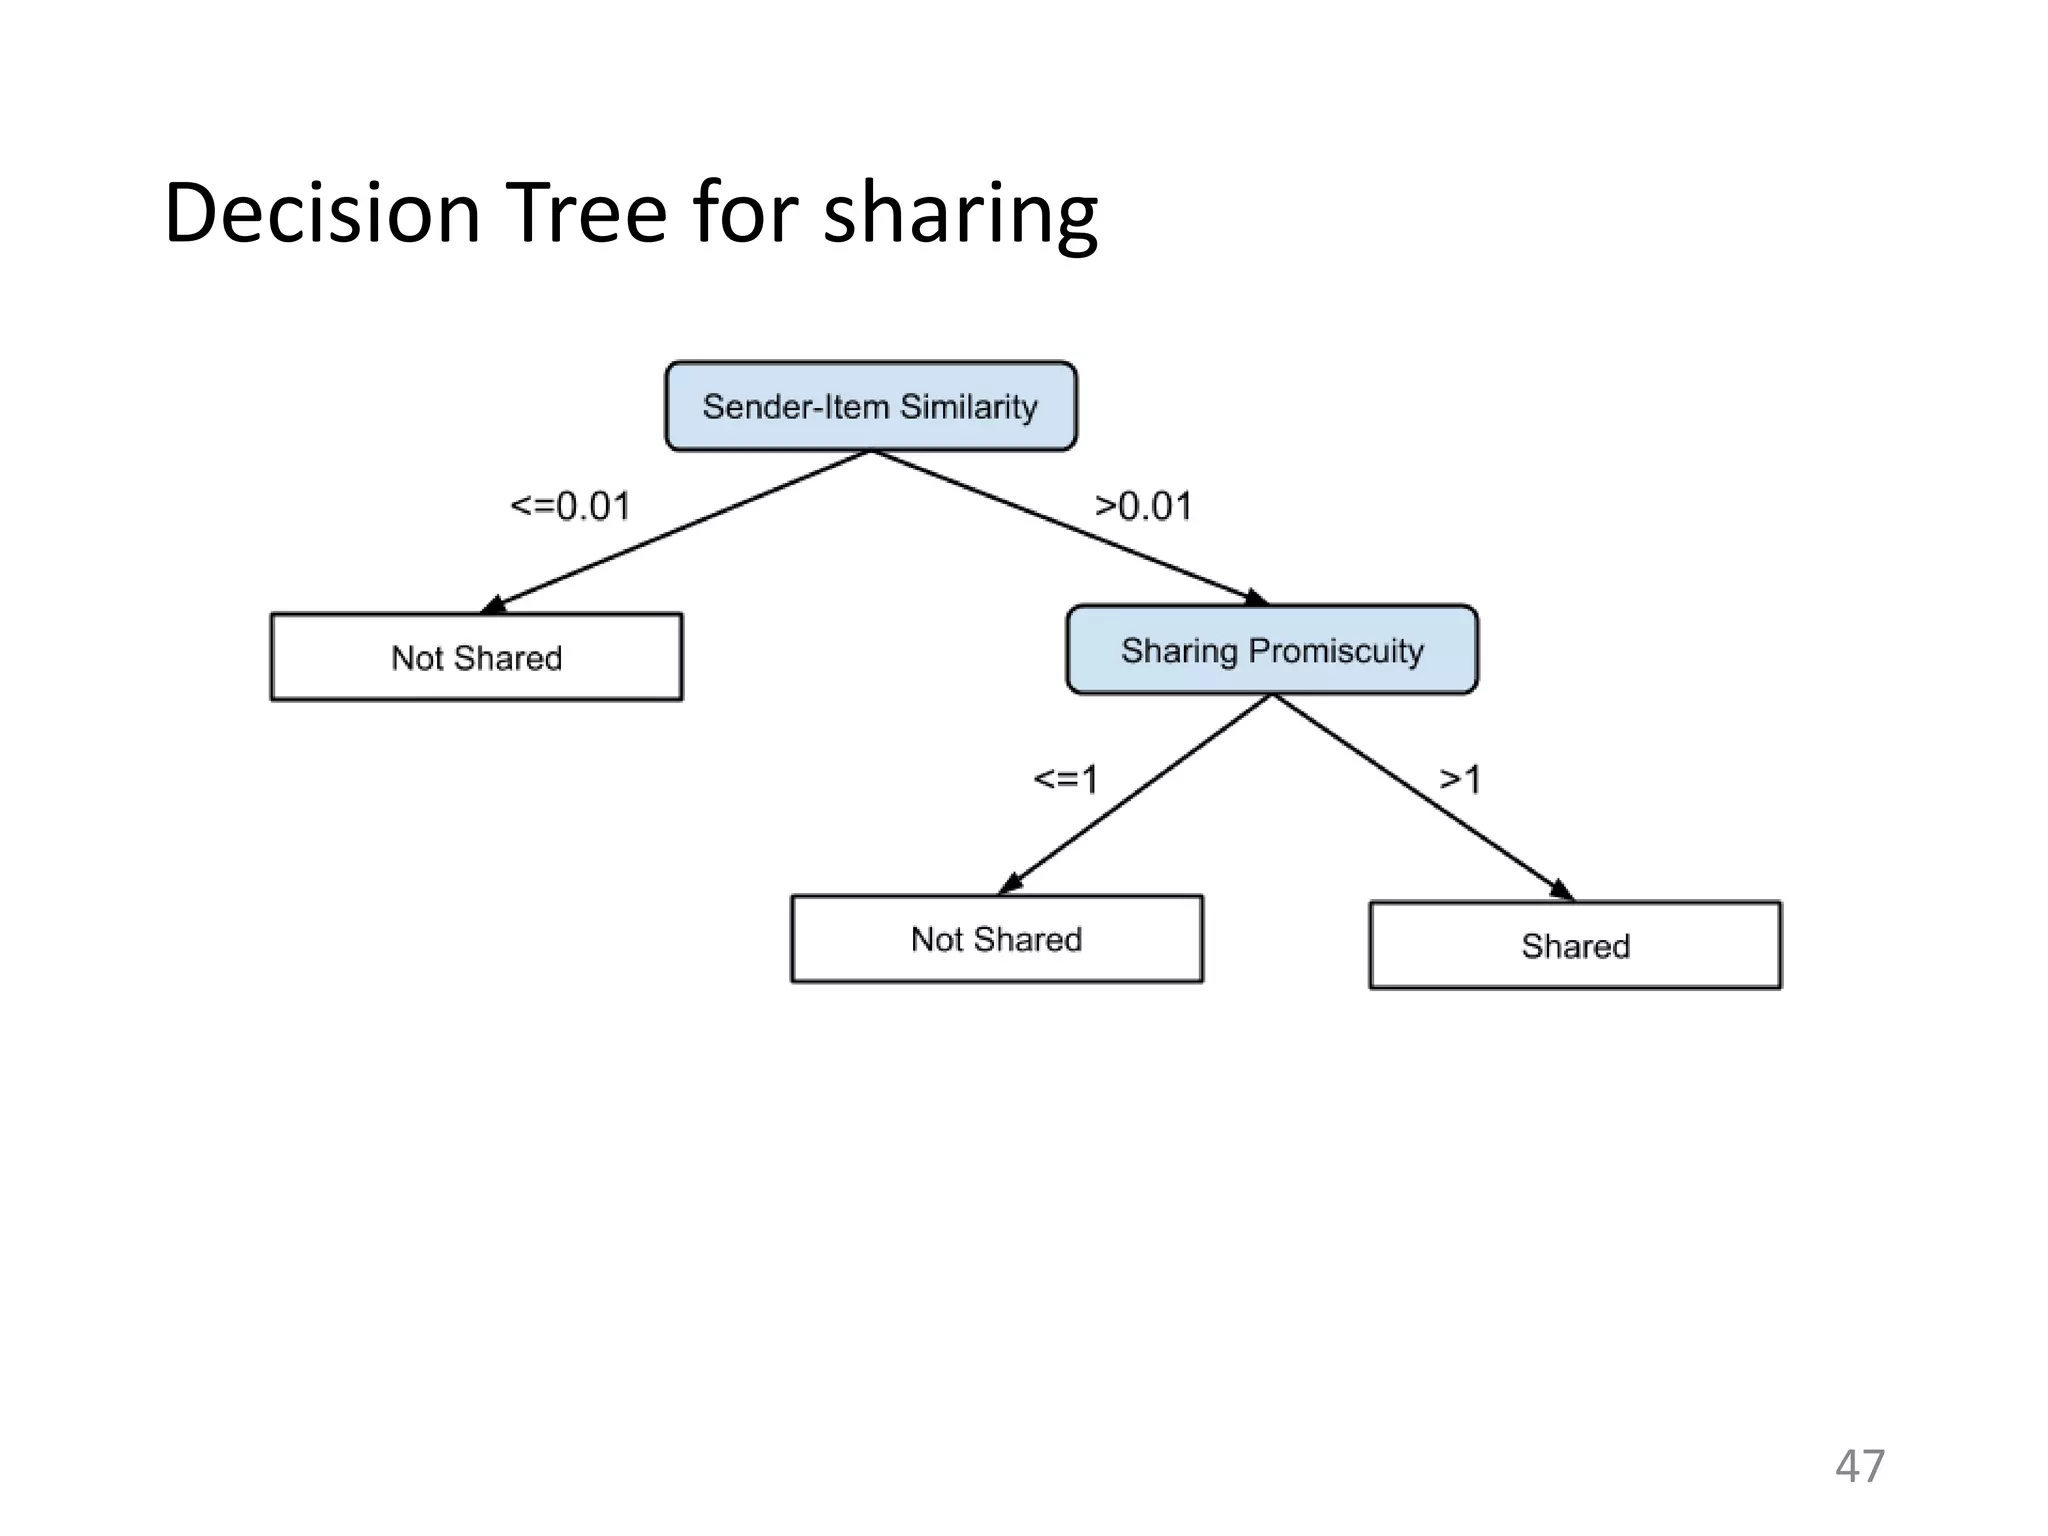
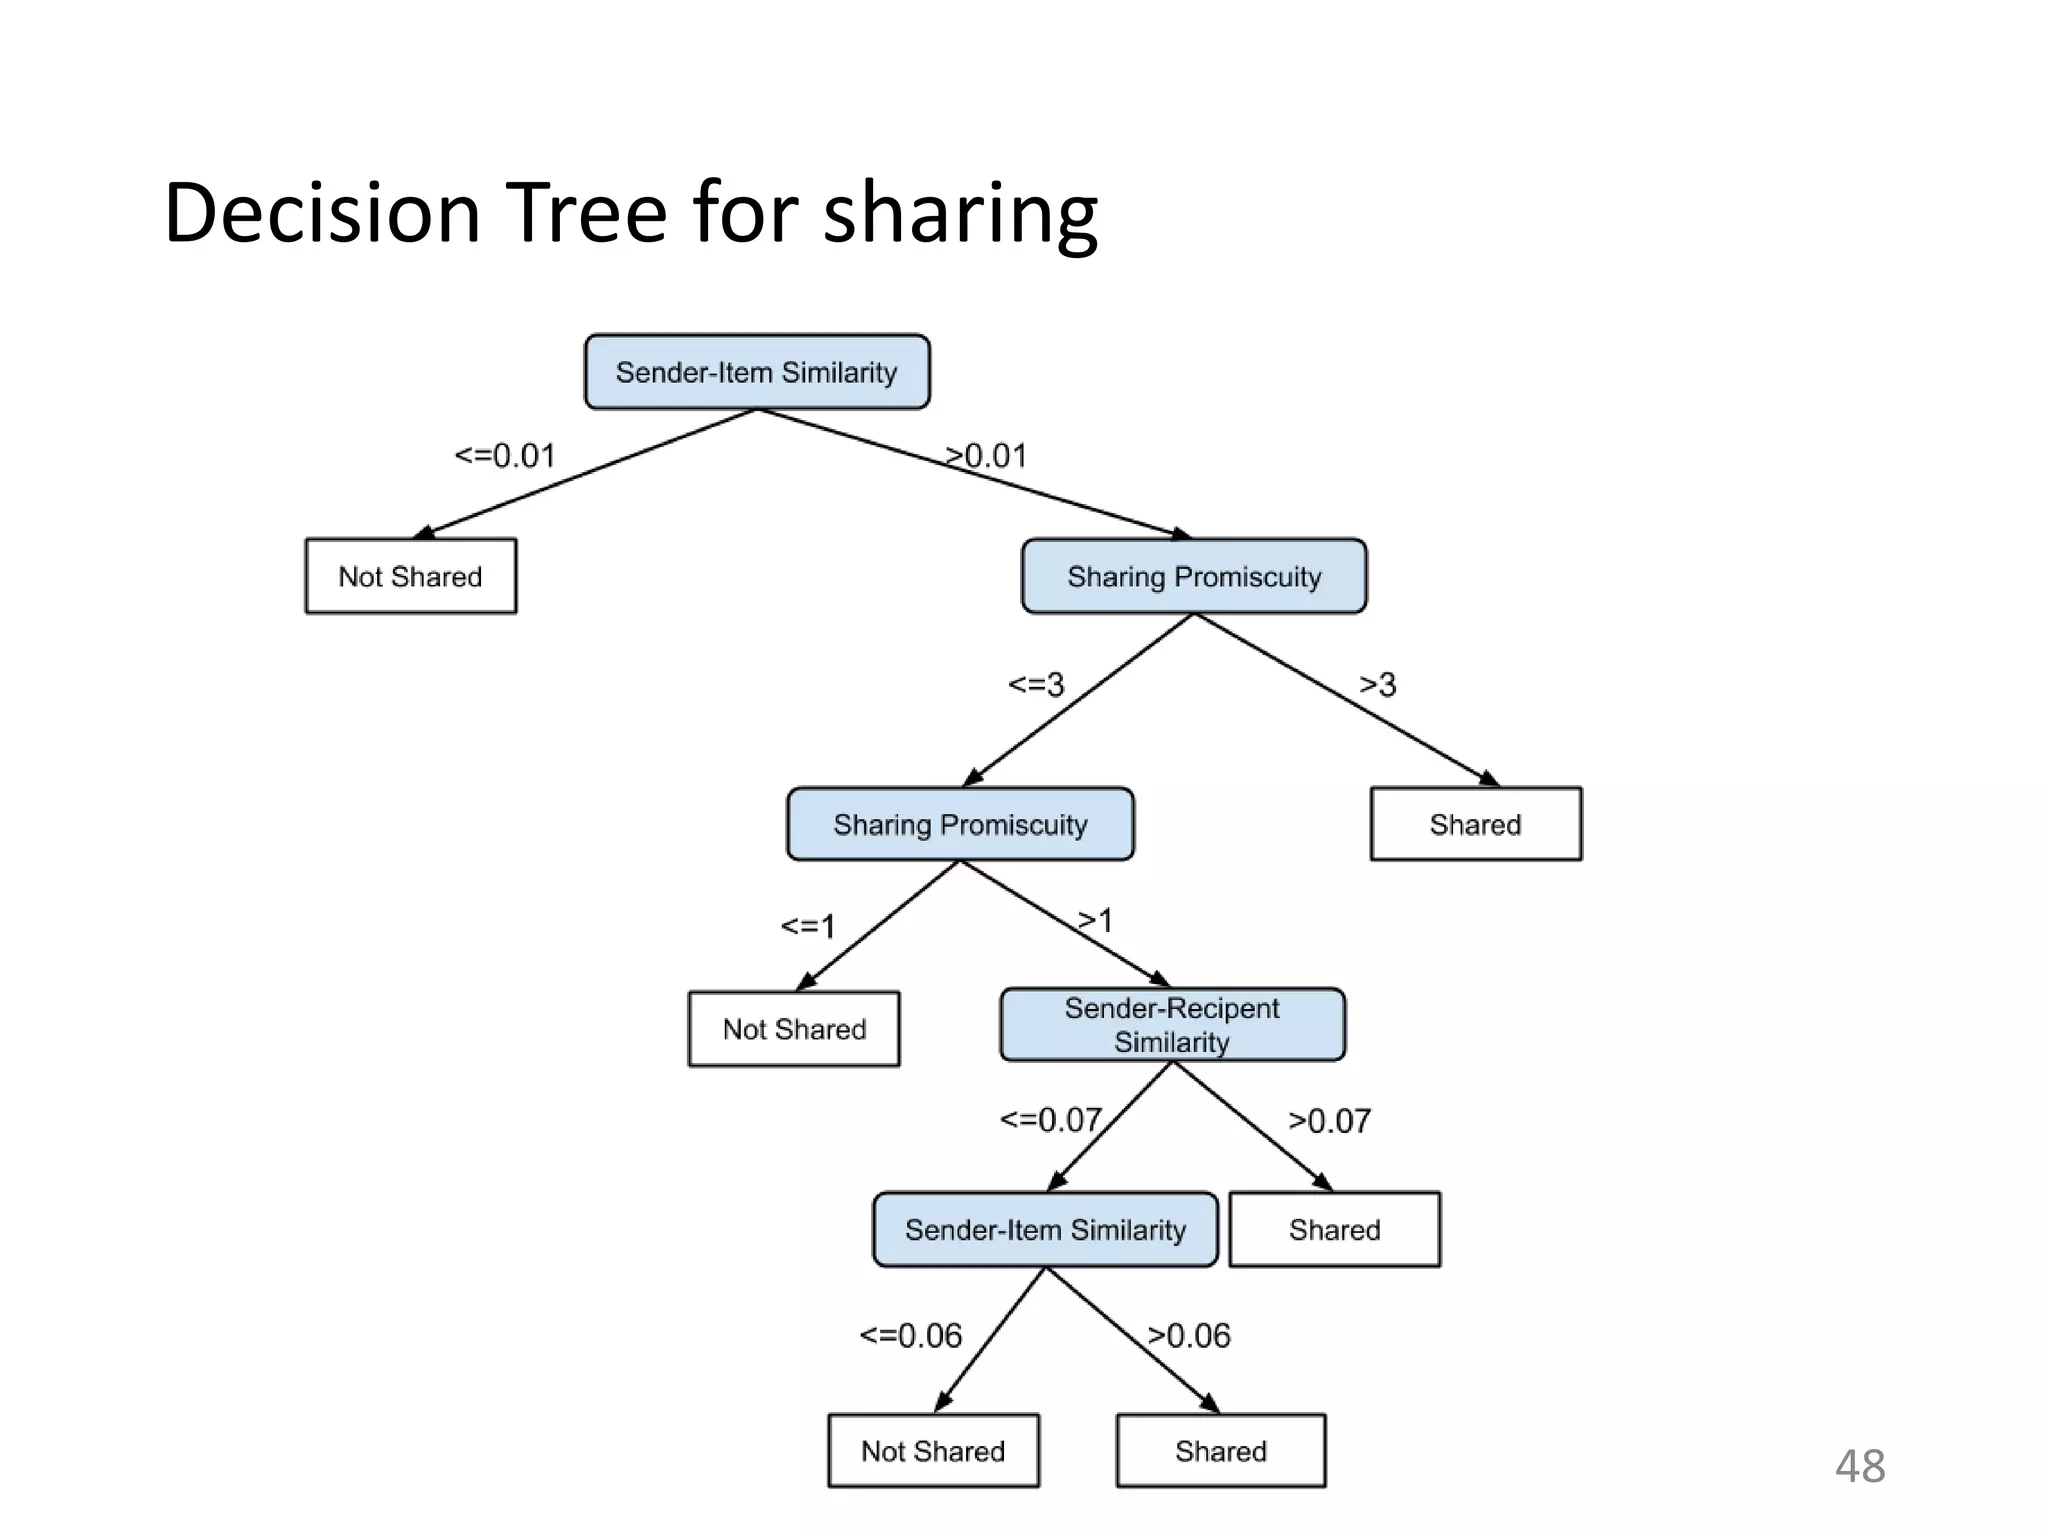
The document summarizes research on understanding how personal preferences and social influence affect sharing behaviors on social networks. It presents three key findings: 1) Personal preferences dominate individuals' decisions about what content to share, with people more likely to share items they themselves like. 2) Less than 1% of peoples' actions can typically be attributed to social influence from friends, with influence being overestimated in prior work. 3) Modeling both personal preferences and social influence may lead to a better understanding of how content spreads on networks and help improve recommendation systems and diffusion models.


![[RecSys '13]Pairwise Learning: Experiments with Community Recommendation on L...](https://cdn.slidesharecdn.com/ss_thumbnails/recsys2013-pairwiselearning1-131015044836-phpapp02-thumbnail.jpg?width=640&height=640&fit=bounds)


