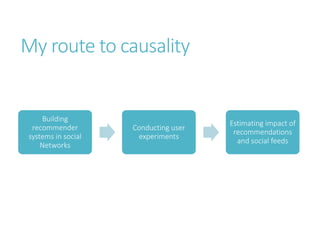
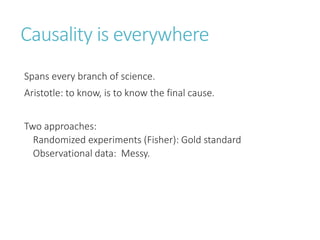
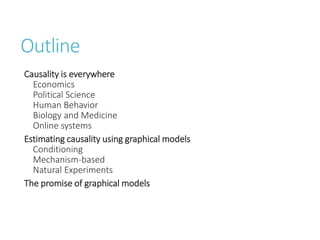
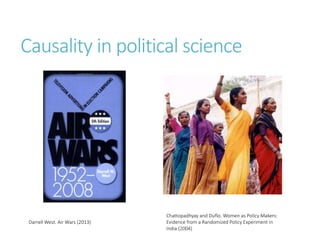
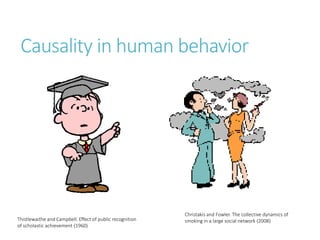
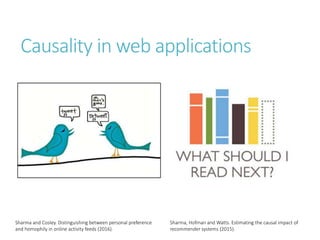
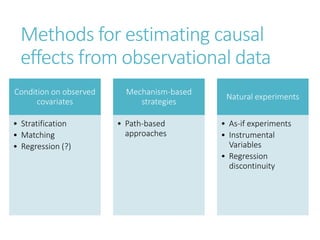
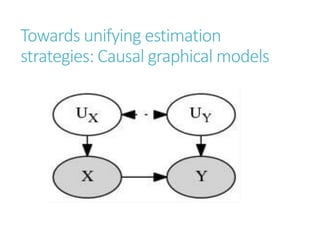
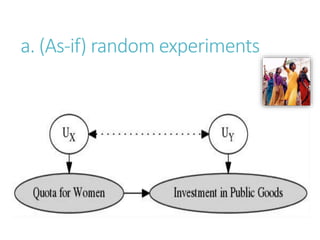
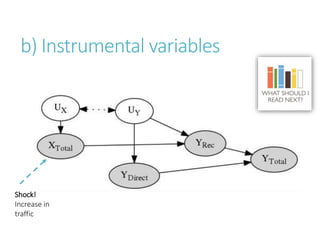
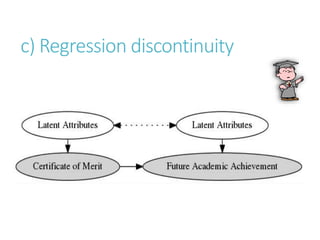
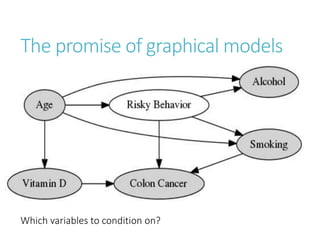
Here, there,
causality is
everywhere
Amit Sharma
Microsoft Research, New York
My route to causality
Building
recommender
systems in social
Networks
Conducting user
experiments
Estimating impact of
recommendations
and social feeds
Causality is everywhere
Spans every branch of science.
Aristotle: to know, is to know the final cause.
Two approaches:
Randomized experiments (Fisher): Gold standard
Observational data: Messy.
Outline
Causality is everywhere
Economics
Political Science
Human Behavior
Biology and Medicine
Online systems
Estimating causality using graphical models
Conditioning
Mechanism-based
Natural Experiments
The promise of graphical models
Causality in economics
David Card. The causal effect of education on earnings (1999)
Conley and Heerwig. The Long-Term Effects of Military
Conscription on Mortality: Estimates From the Vietnam-Era Draft
Lottery (2012)
Causality in political science
Darrell West. Air Wars (2013)
Chattopadhyay and Duflo. Women as Policy Makers:
Evidence from a Randomized Policy Experiment in
India (2004)
Causality in human behavior
Thistlewaithe and Campbell. Effect of public recognition
of scholastic achievement (1960)
Christakis and Fowler. The collective dynamics of
smoking in a large social network (2008)
Causality in biology and medicine
Effect of Vitamin D deficiency on colon cancer
Effect of heart attack surgery on long-term
health of patient
Causality in web applications
Sharma and Cosley. Distinguishing between personal preference
and homophily in online activity feeds (2016).
Sharma, Hofman and Watts. Estimating the causal impact of
recommender systems (2015).
Methods for estimating causal
effects from observational data
Condition on observed
covariates
• Stratification
• Matching
• Regression (?)
Mechanism-based
strategies
• Path-based
approaches
Natural experiments
• As-if experiments
• Instrumental
Variables
• Regression
discontinuity
Towards unifying estimation
strategies: Causal graphical models
I. Ideal: Randomized experiments
II. Conditioning on observed
covariates
Corresponds to Backdoor criterion.
a) Stratification
Condition on different levels of socio-
economic status.
b) Matching
Socio-Economic status is a function of parents’
income, locality and other observed indicators.
b) Matching
Model propensity to attend a particular school.
Pschool = f(PI, Loc, …)
c) Regression
Condition on observed covariates by
adding them as independent variables in
regression.
Works only if true causal
relationship between
variables is linear.
III. Mechanism-based strategies
Corresponds to Front door criterion.
IV. Natural Experiments
Look for experiments happening in the real world.
Promise greater generalizability than controlled lab
experiments.
Require greater care to ensure validity of causal identification.
a. (As-if) random experiments
b) Instrumental variables
Shock!
Increase in
traffic
c) Regression discontinuity
The promise of graphical models
Which variables to condition on?
Two graphical criteria explain all of
conventional approaches
A principled, succinct framework for causality.
Allows arbitrary functional forms for relationships between
variables.
Leads to clear statements about causal assumptions.
If a causal effect can be identified, it can be derived using do-
calculus (helpful for bigger graphs).
Graphical models form a succinct,
consistent and complete framework
for causality.
They are also practical.
thank you!
Amit Sharma
http://www.amitsharma.in

Causal inference in practice: Here, there, causality is everywhere

  • 1.
    Here, there, causality is everywhere AmitSharma Microsoft Research, New York
  • 2.
    My route tocausality Building recommender systems in social Networks Conducting user experiments Estimating impact of recommendations and social feeds
  • 3.
    Causality is everywhere Spansevery branch of science. Aristotle: to know, is to know the final cause. Two approaches: Randomized experiments (Fisher): Gold standard Observational data: Messy.
  • 4.
    Outline Causality is everywhere Economics PoliticalScience Human Behavior Biology and Medicine Online systems Estimating causality using graphical models Conditioning Mechanism-based Natural Experiments The promise of graphical models
  • 5.
    Causality in economics DavidCard. The causal effect of education on earnings (1999) Conley and Heerwig. The Long-Term Effects of Military Conscription on Mortality: Estimates From the Vietnam-Era Draft Lottery (2012)
  • 6.
    Causality in politicalscience Darrell West. Air Wars (2013) Chattopadhyay and Duflo. Women as Policy Makers: Evidence from a Randomized Policy Experiment in India (2004)
  • 7.
    Causality in humanbehavior Thistlewaithe and Campbell. Effect of public recognition of scholastic achievement (1960) Christakis and Fowler. The collective dynamics of smoking in a large social network (2008)
  • 8.
    Causality in biologyand medicine Effect of Vitamin D deficiency on colon cancer Effect of heart attack surgery on long-term health of patient
  • 9.
    Causality in webapplications Sharma and Cosley. Distinguishing between personal preference and homophily in online activity feeds (2016). Sharma, Hofman and Watts. Estimating the causal impact of recommender systems (2015).
  • 10.
    Methods for estimatingcausal effects from observational data Condition on observed covariates • Stratification • Matching • Regression (?) Mechanism-based strategies • Path-based approaches Natural experiments • As-if experiments • Instrumental Variables • Regression discontinuity
  • 11.
  • 12.
  • 13.
    II. Conditioning onobserved covariates Corresponds to Backdoor criterion.
  • 14.
    a) Stratification Condition ondifferent levels of socio- economic status.
  • 15.
    b) Matching Socio-Economic statusis a function of parents’ income, locality and other observed indicators.
  • 16.
    b) Matching Model propensityto attend a particular school. Pschool = f(PI, Loc, …)
  • 17.
    c) Regression Condition onobserved covariates by adding them as independent variables in regression. Works only if true causal relationship between variables is linear.
  • 18.
  • 19.
    IV. Natural Experiments Lookfor experiments happening in the real world. Promise greater generalizability than controlled lab experiments. Require greater care to ensure validity of causal identification.
  • 20.
    a. (As-if) randomexperiments
  • 21.
  • 22.
  • 23.
    The promise ofgraphical models Which variables to condition on?
  • 24.
    Two graphical criteriaexplain all of conventional approaches A principled, succinct framework for causality. Allows arbitrary functional forms for relationships between variables. Leads to clear statements about causal assumptions. If a causal effect can be identified, it can be derived using do- calculus (helpful for bigger graphs).
  • 25.
    Graphical models forma succinct, consistent and complete framework for causality. They are also practical. thank you! Amit Sharma http://www.amitsharma.in

Editor's Notes

  • #3 I did some work on estimating impact of recs. If we get time we will go into it.
  • #13 Example: X = focal product Y = recommended product