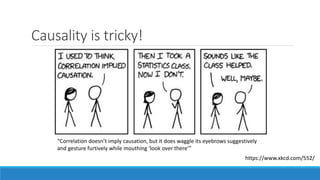
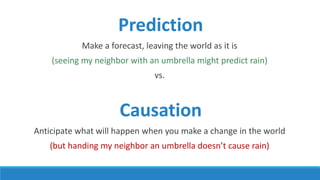
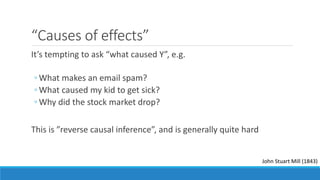
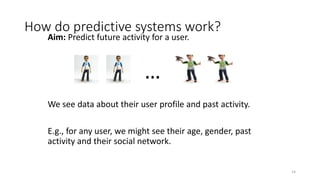
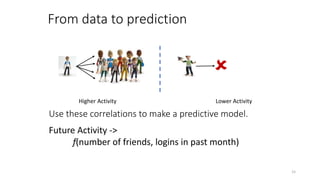
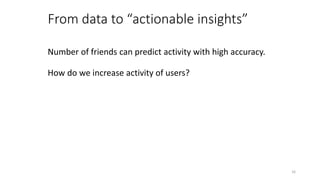
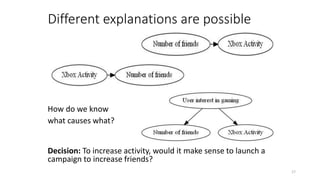
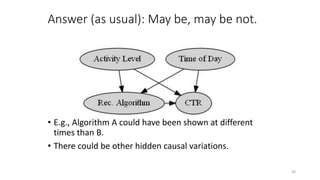
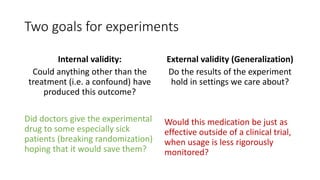
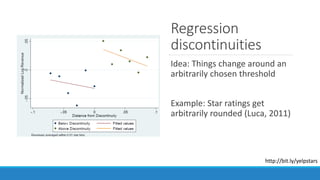
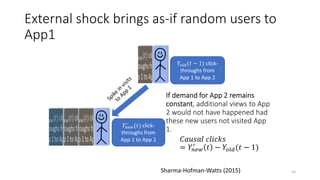
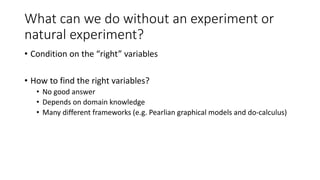
The document discusses causality and experiments in modeling social data. It explains that while prediction involves forecasting based on observation, causation requires determining the effect of making a change. Three types of causal inference are discussed: observational studies which can be biased by confounding factors; randomized experiments which aim to reduce bias through random assignment but have limitations; and natural experiments which exploit real-world occurrences that resemble random experiments. Overall the document emphasizes that determining causal effects rather than just predictive correlations is important but challenging.
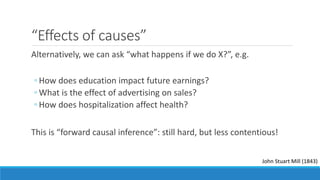
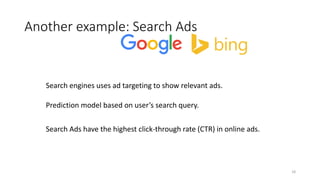
![Observational estimates
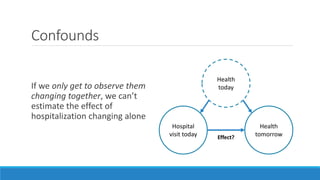
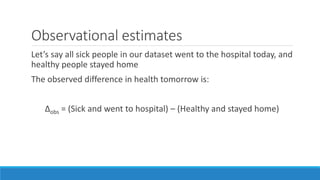
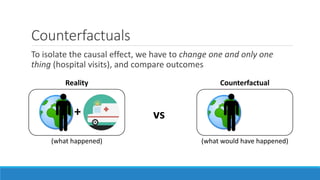
Let’s say all sick people in our dataset went to the hospital today, and
healthy people stayed home
The observed difference in health tomorrow is:
Δobs = [(Sick and went to hospital) – (Sick if stayed home)] +
[(Sick if stayed home) - (Healthy and stayed home)]](https://image.slidesharecdn.com/lecture11-170428200702/85/Modeling-Social-Data-Lecture-11-Causality-and-Experiments-Part-1-9-320.jpg)
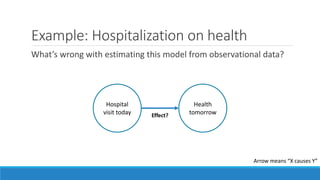
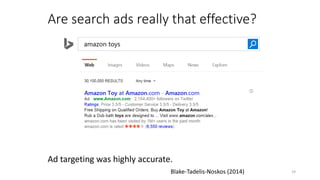
![Selection bias
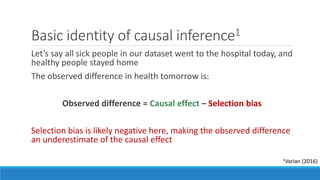
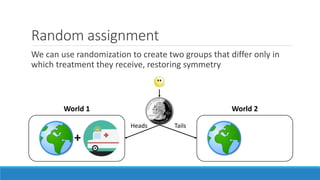
Let’s say all sick people in our dataset went to the hospital today, and
healthy people stayed home
The observed difference in health tomorrow is:
Δobs = [(Sick and went to hospital) – (Sick if stayed home)] +
[(Sick if stayed home) - (Healthy and stayed home)]
Causal effect
Selection bias
(Baseline difference between those who opted in to the treatment and those who didn’t)](https://image.slidesharecdn.com/lecture11-170428200702/85/Modeling-Social-Data-Lecture-11-Causality-and-Experiments-Part-1-10-320.jpg)
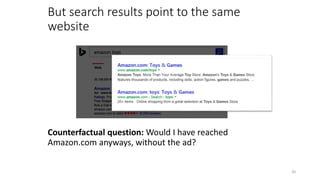


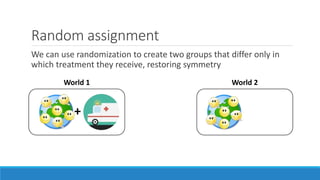
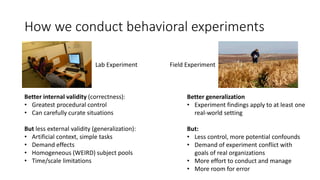
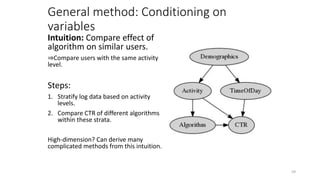
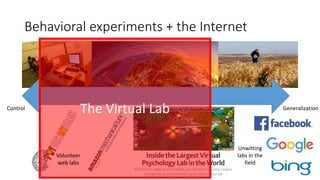
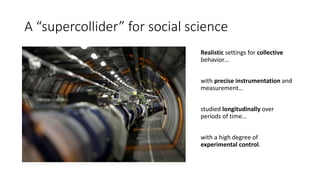
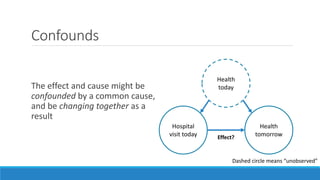
![Behavioral science labs are very limiting
• High degree of procedural control
• Optimized for causal inference
But, many limitations:
• Artificial environment
• Simple tasks, demand effects
• Homogeneous (WEIRD)* subject pools
• Time/scale limitations
• Expensive, difficult to set up
Poor generalization, expensive, slow
ca. 1960s
ca. 2000s
* Western, Educated, Industrialized,
Rich, Democratic [Henrich et al. 2010]](https://image.slidesharecdn.com/lecture11-170428200702/85/Modeling-Social-Data-Lecture-11-Causality-and-Experiments-Part-1-57-320.jpg)