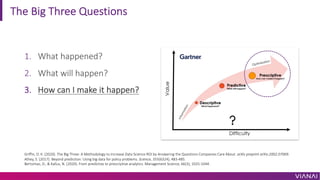
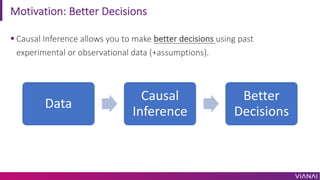
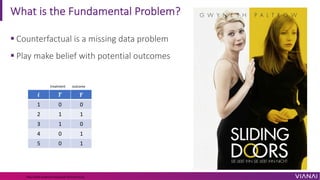
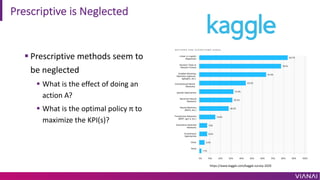
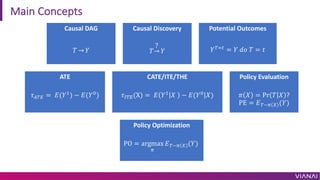
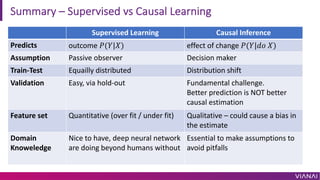
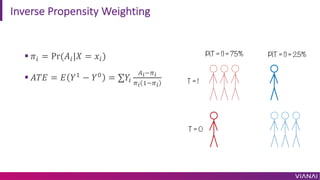
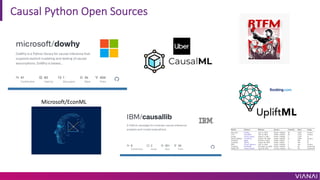
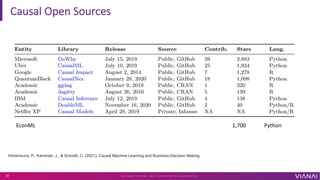
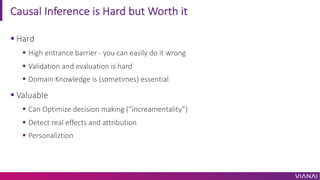
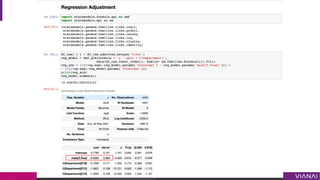
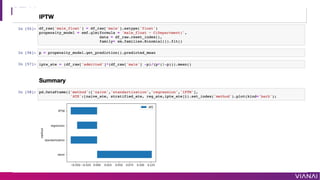
Business Optimization via
Causal Inference
HayaData 2021
Outcome
Action
Why Causal Inference?
© V I A N A I S Y S T E M S , I N C . P R O P R I E T A R Y & C O N F I D E N T I A L
2
The Big Three Questions
1. What happened?
2. What will happen?
3. How can I make it happen?
Griffin, D. K. (2020). The Big Three: A Methodology to Increase Data Science ROI by Answering the Questions Companies Care About. arXiv preprint arXiv:2002.07069.
Athey, S. (2017). Beyond prediction: Using big data for policy problems. Science, 355(6324), 483-485.
Bertsimas, D., & Kallus, N. (2020). From predictive to prescriptive analytics. Management Science, 66(3), 1025-1044.
Motivation: Better Decisions
§ Causal Inference allows you to make better decisions using past
experimental or observational data (+assumptions).
Data
Causal
Inference
Better
Decisions
Nobel Prize in Economics, October 2021
§"for their methodological
contributions to the analysis
of causal relationships."
© V I A N A I S Y S T E M S , I N C . P R O P R I E T A R Y & C O N F I D E N T I A L
5
https://www.nobelprize.org/prizes/economic-sciences/2021/summary/
https://www.linkedin.com/company/vianai/jobs/
© V I A N A I S Y S T E M S , I N C . P R O P R I E T A R Y & C O N F I D E N T I A L
6
Making Better Decision has Business Value
https://www.mckinsey.com/business-functions/mckinsey-analytics/our-insights/most-of-ais-business-uses-will-be-in-two-areas
“Industry experts agree, the importance of causal data
science for data-augmented business decisions will only
grow in the future“
© V I A N A I S Y S T E M S , I N C . P R O P R I E T A R Y & C O N F I D E N T I A L
9
https://causalscience.org/blog/causal-data-science-in-large-us-firms
Causal Inference in the Industry
“We analyze marketing campaigns and the impact of app preloads
using a fourth type of observational study format."
© V I A N A I S Y S T E M S , I N C . P R O P R I E T A R Y & C O N F I D E N T I A L
10
"Causal Inference helps us provide a better user
experience for customers on the Uber platform"
“We rely on quasi-experiments and Causal Inference
methods, especially to measure new marketing and advertising ideas."
Why not just use Prediction?
Predicting churn and preventing churn
are not the same thing
© V I A N A I S Y S T E M S , I N C . P R O P R I E T A R Y & C O N F I D E N T I A L
11
C
A
L
L
E
V
E
R
Y
O
N
E
P>80%
Predicting Churn
Then Target
Lost Causes
Prescriptive is Better
© V I A N A I S Y S T E M S , I N C . P R O P R I E T A R Y & C O N F I D E N T I A L
12
Sure Things
Persuadables
Sleeping Dogs
C
A
L
L
D
O
N
’
T
C
A
L
L
D
O
N
’
T
C
A
L
L
D
O
N
’
T
C
A
L
L
Preventing Churn
Understanding the difference worth
300% better churn prevention
"Retention futility: Targeting high-risk customers might be ineffective." Ascarza, Eva. Journal of Marketing Research 55.1 (2018): 80-98.
Example: Who to Target (Uplift Modeling)
“Persuadables”
“Lost
causes”
“Sure
things”
“Sleeping dogs”
Treated Population
Cumulative
Effect
Treat
All
Treat
None
Optimal
Policy
Random Policy
0% 100%
§ Optimal Policy whould be to target only the population with positive
indivual treatment effect
§ 𝝅opt 𝒙 = '
𝑻 = 𝟏 if 𝝉 𝒙 > 𝟎
𝑻 = 𝟎 otherwise
Sorted by Effect 𝜏
Real Life Example: Uplift with a Design Partner
© V I A N A I S Y S T E M S , I N C . P R O P R I E T A R Y & C O N F I D E N T I A L
14
§ “Should I target a customer ”?
§ Observational Analysis à
§ Experimentally Validated (30% uplift)
§ Call for design partners
Resources for Prescription
Controlled
Experiments
• Stats
Simulations
• RL
Observational
Study
• Causal
What is the Fundamental Problem?
§ Counterfactual is a missing data problem
§ Play make belief with potential outcomes
https://www.bradyneal.com/causal-inference-course
𝒊 𝑻 𝒀 𝒀𝟏
𝒀𝟎
𝝉 = 𝒀𝟏
− 𝒀𝟎
1 0 0 ? 0 ?
2 1 1 1 ? ?
3 1 0 0 ? ?
4 0 1 ? 1 ?
5 0 1 ? 1 ?
treatment outcome potential outcomes Individual treatment effect
Blake, T., Nosko, C. and Tadelis, S., 2015. Consumer heterogeneity and paid search effectiveness: A large-scale field experiment. Econometrica, 83(1), pp.155-174.
0 paid search $ revenue
$ paid search $ revenue
Slightly lower
WARNING: Misleading Attribution
Misconception… …Actual
“We are making
$4 for each $1
we spend”
“It’s $0.37…
We are actually
losing money”
© V I A N A I S Y S T E M S , I N C . P R O P R I E T A R Y & C O N F I D E N T I A L
17
Warning: Bias
§ It is known that Exercise reduces Cholesterol
§ Yet, below is a scatter plot of the data
§ What can explain this?
Y
T
Y
T
Confounders Create Bias in Effect Estimation
§ Age is a confounder which effects both the treatment (Exercise) and the
outcome (Cholesterol)
§ We need to control for it!
https://towardsdatascience.com/implementing-causal-inference-a-key-step-towards-agi-de2cde8ea599
Y
T
X
Y
T
X
T
Y
Prescriptive is Neglected
§ Prescriptive methods seem to
be neglected
§ What is the effect of doing an
action A?
§ What is the optimal policy π to
maximize the KPI(s)?
https://www.kaggle.com/kaggle-survey-2020
How? Causal Inference 101
© V I A N A I S Y S T E M S , I N C . P R O P R I E T A R Y & C O N F I D E N T I A L
21
Main Concepts
Causal DAG
𝑇 → 𝑌
Causal Discovery
𝑇→
?
𝑌
Potential Outcomes
𝑌!"#
= 𝑌 𝑑𝑜 𝑇 = 𝑡
ATE
𝜏$!% = 𝐸(𝑌&
) − 𝐸(𝑌'
)
CATE/ITE/THE
𝜏()*(X) = 𝐸 𝑌&
𝑋 − 𝐸(𝑌'
|𝑋)
Policy Evaluation
𝜋 𝑋 = Pr 𝑇 𝑋 ?
PE = 𝐸!~, - (𝑌)
Policy Optimization
PO = argmax
,
𝐸!~, - (𝑌)
Summary – Supervised vs Causal Learning
Supervised Learning Causal Inference
Predicts outcome 𝑃(𝑌|𝑋) effect of change 𝑃(𝑌|𝑑𝑜 𝑋)
Assumption Passive observer Decision maker
Train-Test Equailly distributed Distribution shift
Validation Easy, via hold-out Fundamental challenge.
Better prediction is NOT better
causal estimation
Feature set Quantitative (over fit / under fit) Qualitative – could cause a bias in
the estimate
Domain
Knoweledge
Nice to have, deep neural network
are doing beyond humans without
Essential to make assumptions to
avoid pitfalls
Typical Stages in a Causal Project
1. Causal Model
2. Identify
3. Estimate
4. *Evaluate & Optimize
5. Refute
Identifiability
§The ability to estimate causal effect from observed data.
§Stable Unit Treatment Value Assumption (SUTVA)
for 𝑖 ≠ 𝑗: 𝐴( ⊥ 𝐴) and 𝑌( ⊥ 𝐴)
§Consistency
𝐴 = 𝑎 → 𝑌 = 𝑌. ∀𝑎
§Ignorability
𝑌', 𝑌& ⊥ 𝐴|𝑋
§Positivity
𝑃 𝐴 = 𝑎 𝑋 = 𝑥 > 0 ∀𝑎, 𝑥
Paper accepted to CDSM21
Quiz: which assumption is this?
Estimation Methods
1. Stratification – aggregate over stratas
𝐸 𝑌/
= ∑𝑃 𝑋 𝐸(𝑌|𝑇 = 𝑡, 𝑋 = 𝑥)
Why is it correct?
𝐸 𝑌 𝑇 = 𝑡, 𝑋 = 𝑥
=
consisitency
𝐸 𝑌/
𝑇 = 𝑡, 𝑋 = 𝑥
=
ignorability
𝐸(𝑌/
|𝑋 = 𝑥)
Estimation Methods
1. Stratification – aggregate over stratas
2. Matching – find “twins” in high dim
Estimation Methods
1. Stratification – aggregate over stratas
2. Matching – find “twins” in high dimension
3. Propensity Matching – find twins in one dimension
Propensity Score
§ Define 𝐴 = 1 for treatment and 𝐴 = 0 for control, we will denote the
propensity score for subject 𝑖 by
𝜋0 = Pr(𝐴 = 1|𝑋0)
§ propensity is a “balancing score”: meaning if we control/match for it, we
will get unbiased effect estimation
𝑃 𝑋 𝜋 𝑋 = 𝑝, 𝐴 = 1 = 𝑃 𝑋 𝜋 𝑋 = 𝑝, 𝐴 = 0
Estimation Methods
1. Stratification – aggregate over stratas
2. Matching – find “twins” in high dimension
3. Propensity Matching – find twins in one dimension
4. IPTW - Inverse Propensity Treatment Weighting
Note: It can be shown that IPTW and standardization are equivalent
(Technical Point 2.3, see Appendix)
Inverse Propensity Weighting
§ 𝜋0 = Pr(𝐴0|𝑋 = 𝑥0)
§ 𝐴𝑇𝐸 = 𝐸 𝑌1
− 𝑌2
= ∑𝑌0
3!45!
5! 145!
What? In Practice
© V I A N A I S Y S T E M S , I N C . P R O P R I E T A R Y & C O N F I D E N T I A L
33
Causal Python Open Sources
Microsoft/EconML
Causal Open Sources
EconML 1,700 Python
© V I A N A I S Y S T E M S , I N C . P R O P R I E T A R Y & C O N F I D E N T I A L
35
Hünermund, P., Kaminski, J., & Schmitt, C. (2021). Causal Machine Learning and Business-Decision Making.
Causal Inference is Hard but Worth it
§ Hard
§ High entrance barrier - you can easily do it wrong
§ Validation and evaluation is hard
§ Domain Knowledge is (sometimes) essential
§ Valuable
§ Can Optimize decision making (“increamentality”)
§ Detect real effects and attribution
§ Personaliztion
Code for Toy Problem
© V I A N A I S Y S T E M S , I N C . P R O P R I E T A R Y & C O N F I D E N T I A L
37
hanan@vian.ai
office hours 15:00-15:30
© V I A N A I S Y S T E M S , I N C . P R O P R I E T A R Y & C O N F I D E N T I A L
38
P.J. Bickel, E.A. Hammel and J.W. O'Connell (1975). "Sex Bias in Graduate
Admissions: Data From Berkeley" (PDF). Science. 187 (4175): 398–404.
IPTW

Business Optimization via Causal Inference

  • 1.
    Business Optimization via CausalInference HayaData 2021 Outcome Action
  • 2.
    Why Causal Inference? ©V I A N A I S Y S T E M S , I N C . P R O P R I E T A R Y & C O N F I D E N T I A L 2
  • 3.
    The Big ThreeQuestions 1. What happened? 2. What will happen? 3. How can I make it happen? Griffin, D. K. (2020). The Big Three: A Methodology to Increase Data Science ROI by Answering the Questions Companies Care About. arXiv preprint arXiv:2002.07069. Athey, S. (2017). Beyond prediction: Using big data for policy problems. Science, 355(6324), 483-485. Bertsimas, D., & Kallus, N. (2020). From predictive to prescriptive analytics. Management Science, 66(3), 1025-1044.
  • 4.
    Motivation: Better Decisions §Causal Inference allows you to make better decisions using past experimental or observational data (+assumptions). Data Causal Inference Better Decisions
  • 5.
    Nobel Prize inEconomics, October 2021 §"for their methodological contributions to the analysis of causal relationships." © V I A N A I S Y S T E M S , I N C . P R O P R I E T A R Y & C O N F I D E N T I A L 5 https://www.nobelprize.org/prizes/economic-sciences/2021/summary/
  • 6.
    https://www.linkedin.com/company/vianai/jobs/ © V IA N A I S Y S T E M S , I N C . P R O P R I E T A R Y & C O N F I D E N T I A L 6
  • 7.
    Making Better Decisionhas Business Value https://www.mckinsey.com/business-functions/mckinsey-analytics/our-insights/most-of-ais-business-uses-will-be-in-two-areas
  • 8.
    “Industry experts agree,the importance of causal data science for data-augmented business decisions will only grow in the future“ © V I A N A I S Y S T E M S , I N C . P R O P R I E T A R Y & C O N F I D E N T I A L 9 https://causalscience.org/blog/causal-data-science-in-large-us-firms
  • 9.
    Causal Inference inthe Industry “We analyze marketing campaigns and the impact of app preloads using a fourth type of observational study format." © V I A N A I S Y S T E M S , I N C . P R O P R I E T A R Y & C O N F I D E N T I A L 10 "Causal Inference helps us provide a better user experience for customers on the Uber platform" “We rely on quasi-experiments and Causal Inference methods, especially to measure new marketing and advertising ideas."
  • 10.
    Why not justuse Prediction? Predicting churn and preventing churn are not the same thing © V I A N A I S Y S T E M S , I N C . P R O P R I E T A R Y & C O N F I D E N T I A L 11 C A L L E V E R Y O N E P>80% Predicting Churn Then Target
  • 11.
    Lost Causes Prescriptive isBetter © V I A N A I S Y S T E M S , I N C . P R O P R I E T A R Y & C O N F I D E N T I A L 12 Sure Things Persuadables Sleeping Dogs C A L L D O N ’ T C A L L D O N ’ T C A L L D O N ’ T C A L L Preventing Churn Understanding the difference worth 300% better churn prevention "Retention futility: Targeting high-risk customers might be ineffective." Ascarza, Eva. Journal of Marketing Research 55.1 (2018): 80-98.
  • 12.
    Example: Who toTarget (Uplift Modeling) “Persuadables” “Lost causes” “Sure things” “Sleeping dogs” Treated Population Cumulative Effect Treat All Treat None Optimal Policy Random Policy 0% 100% § Optimal Policy whould be to target only the population with positive indivual treatment effect § 𝝅opt 𝒙 = ' 𝑻 = 𝟏 if 𝝉 𝒙 > 𝟎 𝑻 = 𝟎 otherwise Sorted by Effect 𝜏
  • 13.
    Real Life Example:Uplift with a Design Partner © V I A N A I S Y S T E M S , I N C . P R O P R I E T A R Y & C O N F I D E N T I A L 14 § “Should I target a customer ”? § Observational Analysis à § Experimentally Validated (30% uplift) § Call for design partners
  • 14.
    Resources for Prescription Controlled Experiments •Stats Simulations • RL Observational Study • Causal
  • 15.
    What is theFundamental Problem? § Counterfactual is a missing data problem § Play make belief with potential outcomes https://www.bradyneal.com/causal-inference-course 𝒊 𝑻 𝒀 𝒀𝟏 𝒀𝟎 𝝉 = 𝒀𝟏 − 𝒀𝟎 1 0 0 ? 0 ? 2 1 1 1 ? ? 3 1 0 0 ? ? 4 0 1 ? 1 ? 5 0 1 ? 1 ? treatment outcome potential outcomes Individual treatment effect
  • 16.
    Blake, T., Nosko,C. and Tadelis, S., 2015. Consumer heterogeneity and paid search effectiveness: A large-scale field experiment. Econometrica, 83(1), pp.155-174. 0 paid search $ revenue $ paid search $ revenue Slightly lower WARNING: Misleading Attribution Misconception… …Actual “We are making $4 for each $1 we spend” “It’s $0.37… We are actually losing money” © V I A N A I S Y S T E M S , I N C . P R O P R I E T A R Y & C O N F I D E N T I A L 17
  • 17.
    Warning: Bias § Itis known that Exercise reduces Cholesterol § Yet, below is a scatter plot of the data § What can explain this? Y T Y T
  • 18.
    Confounders Create Biasin Effect Estimation § Age is a confounder which effects both the treatment (Exercise) and the outcome (Cholesterol) § We need to control for it! https://towardsdatascience.com/implementing-causal-inference-a-key-step-towards-agi-de2cde8ea599 Y T X Y T X T Y
  • 19.
    Prescriptive is Neglected §Prescriptive methods seem to be neglected § What is the effect of doing an action A? § What is the optimal policy π to maximize the KPI(s)? https://www.kaggle.com/kaggle-survey-2020
  • 20.
    How? Causal Inference101 © V I A N A I S Y S T E M S , I N C . P R O P R I E T A R Y & C O N F I D E N T I A L 21
  • 21.
    Main Concepts Causal DAG 𝑇→ 𝑌 Causal Discovery 𝑇→ ? 𝑌 Potential Outcomes 𝑌!"# = 𝑌 𝑑𝑜 𝑇 = 𝑡 ATE 𝜏$!% = 𝐸(𝑌& ) − 𝐸(𝑌' ) CATE/ITE/THE 𝜏()*(X) = 𝐸 𝑌& 𝑋 − 𝐸(𝑌' |𝑋) Policy Evaluation 𝜋 𝑋 = Pr 𝑇 𝑋 ? PE = 𝐸!~, - (𝑌) Policy Optimization PO = argmax , 𝐸!~, - (𝑌)
  • 22.
    Summary – Supervisedvs Causal Learning Supervised Learning Causal Inference Predicts outcome 𝑃(𝑌|𝑋) effect of change 𝑃(𝑌|𝑑𝑜 𝑋) Assumption Passive observer Decision maker Train-Test Equailly distributed Distribution shift Validation Easy, via hold-out Fundamental challenge. Better prediction is NOT better causal estimation Feature set Quantitative (over fit / under fit) Qualitative – could cause a bias in the estimate Domain Knoweledge Nice to have, deep neural network are doing beyond humans without Essential to make assumptions to avoid pitfalls
  • 23.
    Typical Stages ina Causal Project 1. Causal Model 2. Identify 3. Estimate 4. *Evaluate & Optimize 5. Refute
  • 24.
    Identifiability §The ability toestimate causal effect from observed data. §Stable Unit Treatment Value Assumption (SUTVA) for 𝑖 ≠ 𝑗: 𝐴( ⊥ 𝐴) and 𝑌( ⊥ 𝐴) §Consistency 𝐴 = 𝑎 → 𝑌 = 𝑌. ∀𝑎 §Ignorability 𝑌', 𝑌& ⊥ 𝐴|𝑋 §Positivity 𝑃 𝐴 = 𝑎 𝑋 = 𝑥 > 0 ∀𝑎, 𝑥 Paper accepted to CDSM21
  • 25.
  • 26.
    Estimation Methods 1. Stratification– aggregate over stratas 𝐸 𝑌/ = ∑𝑃 𝑋 𝐸(𝑌|𝑇 = 𝑡, 𝑋 = 𝑥) Why is it correct? 𝐸 𝑌 𝑇 = 𝑡, 𝑋 = 𝑥 = consisitency 𝐸 𝑌/ 𝑇 = 𝑡, 𝑋 = 𝑥 = ignorability 𝐸(𝑌/ |𝑋 = 𝑥)
  • 27.
    Estimation Methods 1. Stratification– aggregate over stratas 2. Matching – find “twins” in high dim
  • 28.
    Estimation Methods 1. Stratification– aggregate over stratas 2. Matching – find “twins” in high dimension 3. Propensity Matching – find twins in one dimension
  • 29.
    Propensity Score § Define𝐴 = 1 for treatment and 𝐴 = 0 for control, we will denote the propensity score for subject 𝑖 by 𝜋0 = Pr(𝐴 = 1|𝑋0) § propensity is a “balancing score”: meaning if we control/match for it, we will get unbiased effect estimation 𝑃 𝑋 𝜋 𝑋 = 𝑝, 𝐴 = 1 = 𝑃 𝑋 𝜋 𝑋 = 𝑝, 𝐴 = 0
  • 30.
    Estimation Methods 1. Stratification– aggregate over stratas 2. Matching – find “twins” in high dimension 3. Propensity Matching – find twins in one dimension 4. IPTW - Inverse Propensity Treatment Weighting Note: It can be shown that IPTW and standardization are equivalent (Technical Point 2.3, see Appendix)
  • 31.
    Inverse Propensity Weighting §𝜋0 = Pr(𝐴0|𝑋 = 𝑥0) § 𝐴𝑇𝐸 = 𝐸 𝑌1 − 𝑌2 = ∑𝑌0 3!45! 5! 145!
  • 32.
    What? In Practice ©V I A N A I S Y S T E M S , I N C . P R O P R I E T A R Y & C O N F I D E N T I A L 33
  • 33.
    Causal Python OpenSources Microsoft/EconML
  • 34.
    Causal Open Sources EconML1,700 Python © V I A N A I S Y S T E M S , I N C . P R O P R I E T A R Y & C O N F I D E N T I A L 35 Hünermund, P., Kaminski, J., & Schmitt, C. (2021). Causal Machine Learning and Business-Decision Making.
  • 35.
    Causal Inference isHard but Worth it § Hard § High entrance barrier - you can easily do it wrong § Validation and evaluation is hard § Domain Knowledge is (sometimes) essential § Valuable § Can Optimize decision making (“increamentality”) § Detect real effects and attribution § Personaliztion
  • 36.
    Code for ToyProblem © V I A N A I S Y S T E M S , I N C . P R O P R I E T A R Y & C O N F I D E N T I A L 37
  • 37.
    hanan@vian.ai office hours 15:00-15:30 ©V I A N A I S Y S T E M S , I N C . P R O P R I E T A R Y & C O N F I D E N T I A L 38
  • 38.
    P.J. Bickel, E.A.Hammel and J.W. O'Connell (1975). "Sex Bias in Graduate Admissions: Data From Berkeley" (PDF). Science. 187 (4175): 398–404.
  • 43.