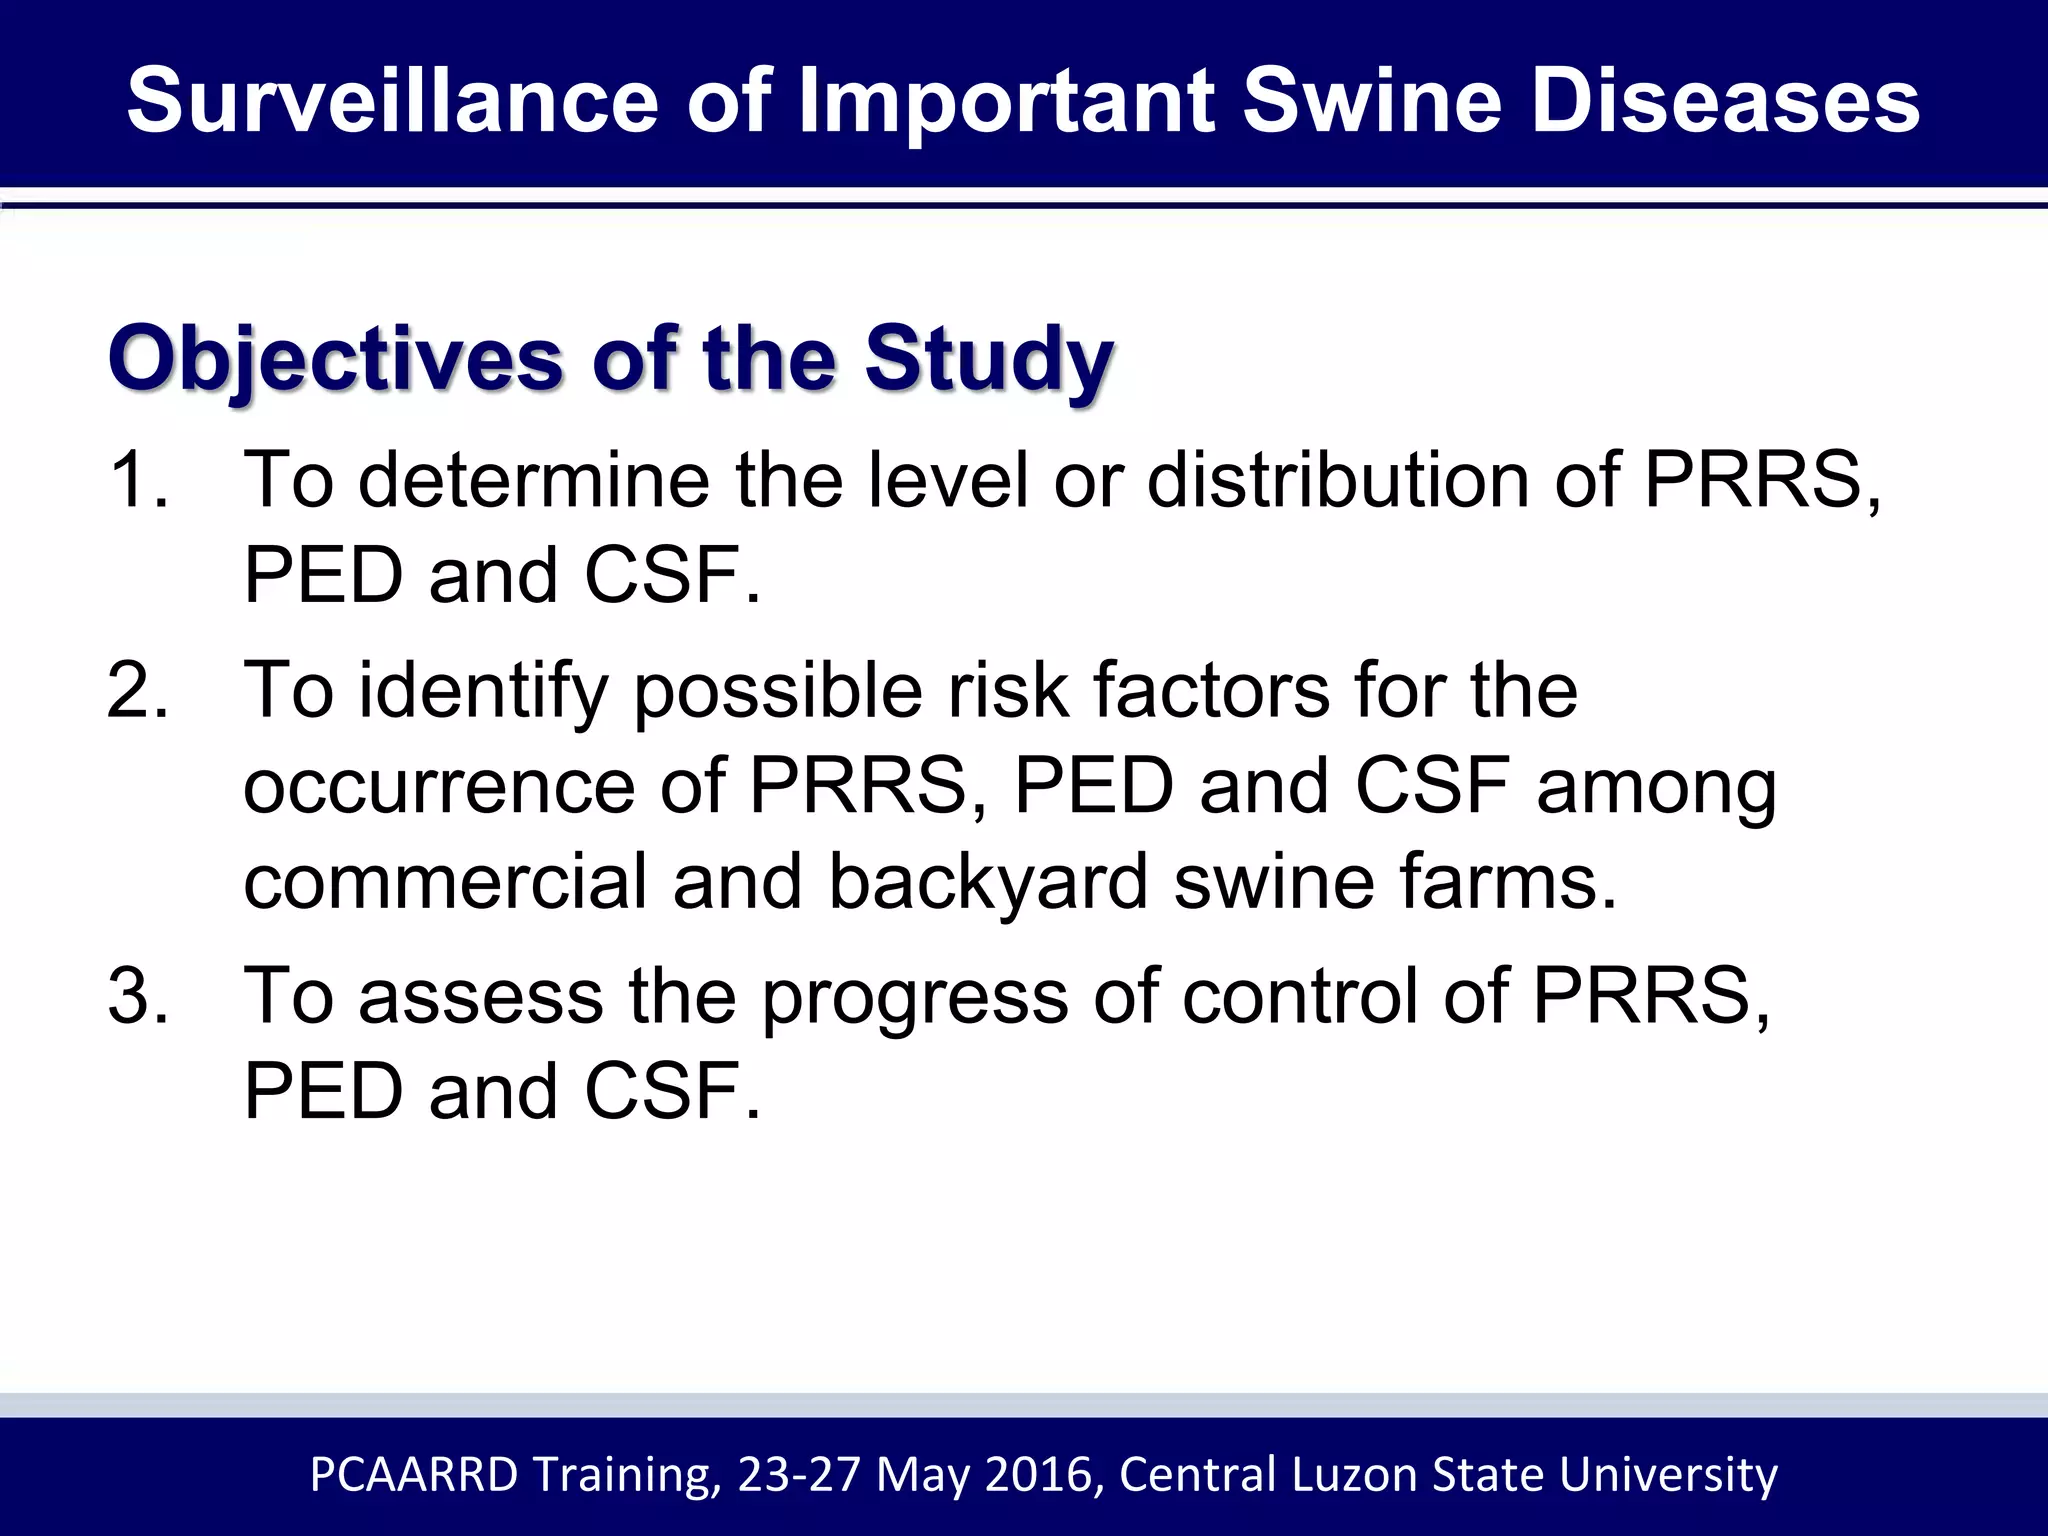
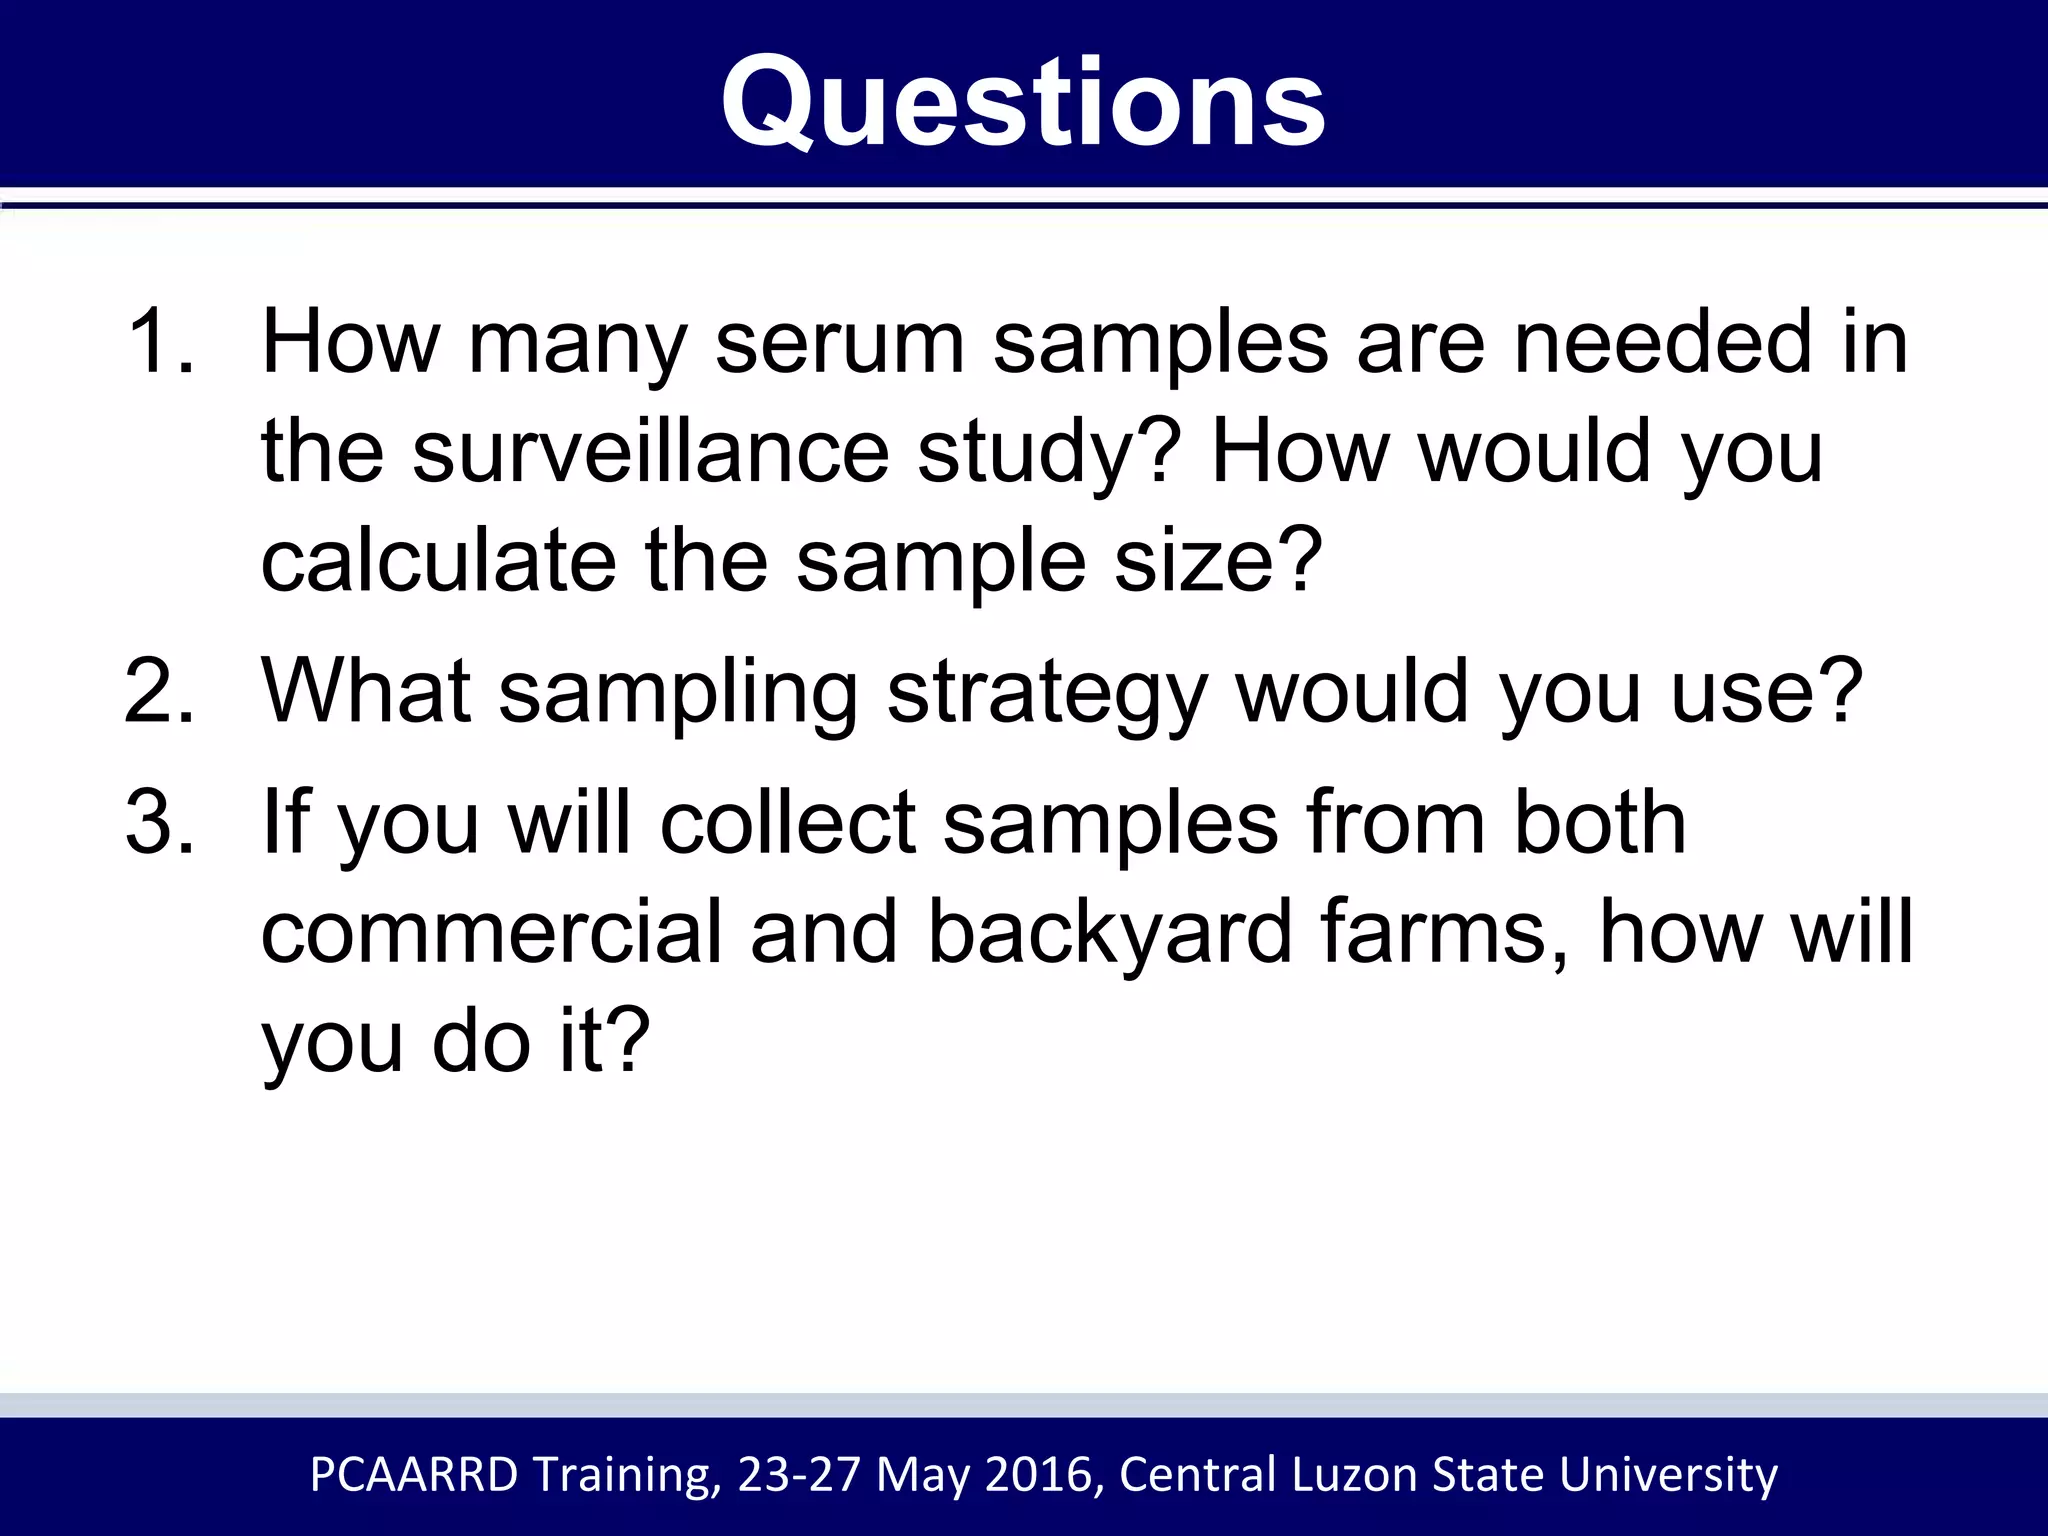
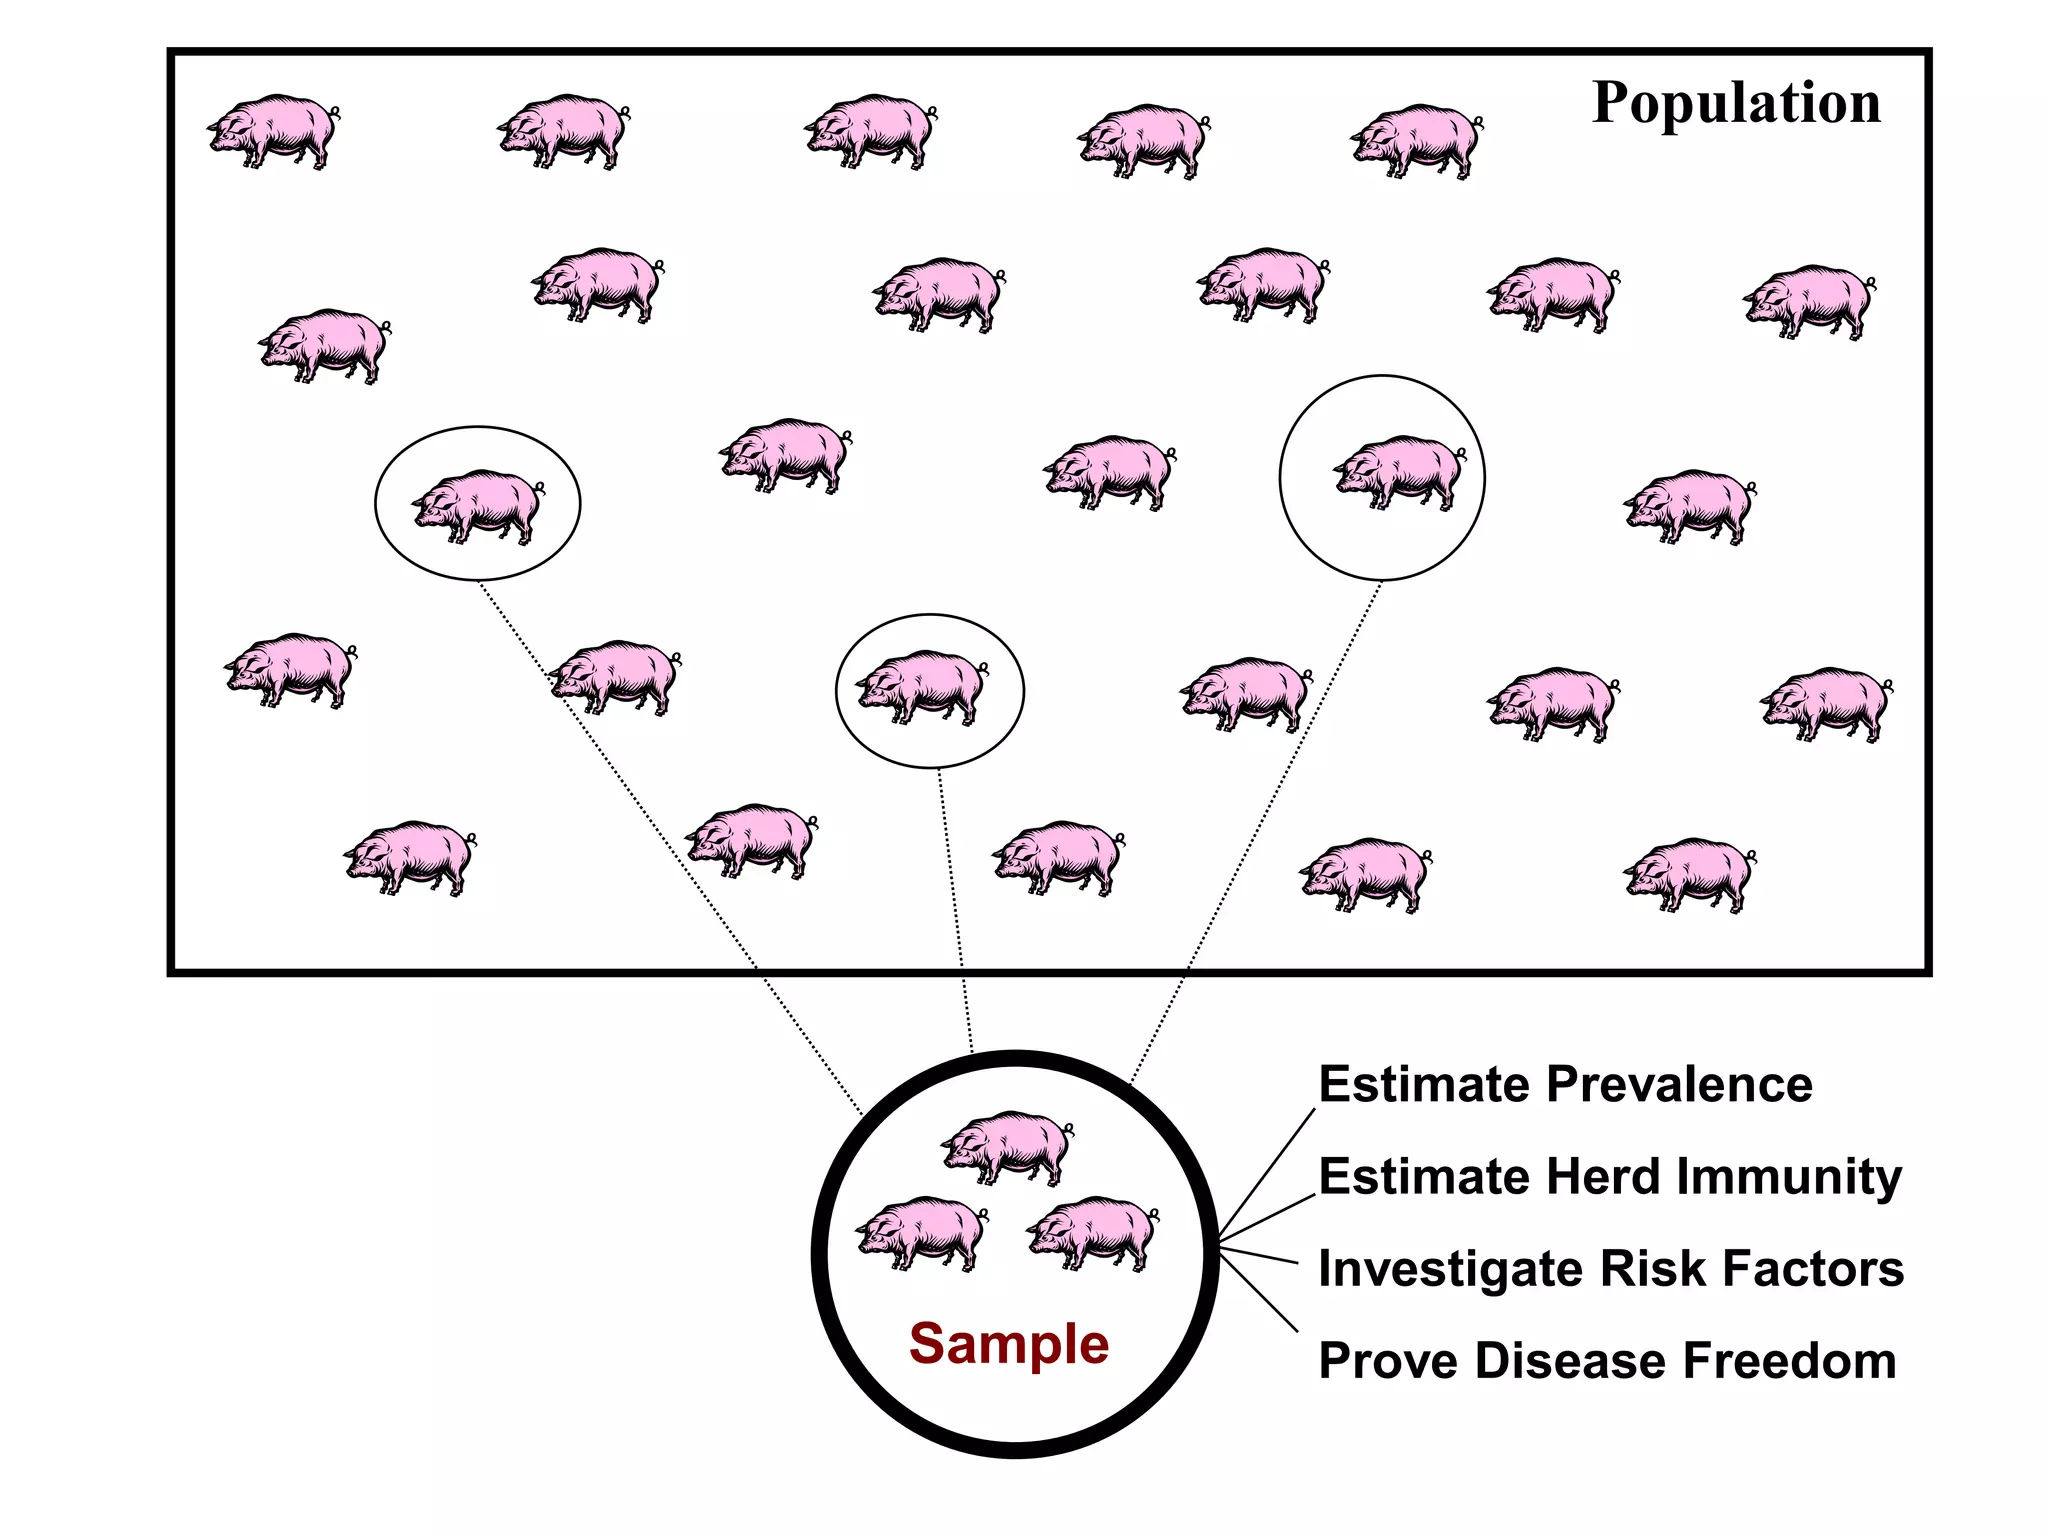
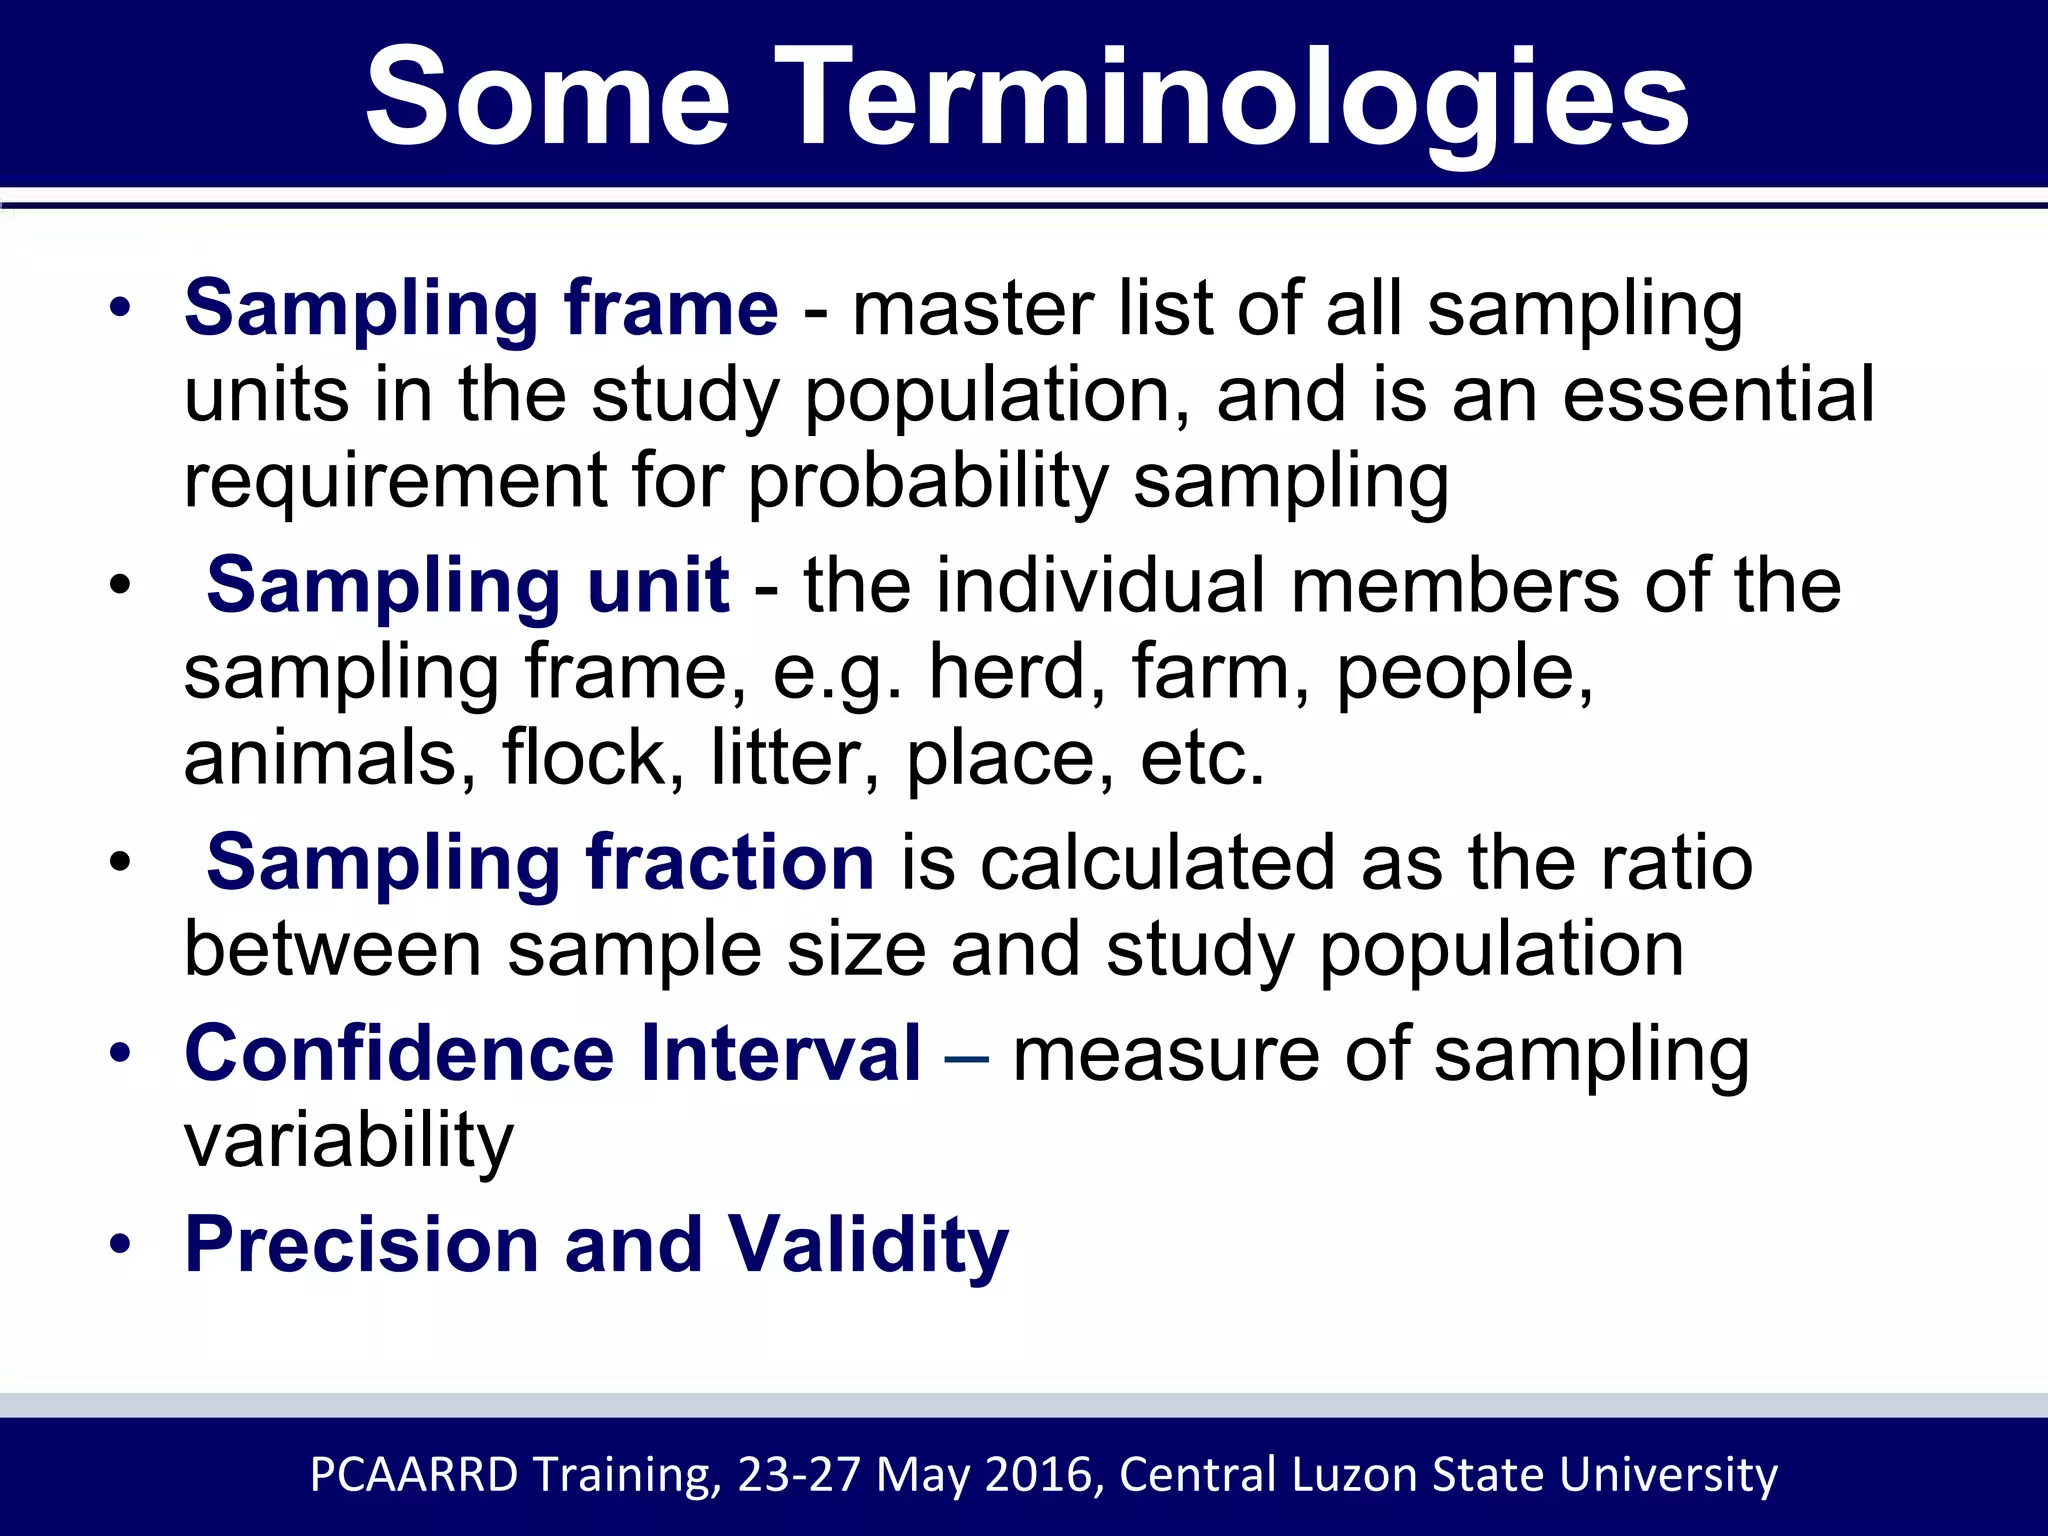
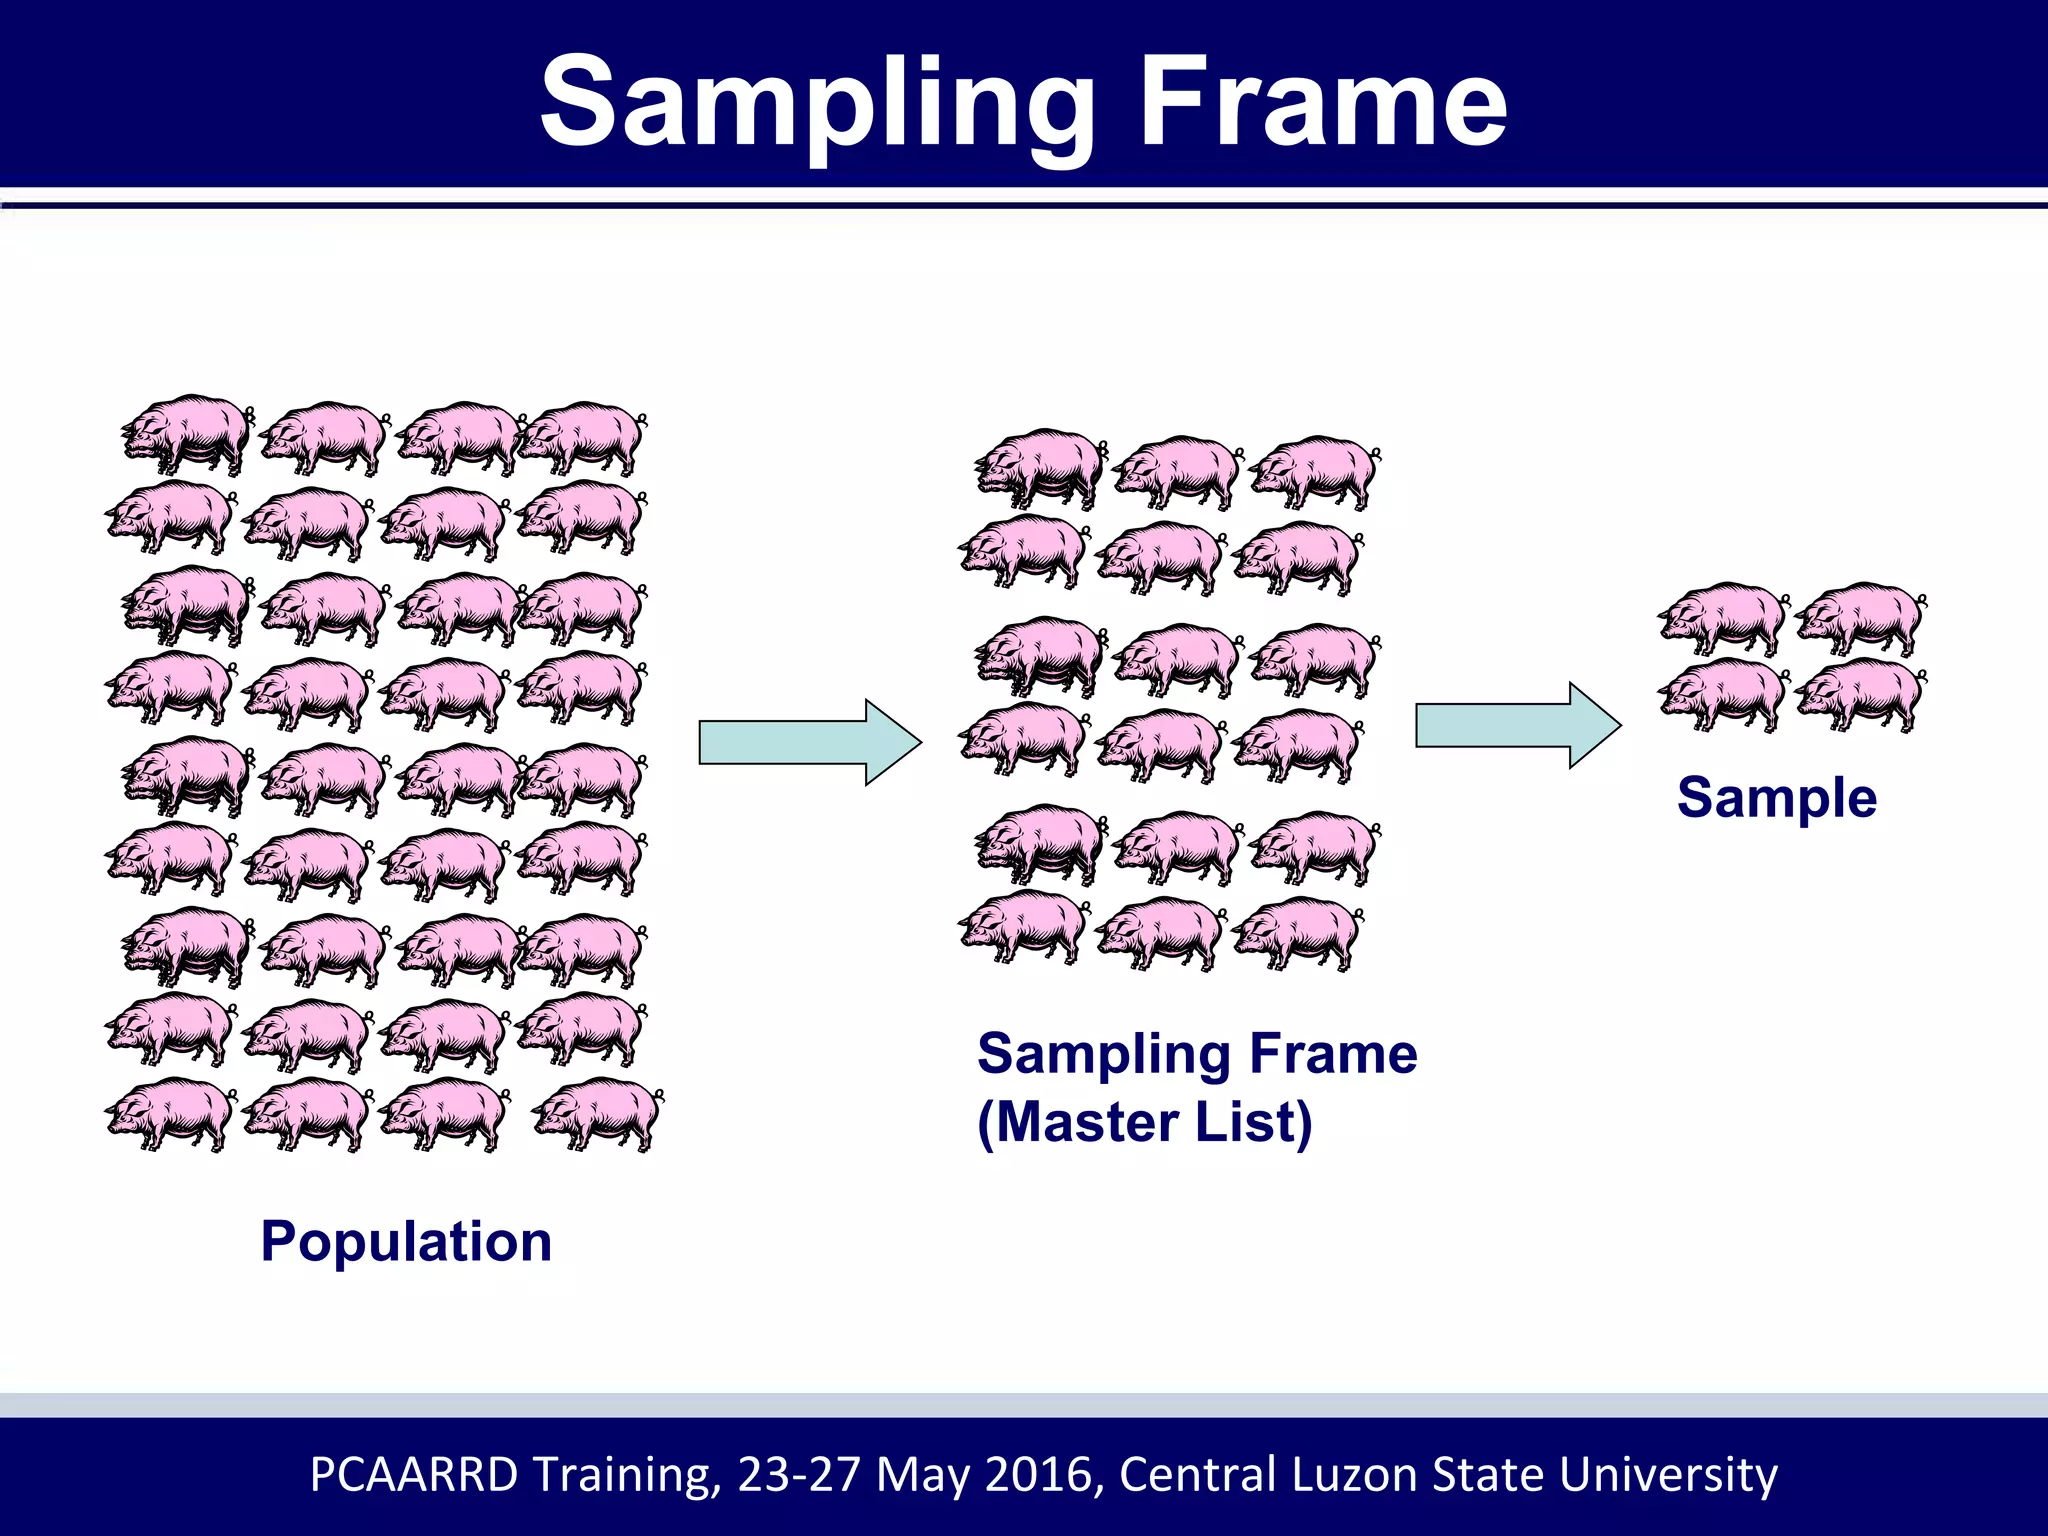
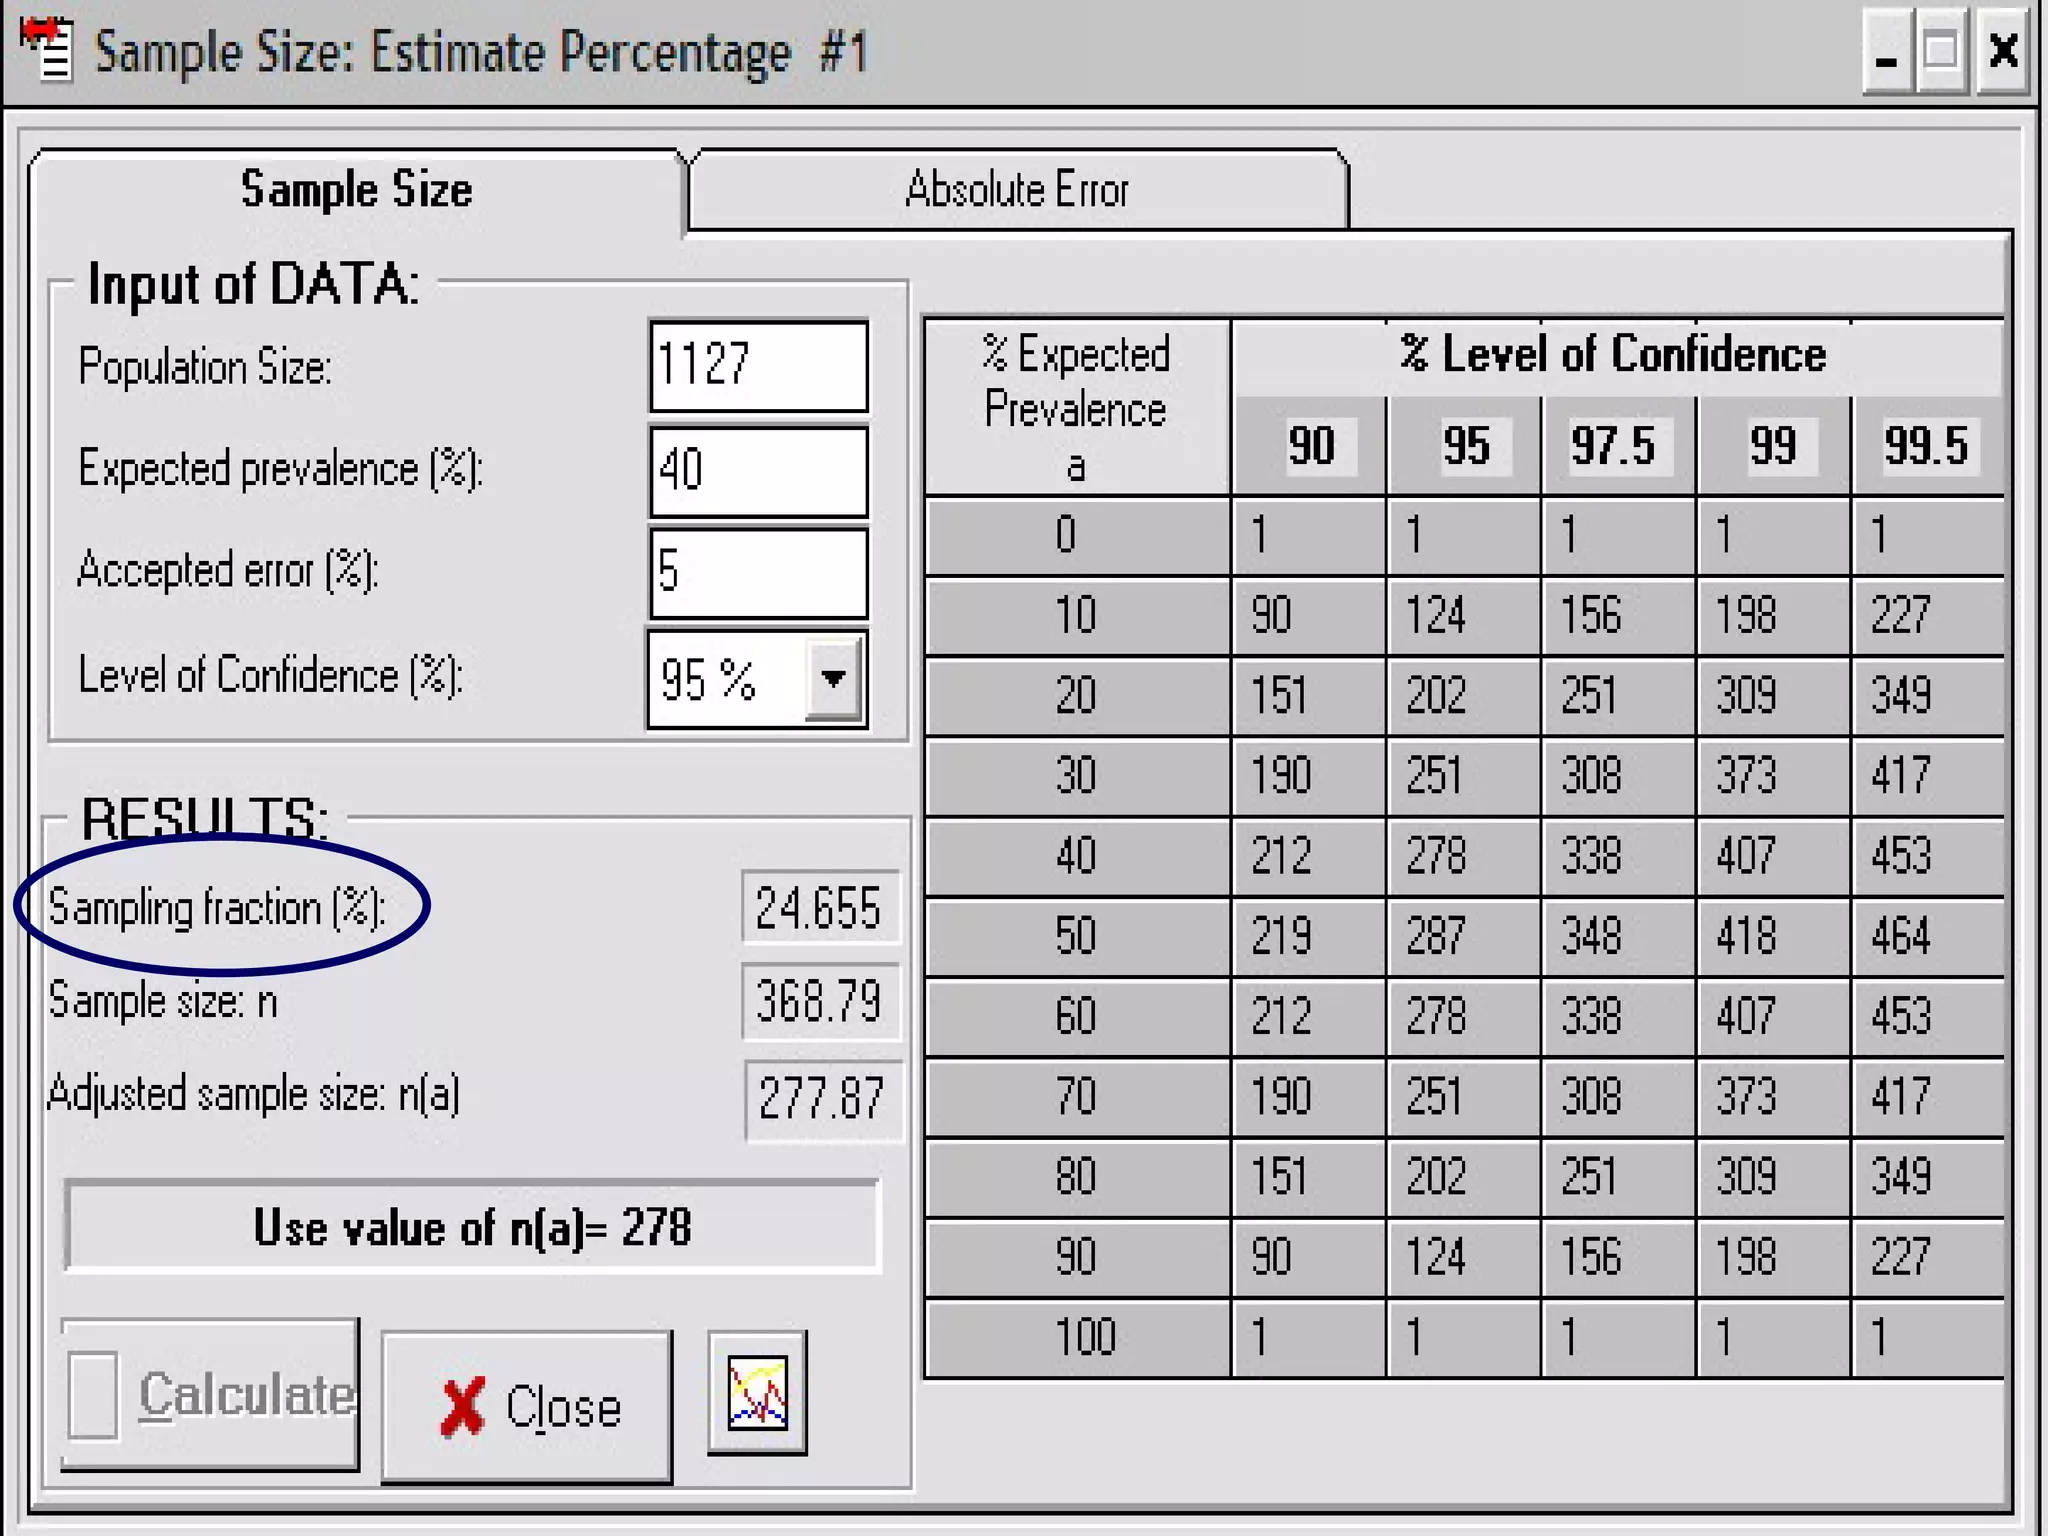
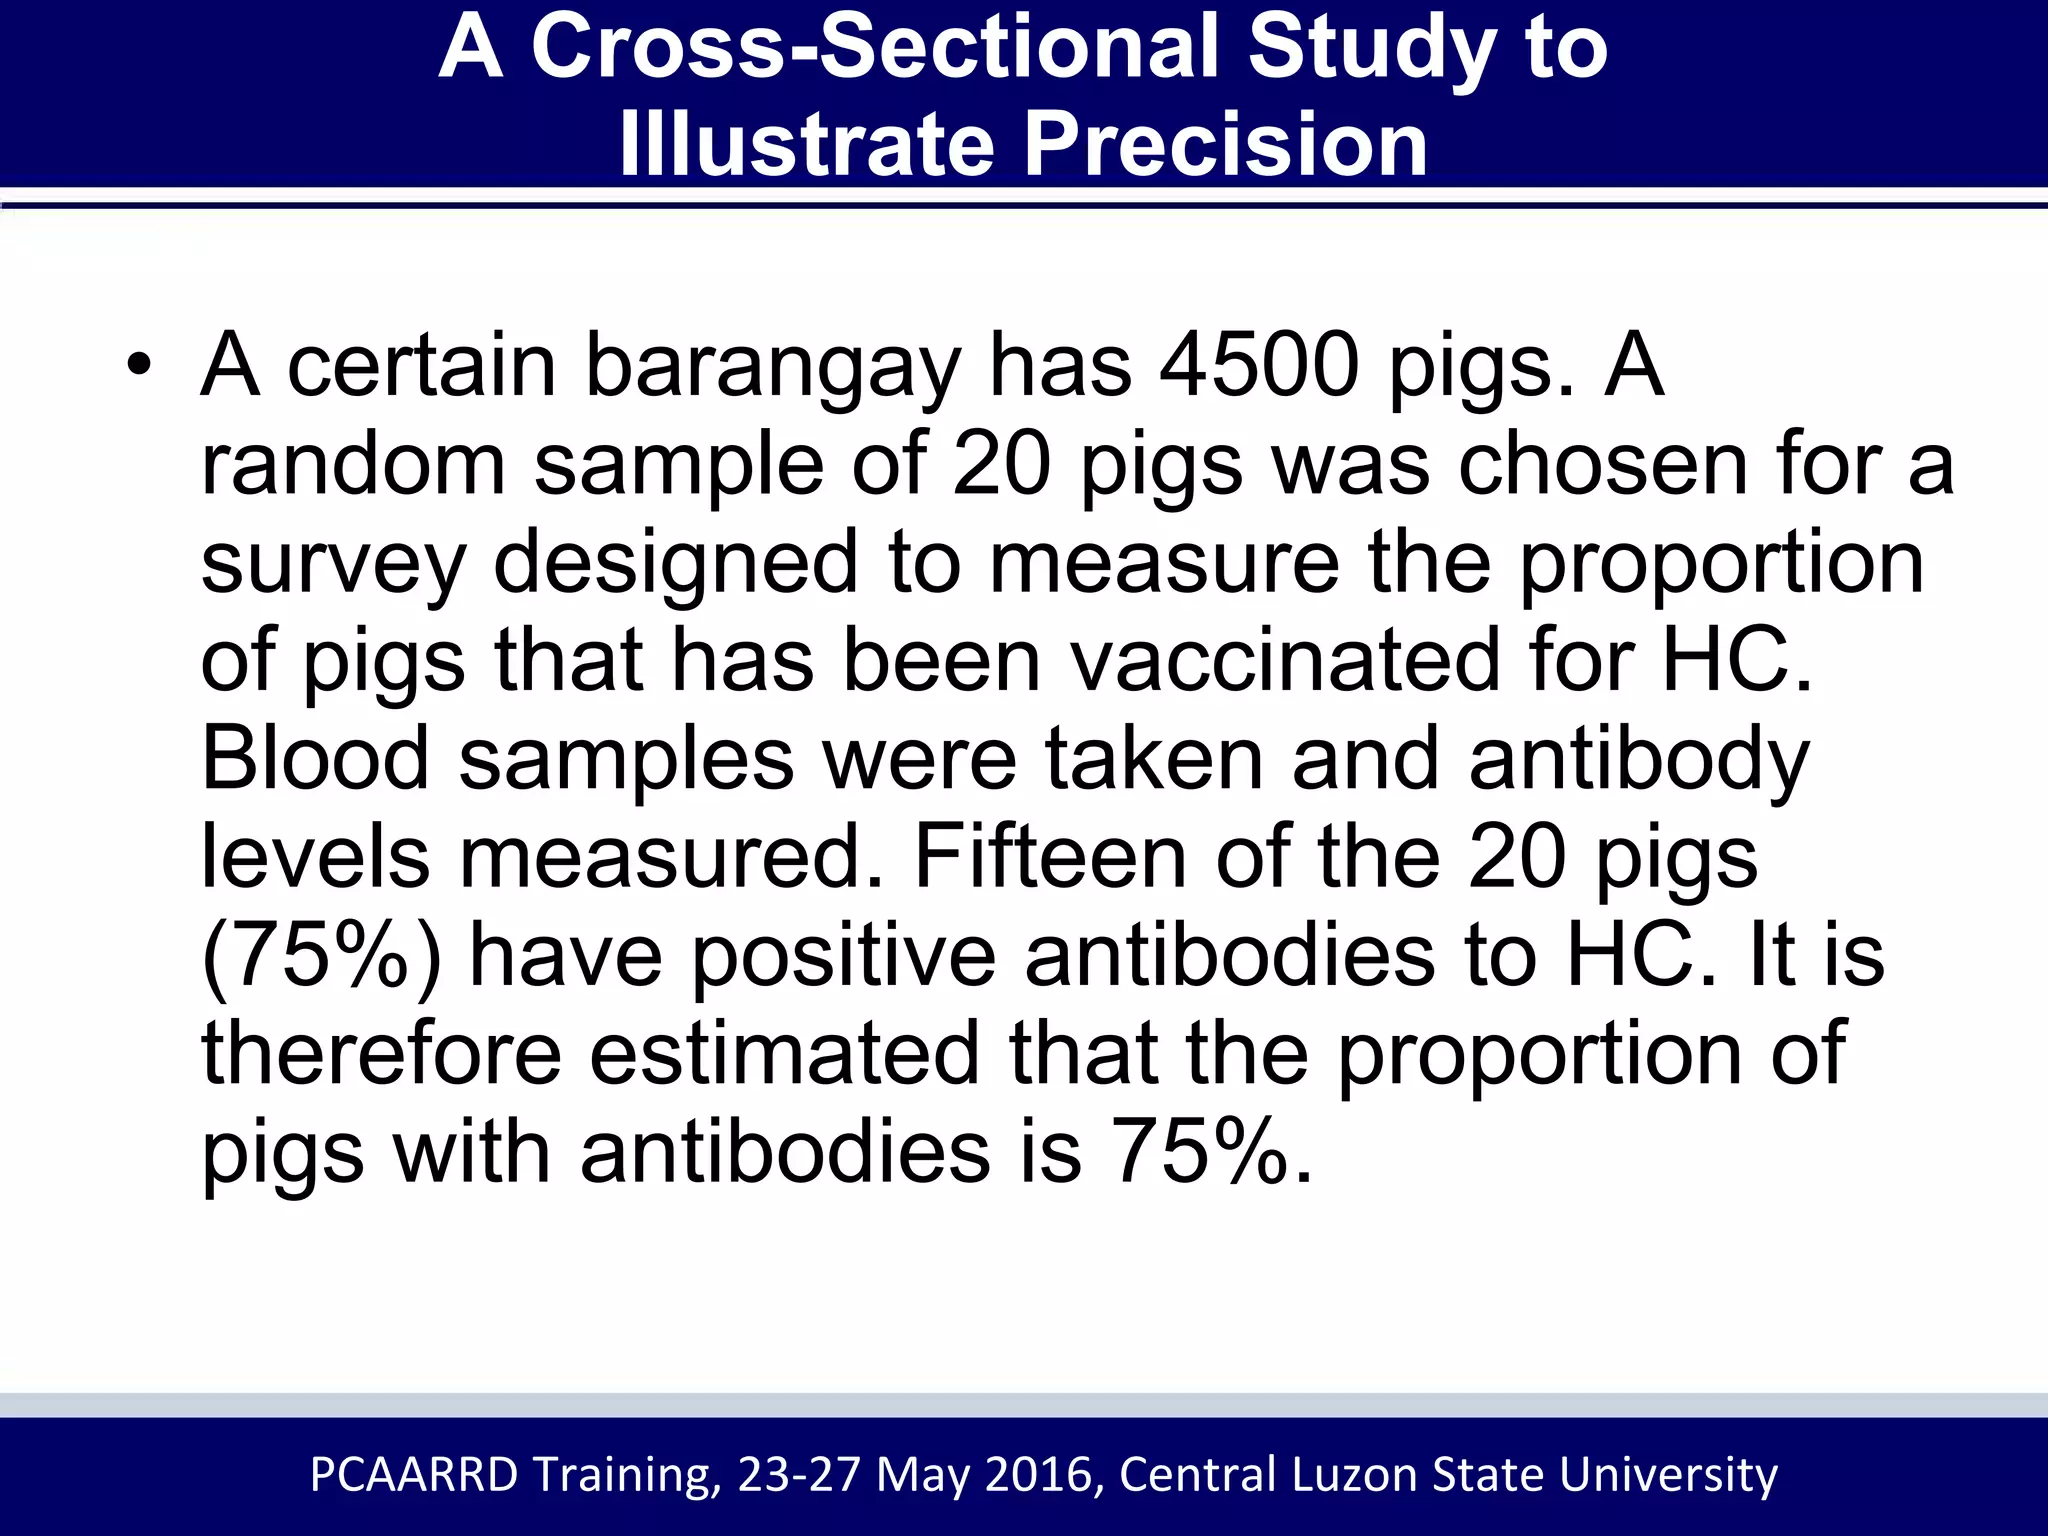
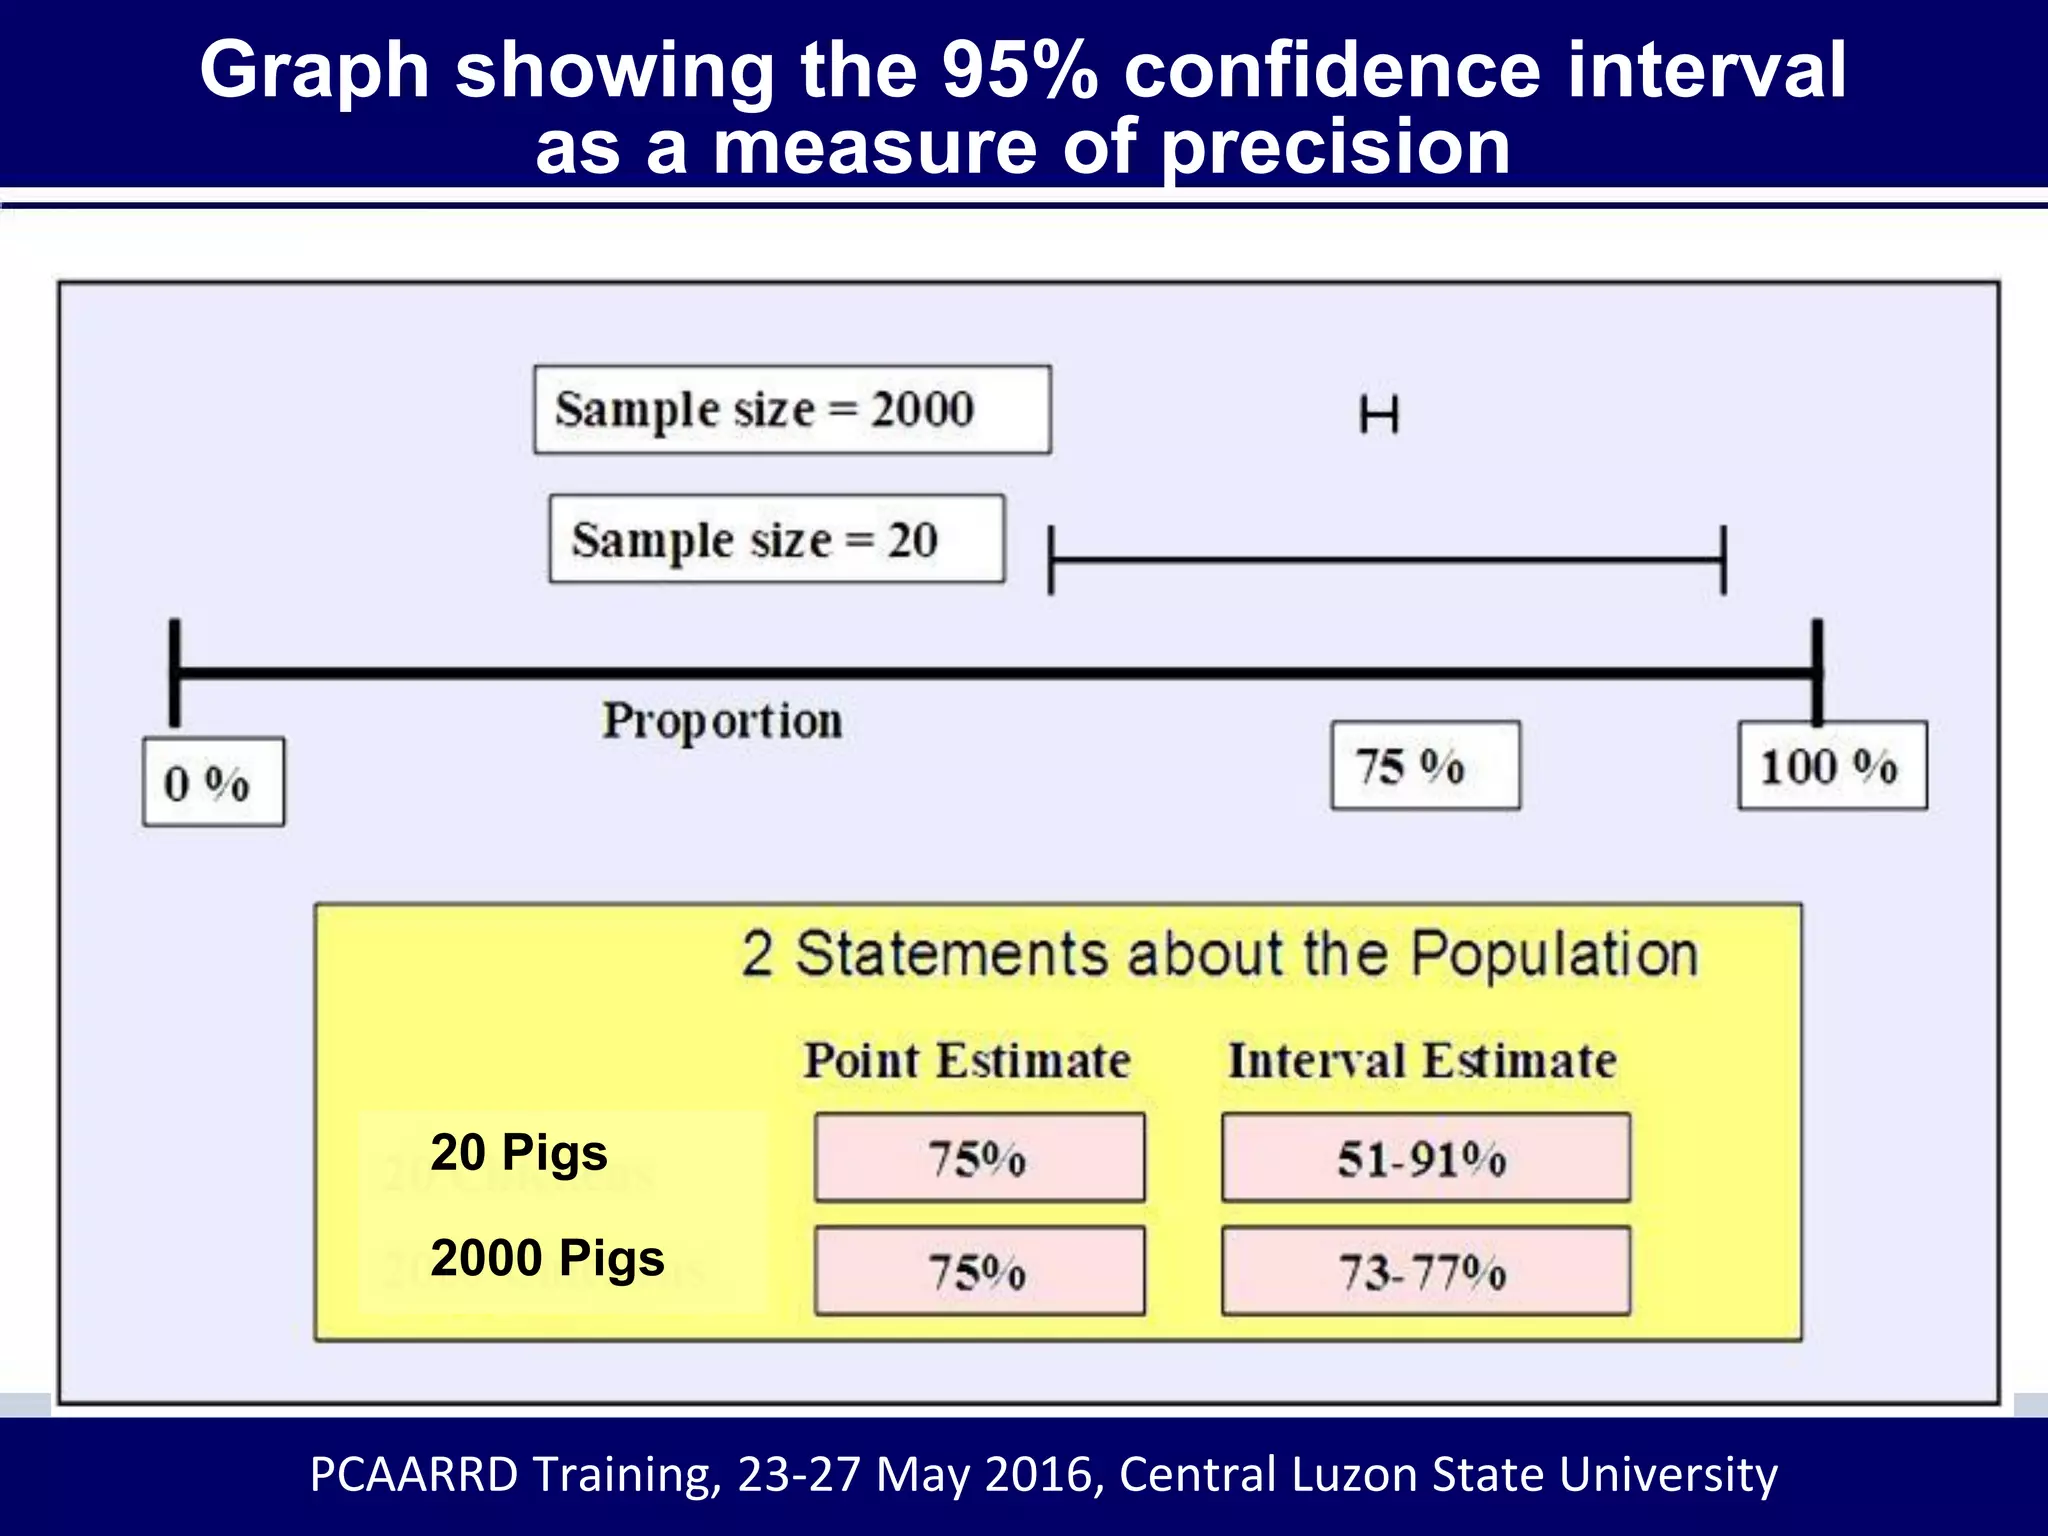
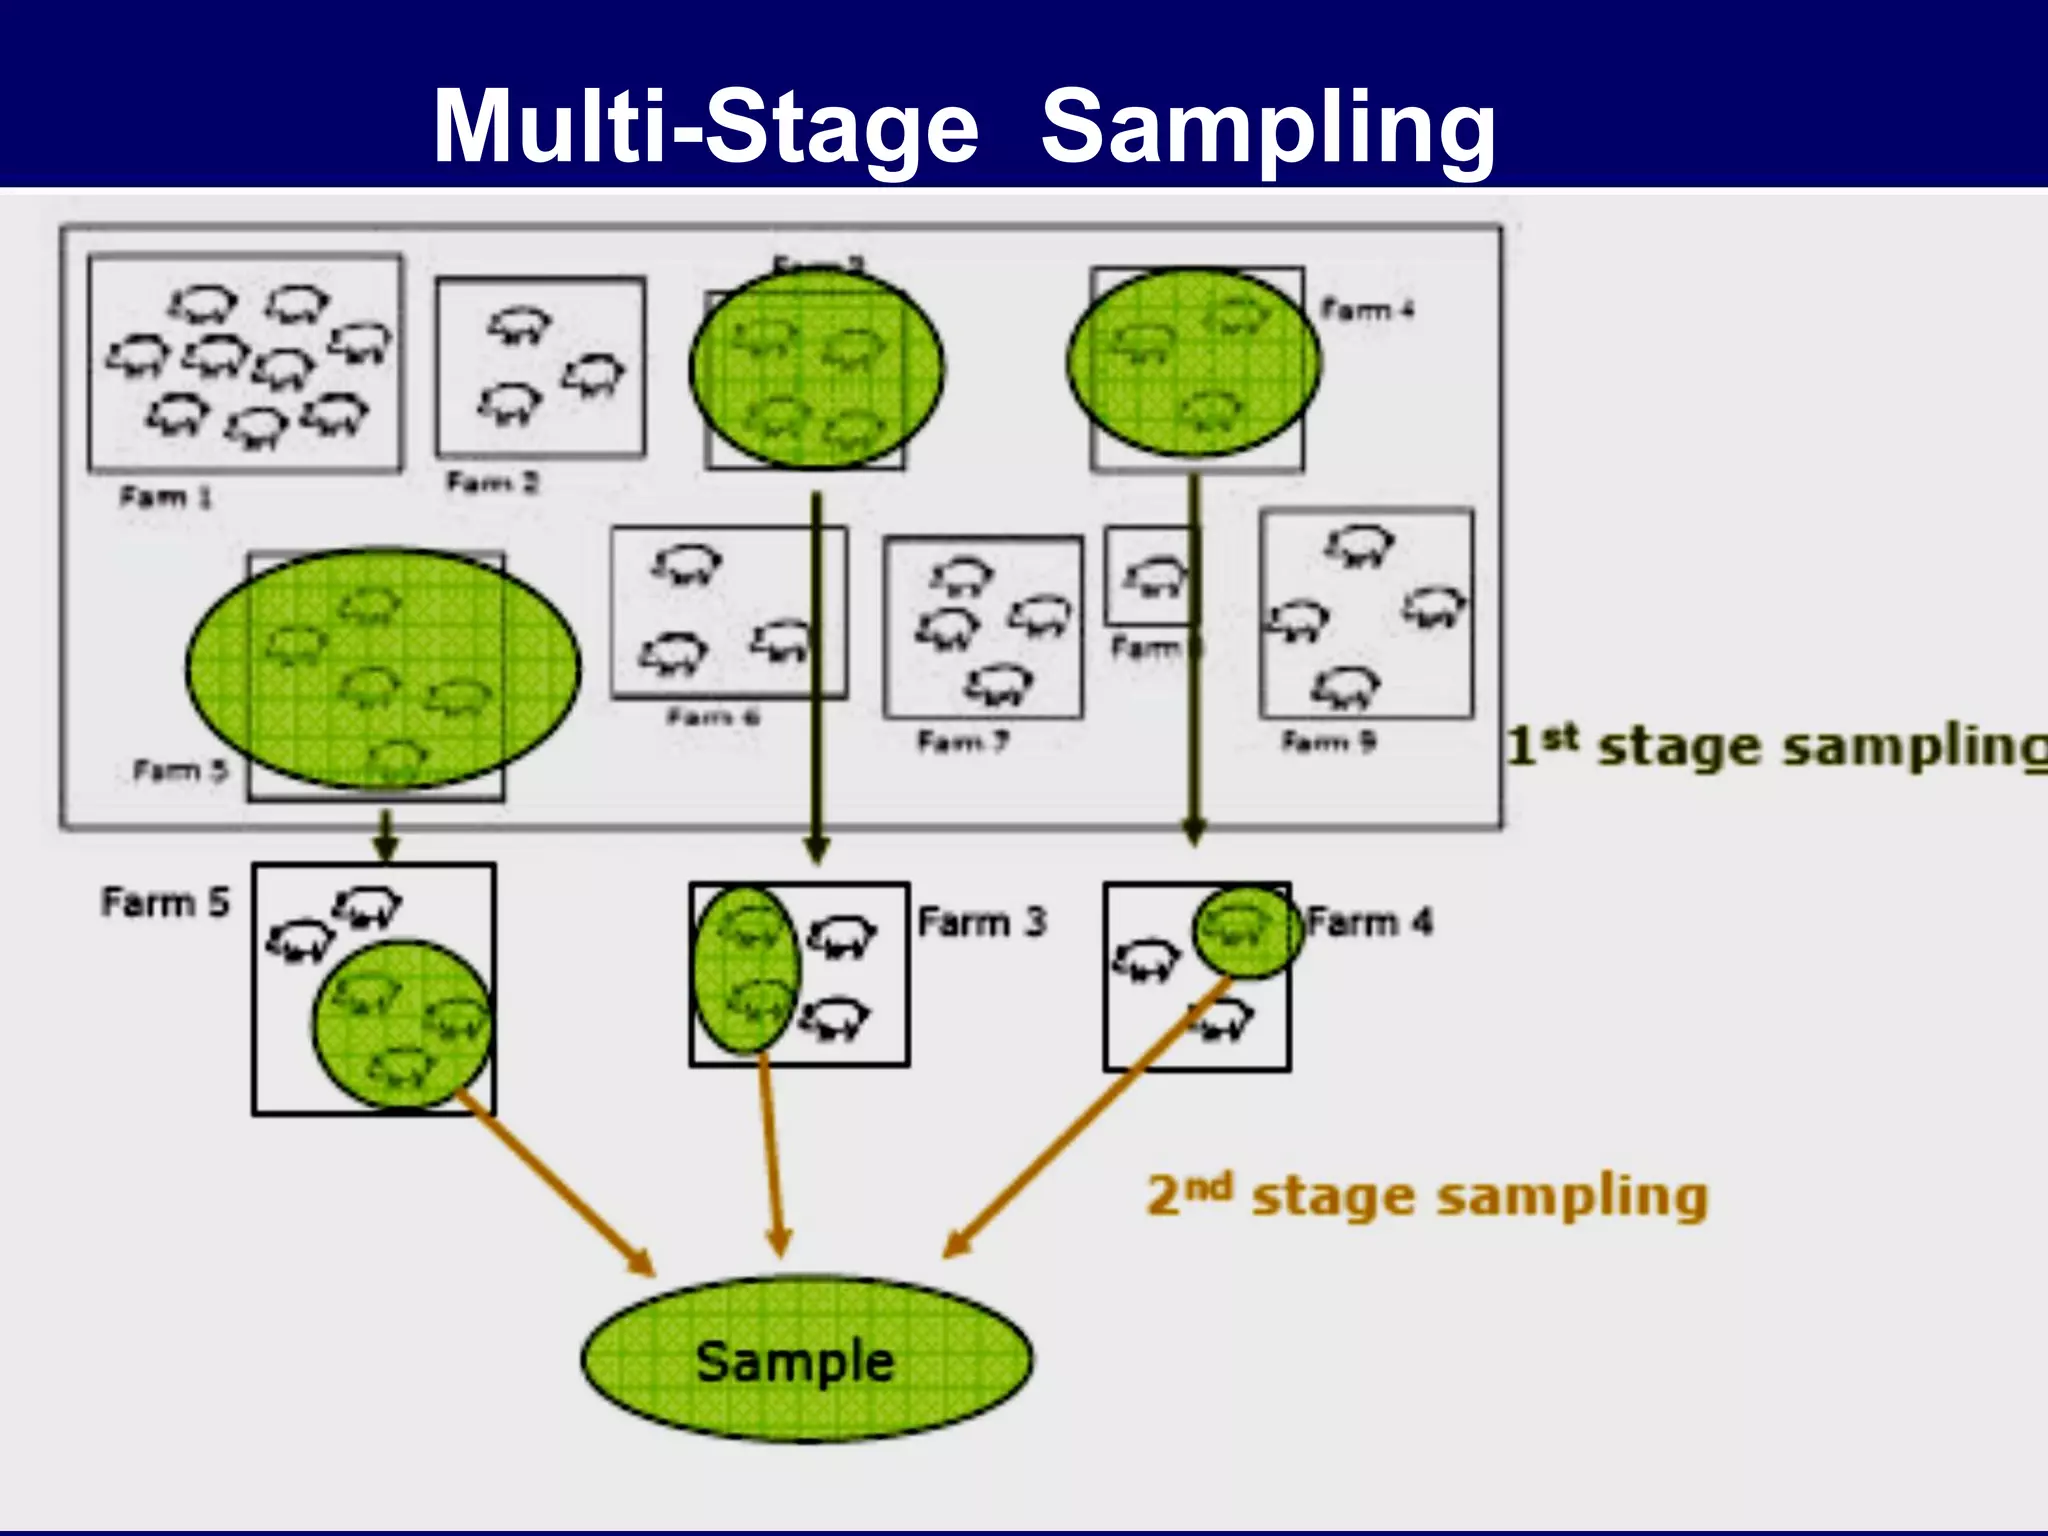
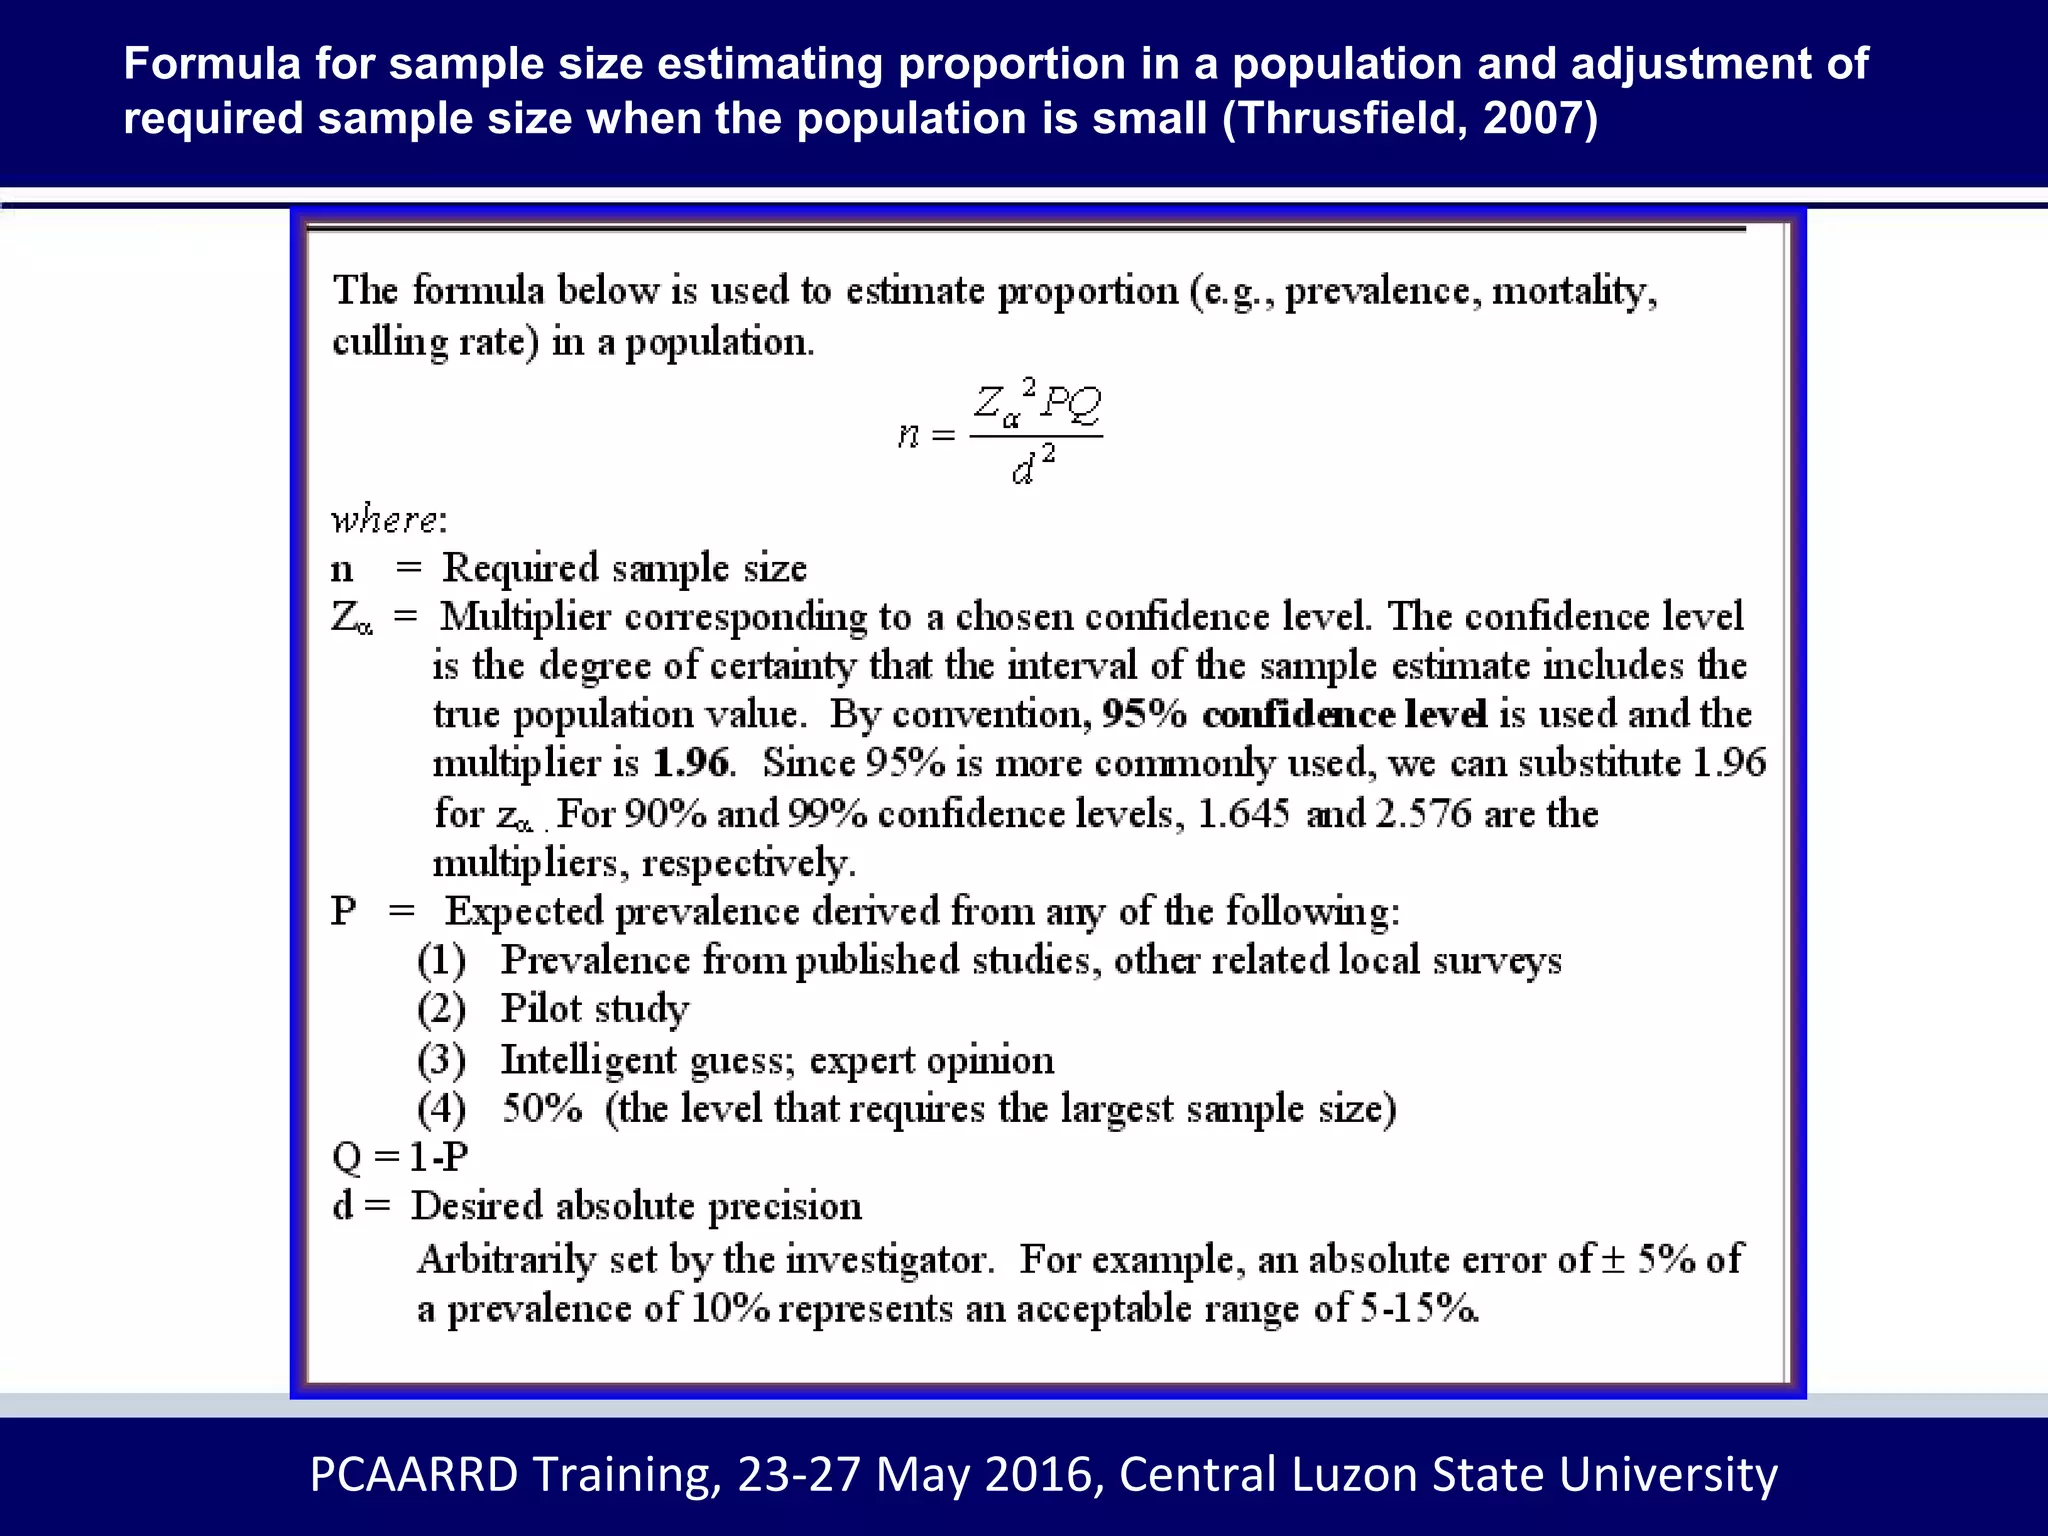
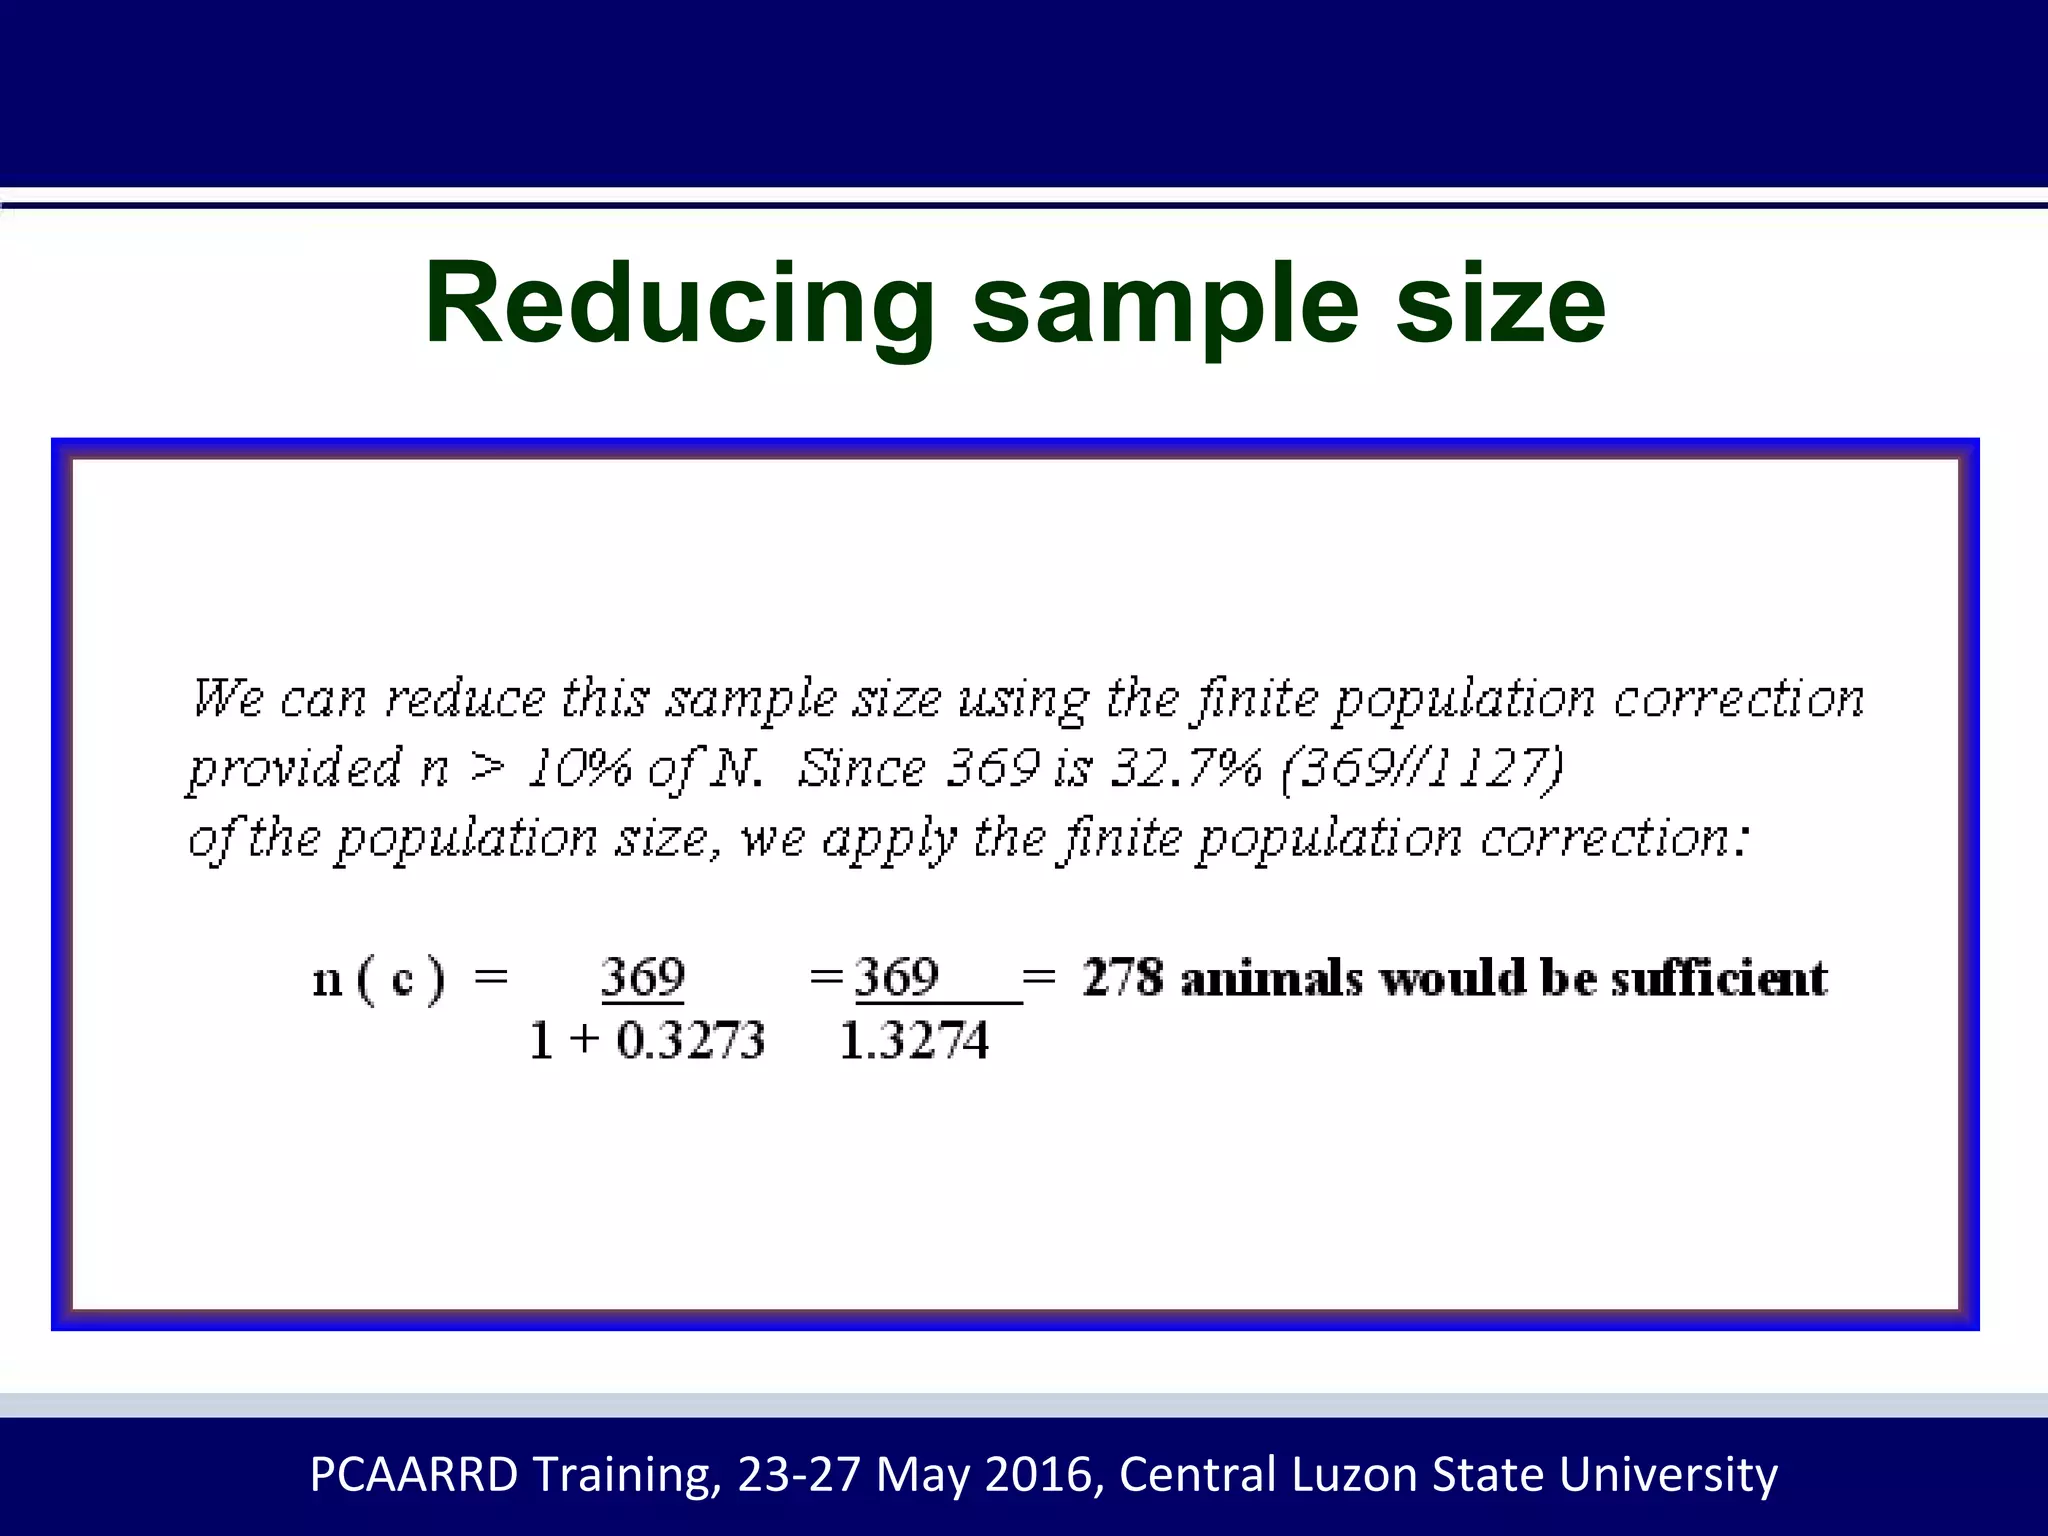
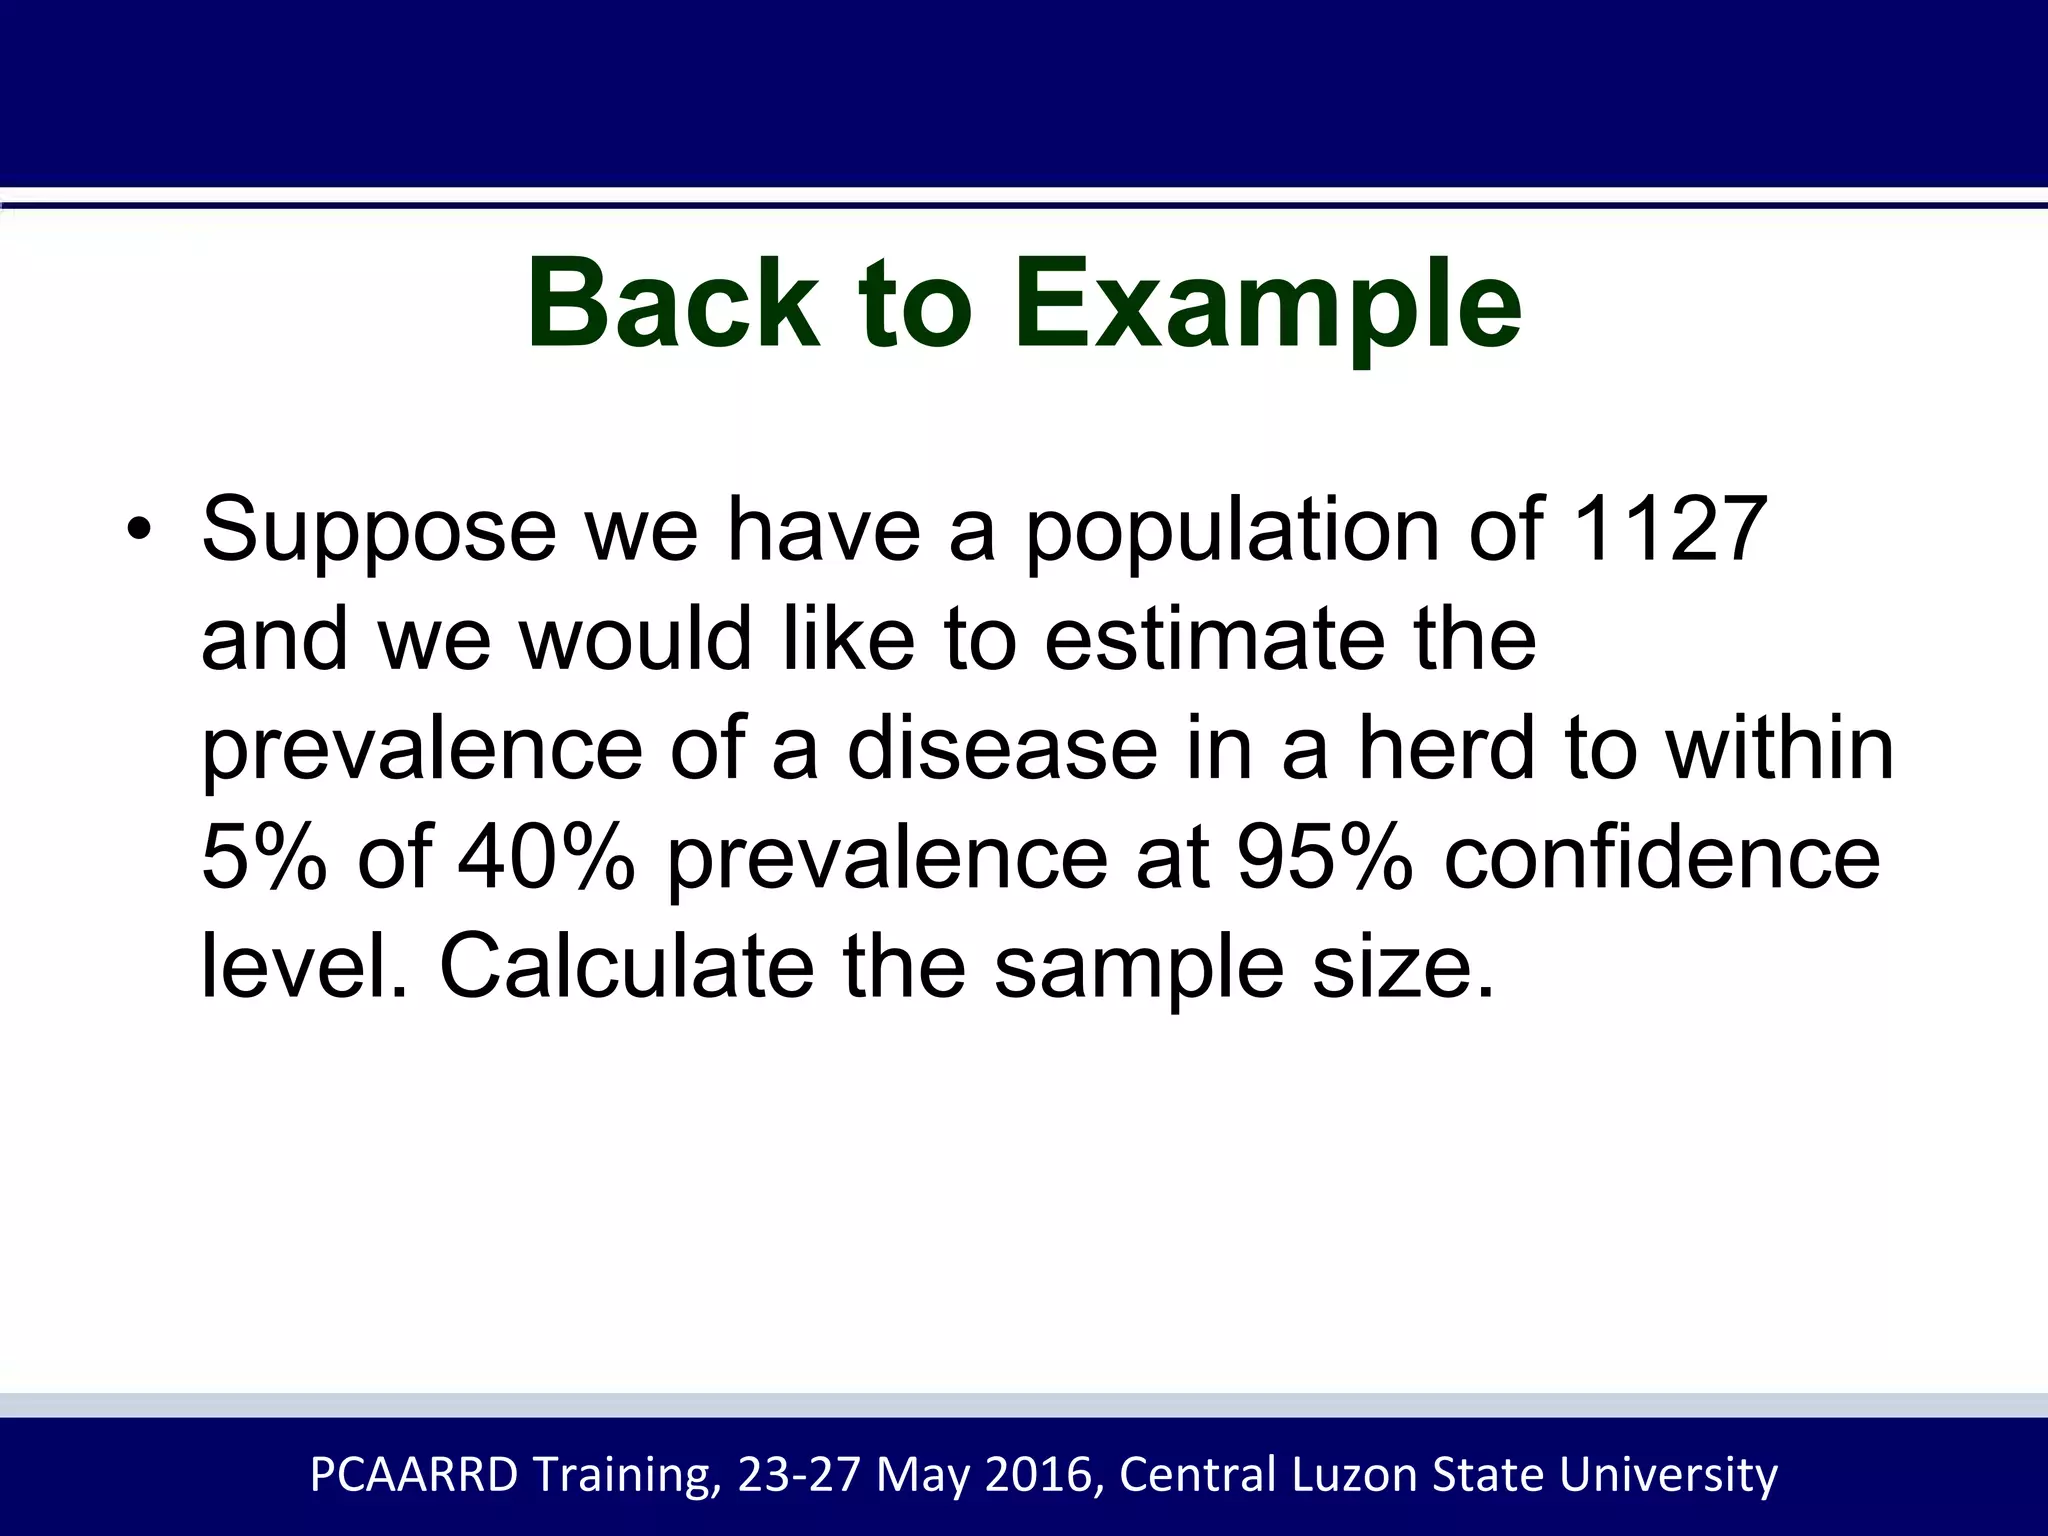
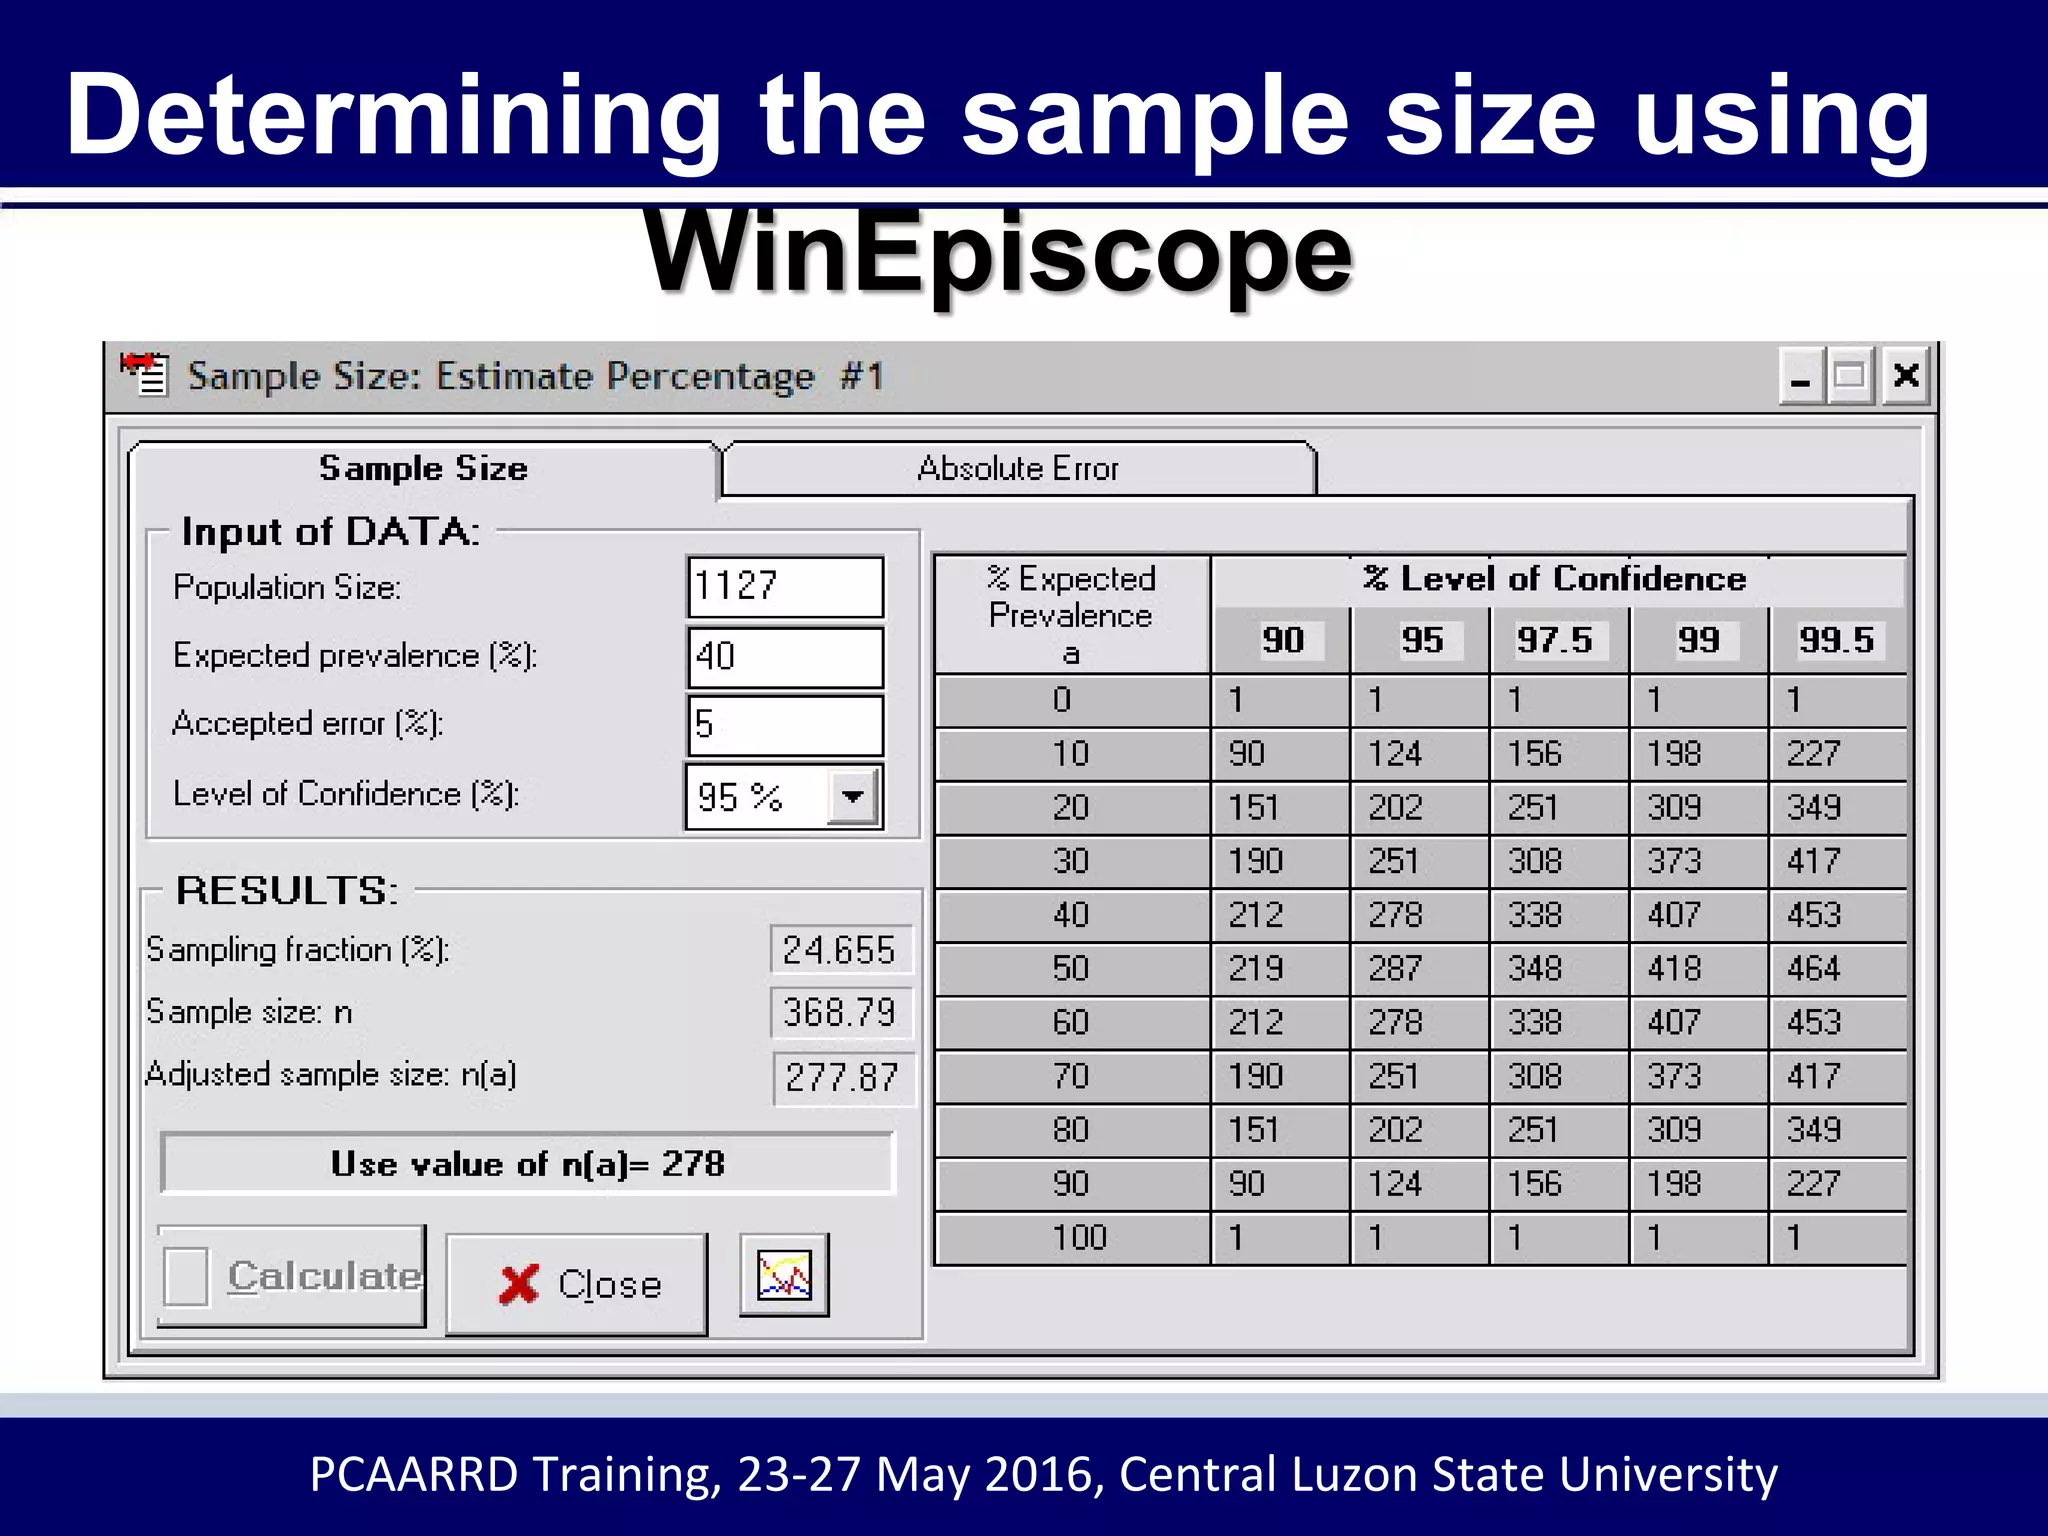
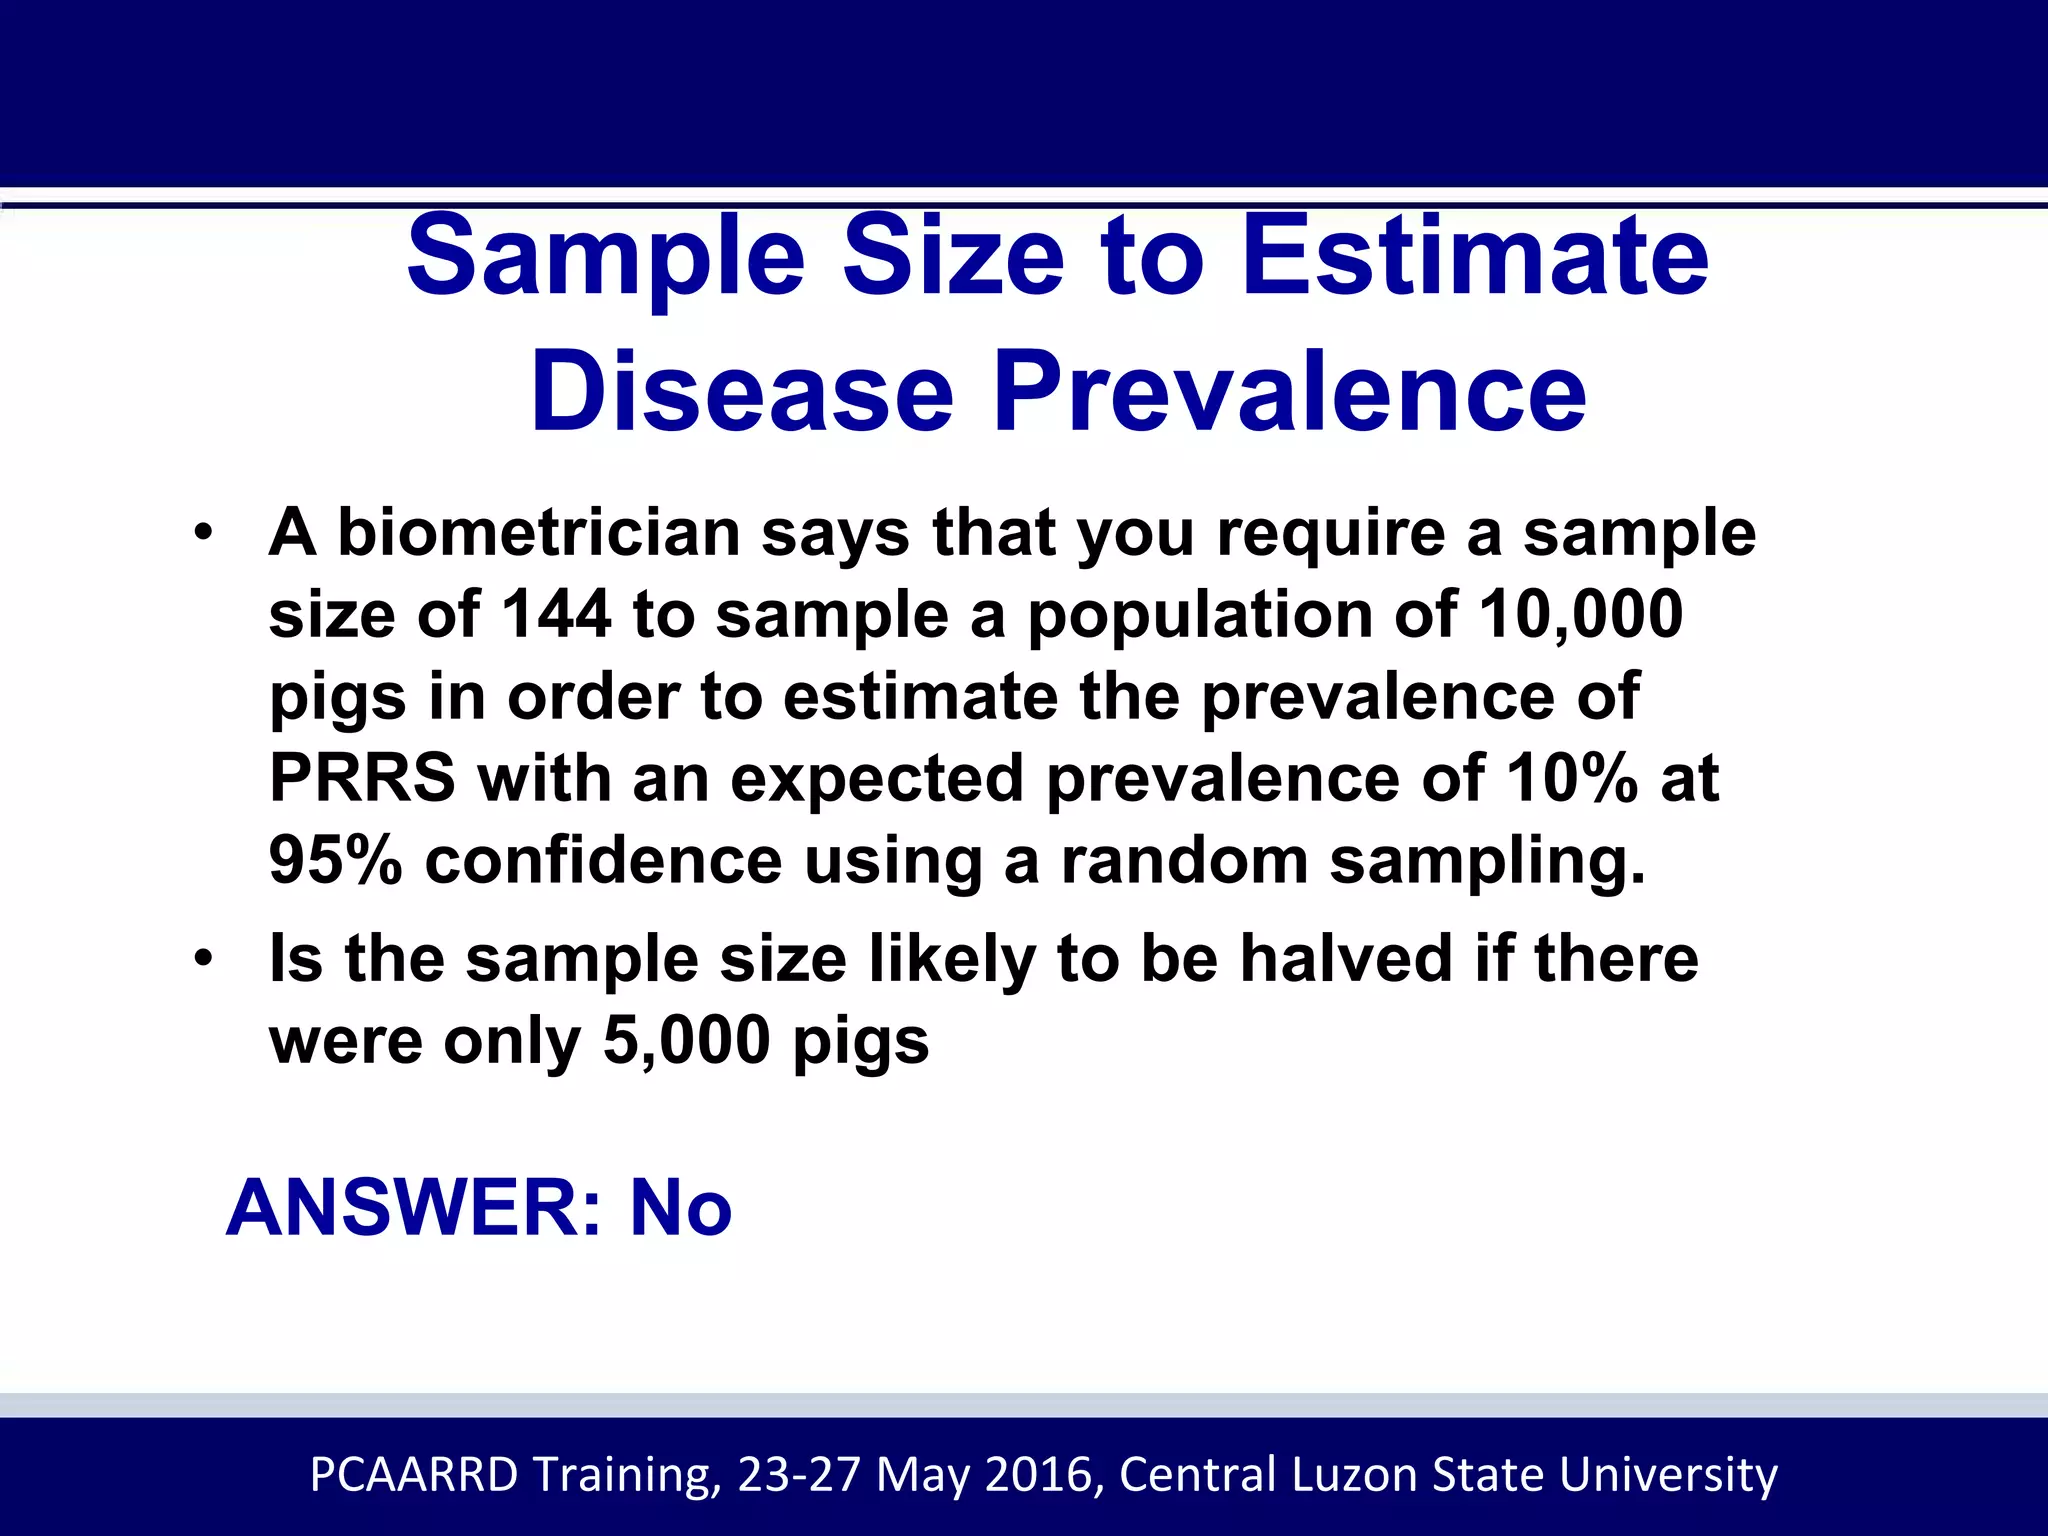
PCAARRD Training, 23-27 May 2016, Central Luzon State University
SAMPLING
Dr. Romeo S. Gundran
Professor
College of Veterinary Science and Medicine
Central Luzon State University
Surveillance of Important Swine Diseases
Objectives of the Study
1. To determine the level or distribution of PRRS,
PED and CSF.
2. To identify possible risk factors for the
occurrence of PRRS, PED and CSF among
commercial and backyard swine farms.
3. To assess the progress of control of PRRS,
PED and CSF.
PCAARRD Training, 23-27 May 2016, Central Luzon State University
Questions
1. How many serum samples are needed in
the surveillance study? How would you
calculate the sample size?
2. What sampling strategy would you use?
3. If you will collect samples from both
commercial and backyard farms, how will
you do it?
PCAARRD Training, 23-27 May 2016, Central Luzon State University
Population
Sample
Estimate Prevalence
Estimate Herd Immunity
Investigate Risk Factors
Prove Disease Freedom
Why Sample?
1. Practical considerations
e.g. cost, time, manpower
2. Laboratory capacity
3. Difficulty in analyzing huge amounts
of data
4. Samples can produce precise results
PCAARRD Training, 23-27 May 2016, Central Luzon State University
The Sampling Process
Target Population
Study Population
Sample
PCAARRD Training, 23-27 May 2016, Central Luzon State University
The population where
the sample is drawn
True representatives
of the population
The population
Presence
of ERROR
- defined as a
difference with
respect to the
true value
SAMPLEPopulation
PCAARRD Training, 23-27 May 2016, Central Luzon State University
The estimate should be extremely close to the true population parameter
being measured, with an error as little as possible
Goal: Accuracy of Measurement
• Sampling frame - master list of all sampling
units in the study population, and is an essential
requirement for probability sampling
• Sampling unit - the individual members of the
sampling frame, e.g. herd, farm, people,
animals, flock, litter, place, etc.
• Sampling fraction is calculated as the ratio
between sample size and study population
• Confidence Interval – measure of sampling
variability
• Precision and Validity
Some Terminologies
PCAARRD Training, 23-27 May 2016, Central Luzon State University
Sampling Frame
Population
Sampling Frame
(Master List)
Sample
PCAARRD Training, 23-27 May 2016, Central Luzon State University
A Cross-Sectional Study to
Illustrate Precision
• A certain barangay has 4500 pigs. A
random sample of 20 pigs was chosen for a
survey designed to measure the proportion
of pigs that has been vaccinated for HC.
Blood samples were taken and antibody
levels measured. Fifteen of the 20 pigs
(75%) have positive antibodies to HC. It is
therefore estimated that the proportion of
pigs with antibodies is 75%.
PCAARRD Training, 23-27 May 2016, Central Luzon State University
Graph showing the 95% confidence interval
as a measure of precision
20 Pigs
2000 Pigs
PCAARRD Training, 23-27 May 2016, Central Luzon State University
Confidence Interval
Interpretations
1. The best estimate of the true prevalence is 75%,
but even if this is wrong, one can be 95%
confident that it lies between 51% and 91%.
2. The “95% confident” also means that if the
same survey will be repeated 100 times, even
though different estimates will be obtained each
time, the true value would lie in confidence
interval 95 times out of 100
PCAARRD Training, 23-27 May 2016, Central Luzon State University
Precision
and
Validity
SAMPLING
METHODS
PCAARRD Training, 23-27 May 2016, Central Luzon State University
SAMPLING METHODS
• Probability (random) sampling - a formal,
impartial way of sampling in which every unit
in the population has a known, equal non-
zero chance of being included in the sample,
and that chance can be quantified.
• Non-probability sampling - no formal
process of selecting a sample is done and as
such, every unit in a population does not
have an equal chance of being selected.
PCAARRD Training, 23-27 May 2016, Central Luzon State University
Convenience Purposive Random Systematic
First five pigs
selected
Small pigs
selected for ease
Random numbers
used to select pigs
Second pig selected with
random number, then
every fourth pig selected
Examples of Non-Probability
Sampling
Examples of
Probability Sampling
Selection Bias
SAMPLEPopulation
•Failure to use random selection
•Sample not being representative
A systematic error due to a study of
nonrandom (NOT representative) sample
Probability Sampling
PCAARRD Training, 23-27 May 2016, Central Luzon State University
Simple Random Sampling
• An impartial method of selecting the
members of the population in a way
that each unit is equally likely to be
chosen.
• List of all members of the
population of interest is required
• Methods?
PCAARRD Training, 23-27 May 2016, Central Luzon State University
Calculator/Computer
PCAARRD Training, 23-27 May 2016, Central Luzon State University
Exercise
• Open MS Excel and generate
random numbers
PCAARRD Training, 23-27 May 2016, Central Luzon State University
Exercise
• Open Survey Toolbox and
generate random animals
PCAARRD Training, 23-27 May 2016, Central Luzon State University
Systematic Random Sampling
• Random selection of sampling
units at a pre-determined interval
after randomly selecting the first
member as the starting point.
• sampling interval: N/n
PCAARRD Training, 23-27 May 2016, Central Luzon State University
Stratified Random Sampling
• Selection of sampling units from
non-overlapping subgroups called
strata using SRS or other
probability sampling method until
the required sample size is
attained.
PCAARRD Training, 23-27 May 2016, Central Luzon State University
Stratified Random Sampling
PCAARRD Training, 23-27 May 2016, Central Luzon State University
Stratified Sampling
• Effective method for reducing
variance, if a known factor causes
significant variation
• Two populations of buffalo cows
with different milk production
performance
• To be effective at reducing
variation, the elements within the
strata should be homogeneous
PCAARRD Training, 23-27 May 2016, Central Luzon State University
Probability
Proportional
to Size
Sampling
Technique
PCAARRD Training, 23-27 May 2016, Central Luzon State University
Multistage Sampling
• Sampling in two or more stages
from within large groups and
selecting a sample from the group.
• Example:
1st Stage - selection of towns
2nd Stage - selection of farms
3rd Stage - selection of animals
PCAARRD Training, 23-27 May 2016, Central Luzon State University
Multi-Stage Sampling
Cluster Sampling
• The population is divided into
groups or clusters.
• A number of clusters are selected
randomly, and then
• all units within selected clusters are
sampled.
PCAARRD Training, 23-27 May 2016, Central Luzon State University
Cluster Sampling
PCAARRD Training, 23-27 May 2016, Central Luzon State University
SAMPLE SIZE
DETERMINATION
PCAARRD Training, 23-27 May 2016, Central Luzon State University
Calculating Sample Size
1.Using the Formula
2.Using the Sample Size Table
3.Using Computer Software
PCAARRD Training, 23-27 May 2016, Central Luzon State University
Sample Size to
Estimate Disease
Prevalence
PCAARRD Training, 23-27 May 2016, Central Luzon State University
Formula for sample size estimating proportion in a population and adjustment of
required sample size when the population is small (Thrusfield, 2007)
PCAARRD Training, 23-27 May 2016, Central Luzon State University
Reducing the required sample size using
finite population correction factor
1+f
PCAARRD Training, 23-27 May 2016, Central Luzon State University
Example
1+0.96
PCAARRD Training, 23-27 May 2016, Central Luzon State University
Table of sample size for estimation of proportion in a population at fixed
levels of confidence and accuracy and varying expected proportion
10% 10% 5% 1%5% 1%
PCAARRD Training, 23-27 May 2016, Central Luzon State University
Use of a table of sample size for sample size
estimation of proportion in a population
Reducing sample size
PCAARRD Training, 23-27 May 2016, Central Luzon State University
Back to Example
• Suppose we have a population of 1127
and we would like to estimate the
prevalence of a disease in a herd to within
5% of 40% prevalence at 95% confidence
level. Calculate the sample size.
PCAARRD Training, 23-27 May 2016, Central Luzon State University
Determining the sample size using
WinEpiscope
PCAARRD Training, 23-27 May 2016, Central Luzon State University
Sample Size to Estimate Disease
Prevalence
• A biometrician says that you require a sample
size of 144 to sample a population of 10,000
pigs in order to estimate the prevalence of
PRRS with an expected prevalence of 10% at
95% confidence using a random sampling.
• Is the sample size likely to be halved if there
were only 5,000 pigs
ANSWER: ______
PCAARRD Training, 23-27 May 2016, Central Luzon State University
Sample Size to Estimate
Disease Prevalence
ANSWER: No
• A biometrician says that you require a sample
size of 144 to sample a population of 10,000
pigs in order to estimate the prevalence of
PRRS with an expected prevalence of 10% at
95% confidence using a random sampling.
• Is the sample size likely to be halved if there
were only 5,000 pigs
PCAARRD Training, 23-27 May 2016, Central Luzon State University
Sample Size to Detect
Disease or Confirm the
Absence of Disease
PCAARRD Training, 23-27 May 2016, Central Luzon State University
Use of Sample Size Formula
PCAARRD Training, 23-27 May 2016, Central Luzon State University
Sample Size estimation Using
Tables to Detect Presence
of disease
• A quick guide in determining
sample sizes
• Cannon & Roe (1982) tables
PCAARRD Training, 23-27 May 2016, Central Luzon State University
Sample size required for detecting disease at
95% confidence level (Canon & Roe, 1982)
Sample size estimation using table of sample size to detect presence of disease in a
population where the disease of interest is absent or its prevalence is minimally low
PCAARRD Training, 23-27 May 2016, Central Luzon State University
(3) Use of Software packages
• Examples:
WinEpiscope and
FreeCalc
PCAARRD Training, 23-27 May 2016, Central Luzon State University
Sample Size for Detection of Disease
in a Population
• Assume that in a population of 1000 swine,
there will be at least 10 pigs with atrophic
rhinitis, if it is present at all.
• What is the sample size required to be 95%
(and 99%) sure of detecting at least one pig
with rhinitis?
ANSWER: 258 and 368
From: Martin et al, 1977
PCAARRD Training, 23-27 May 2016, Central Luzon State University
Sample size determination to detect disease
PCAARRD Training, 23-27 May 2016, Central Luzon State University
Sample size adjustment using FreeCalc program.
Reminders
1. The sample size is maximum when
Prevalence is estimated at 50%. This
value can be used when you have no idea
about the real prevalence.
2. It’s advisable to take a small absolute
precision for small prevalence. For
example it’s more interesting to know
that the prevalence of the population is
4% +/- 1% than 4% +/- 5%
PCAARRD Training, 23-27 May 2016, Central Luzon State University
Thank
you!

Sampling

  • 1.
    PCAARRD Training, 23-27May 2016, Central Luzon State University SAMPLING Dr. Romeo S. Gundran Professor College of Veterinary Science and Medicine Central Luzon State University
  • 2.
    Surveillance of ImportantSwine Diseases Objectives of the Study 1. To determine the level or distribution of PRRS, PED and CSF. 2. To identify possible risk factors for the occurrence of PRRS, PED and CSF among commercial and backyard swine farms. 3. To assess the progress of control of PRRS, PED and CSF. PCAARRD Training, 23-27 May 2016, Central Luzon State University
  • 3.
    Questions 1. How manyserum samples are needed in the surveillance study? How would you calculate the sample size? 2. What sampling strategy would you use? 3. If you will collect samples from both commercial and backyard farms, how will you do it? PCAARRD Training, 23-27 May 2016, Central Luzon State University
  • 4.
    Population Sample Estimate Prevalence Estimate HerdImmunity Investigate Risk Factors Prove Disease Freedom
  • 5.
    Why Sample? 1. Practicalconsiderations e.g. cost, time, manpower 2. Laboratory capacity 3. Difficulty in analyzing huge amounts of data 4. Samples can produce precise results PCAARRD Training, 23-27 May 2016, Central Luzon State University
  • 6.
    The Sampling Process TargetPopulation Study Population Sample PCAARRD Training, 23-27 May 2016, Central Luzon State University The population where the sample is drawn True representatives of the population The population
  • 7.
    Presence of ERROR - definedas a difference with respect to the true value SAMPLEPopulation PCAARRD Training, 23-27 May 2016, Central Luzon State University The estimate should be extremely close to the true population parameter being measured, with an error as little as possible Goal: Accuracy of Measurement
  • 8.
    • Sampling frame- master list of all sampling units in the study population, and is an essential requirement for probability sampling • Sampling unit - the individual members of the sampling frame, e.g. herd, farm, people, animals, flock, litter, place, etc. • Sampling fraction is calculated as the ratio between sample size and study population • Confidence Interval – measure of sampling variability • Precision and Validity Some Terminologies PCAARRD Training, 23-27 May 2016, Central Luzon State University
  • 9.
    Sampling Frame Population Sampling Frame (MasterList) Sample PCAARRD Training, 23-27 May 2016, Central Luzon State University
  • 11.
    A Cross-Sectional Studyto Illustrate Precision • A certain barangay has 4500 pigs. A random sample of 20 pigs was chosen for a survey designed to measure the proportion of pigs that has been vaccinated for HC. Blood samples were taken and antibody levels measured. Fifteen of the 20 pigs (75%) have positive antibodies to HC. It is therefore estimated that the proportion of pigs with antibodies is 75%. PCAARRD Training, 23-27 May 2016, Central Luzon State University
  • 12.
    Graph showing the95% confidence interval as a measure of precision 20 Pigs 2000 Pigs PCAARRD Training, 23-27 May 2016, Central Luzon State University
  • 13.
    Confidence Interval Interpretations 1. Thebest estimate of the true prevalence is 75%, but even if this is wrong, one can be 95% confident that it lies between 51% and 91%. 2. The “95% confident” also means that if the same survey will be repeated 100 times, even though different estimates will be obtained each time, the true value would lie in confidence interval 95 times out of 100 PCAARRD Training, 23-27 May 2016, Central Luzon State University
  • 14.
  • 15.
    SAMPLING METHODS PCAARRD Training, 23-27May 2016, Central Luzon State University
  • 16.
    SAMPLING METHODS • Probability(random) sampling - a formal, impartial way of sampling in which every unit in the population has a known, equal non- zero chance of being included in the sample, and that chance can be quantified. • Non-probability sampling - no formal process of selecting a sample is done and as such, every unit in a population does not have an equal chance of being selected. PCAARRD Training, 23-27 May 2016, Central Luzon State University
  • 17.
    Convenience Purposive RandomSystematic First five pigs selected Small pigs selected for ease Random numbers used to select pigs Second pig selected with random number, then every fourth pig selected Examples of Non-Probability Sampling Examples of Probability Sampling
  • 18.
    Selection Bias SAMPLEPopulation •Failure touse random selection •Sample not being representative A systematic error due to a study of nonrandom (NOT representative) sample
  • 19.
    Probability Sampling PCAARRD Training,23-27 May 2016, Central Luzon State University
  • 20.
    Simple Random Sampling •An impartial method of selecting the members of the population in a way that each unit is equally likely to be chosen. • List of all members of the population of interest is required • Methods? PCAARRD Training, 23-27 May 2016, Central Luzon State University
  • 22.
    Calculator/Computer PCAARRD Training, 23-27May 2016, Central Luzon State University
  • 23.
    Exercise • Open MSExcel and generate random numbers PCAARRD Training, 23-27 May 2016, Central Luzon State University
  • 24.
    Exercise • Open SurveyToolbox and generate random animals PCAARRD Training, 23-27 May 2016, Central Luzon State University
  • 25.
    Systematic Random Sampling •Random selection of sampling units at a pre-determined interval after randomly selecting the first member as the starting point. • sampling interval: N/n PCAARRD Training, 23-27 May 2016, Central Luzon State University
  • 27.
    Stratified Random Sampling •Selection of sampling units from non-overlapping subgroups called strata using SRS or other probability sampling method until the required sample size is attained. PCAARRD Training, 23-27 May 2016, Central Luzon State University
  • 28.
    Stratified Random Sampling PCAARRDTraining, 23-27 May 2016, Central Luzon State University
  • 29.
    Stratified Sampling • Effectivemethod for reducing variance, if a known factor causes significant variation • Two populations of buffalo cows with different milk production performance • To be effective at reducing variation, the elements within the strata should be homogeneous PCAARRD Training, 23-27 May 2016, Central Luzon State University
  • 30.
    Probability Proportional to Size Sampling Technique PCAARRD Training,23-27 May 2016, Central Luzon State University
  • 31.
    Multistage Sampling • Samplingin two or more stages from within large groups and selecting a sample from the group. • Example: 1st Stage - selection of towns 2nd Stage - selection of farms 3rd Stage - selection of animals PCAARRD Training, 23-27 May 2016, Central Luzon State University
  • 32.
  • 33.
    Cluster Sampling • Thepopulation is divided into groups or clusters. • A number of clusters are selected randomly, and then • all units within selected clusters are sampled. PCAARRD Training, 23-27 May 2016, Central Luzon State University
  • 34.
    Cluster Sampling PCAARRD Training,23-27 May 2016, Central Luzon State University
  • 35.
    SAMPLE SIZE DETERMINATION PCAARRD Training,23-27 May 2016, Central Luzon State University
  • 36.
    Calculating Sample Size 1.Usingthe Formula 2.Using the Sample Size Table 3.Using Computer Software PCAARRD Training, 23-27 May 2016, Central Luzon State University
  • 37.
    Sample Size to EstimateDisease Prevalence PCAARRD Training, 23-27 May 2016, Central Luzon State University
  • 38.
    Formula for samplesize estimating proportion in a population and adjustment of required sample size when the population is small (Thrusfield, 2007) PCAARRD Training, 23-27 May 2016, Central Luzon State University
  • 39.
    Reducing the requiredsample size using finite population correction factor 1+f PCAARRD Training, 23-27 May 2016, Central Luzon State University
  • 40.
    Example 1+0.96 PCAARRD Training, 23-27May 2016, Central Luzon State University
  • 41.
    Table of samplesize for estimation of proportion in a population at fixed levels of confidence and accuracy and varying expected proportion 10% 10% 5% 1%5% 1% PCAARRD Training, 23-27 May 2016, Central Luzon State University
  • 42.
    Use of atable of sample size for sample size estimation of proportion in a population
  • 43.
    Reducing sample size PCAARRDTraining, 23-27 May 2016, Central Luzon State University
  • 44.
    Back to Example •Suppose we have a population of 1127 and we would like to estimate the prevalence of a disease in a herd to within 5% of 40% prevalence at 95% confidence level. Calculate the sample size. PCAARRD Training, 23-27 May 2016, Central Luzon State University
  • 45.
    Determining the samplesize using WinEpiscope PCAARRD Training, 23-27 May 2016, Central Luzon State University
  • 46.
    Sample Size toEstimate Disease Prevalence • A biometrician says that you require a sample size of 144 to sample a population of 10,000 pigs in order to estimate the prevalence of PRRS with an expected prevalence of 10% at 95% confidence using a random sampling. • Is the sample size likely to be halved if there were only 5,000 pigs ANSWER: ______ PCAARRD Training, 23-27 May 2016, Central Luzon State University
  • 47.
    Sample Size toEstimate Disease Prevalence ANSWER: No • A biometrician says that you require a sample size of 144 to sample a population of 10,000 pigs in order to estimate the prevalence of PRRS with an expected prevalence of 10% at 95% confidence using a random sampling. • Is the sample size likely to be halved if there were only 5,000 pigs PCAARRD Training, 23-27 May 2016, Central Luzon State University
  • 48.
    Sample Size toDetect Disease or Confirm the Absence of Disease PCAARRD Training, 23-27 May 2016, Central Luzon State University
  • 49.
    Use of SampleSize Formula PCAARRD Training, 23-27 May 2016, Central Luzon State University
  • 50.
    Sample Size estimationUsing Tables to Detect Presence of disease • A quick guide in determining sample sizes • Cannon & Roe (1982) tables PCAARRD Training, 23-27 May 2016, Central Luzon State University
  • 51.
    Sample size requiredfor detecting disease at 95% confidence level (Canon & Roe, 1982)
  • 52.
    Sample size estimationusing table of sample size to detect presence of disease in a population where the disease of interest is absent or its prevalence is minimally low PCAARRD Training, 23-27 May 2016, Central Luzon State University
  • 53.
    (3) Use ofSoftware packages • Examples: WinEpiscope and FreeCalc PCAARRD Training, 23-27 May 2016, Central Luzon State University
  • 54.
    Sample Size forDetection of Disease in a Population • Assume that in a population of 1000 swine, there will be at least 10 pigs with atrophic rhinitis, if it is present at all. • What is the sample size required to be 95% (and 99%) sure of detecting at least one pig with rhinitis? ANSWER: 258 and 368 From: Martin et al, 1977 PCAARRD Training, 23-27 May 2016, Central Luzon State University
  • 55.
    Sample size determinationto detect disease PCAARRD Training, 23-27 May 2016, Central Luzon State University
  • 56.
    Sample size adjustmentusing FreeCalc program.
  • 57.
    Reminders 1. The samplesize is maximum when Prevalence is estimated at 50%. This value can be used when you have no idea about the real prevalence. 2. It’s advisable to take a small absolute precision for small prevalence. For example it’s more interesting to know that the prevalence of the population is 4% +/- 1% than 4% +/- 5% PCAARRD Training, 23-27 May 2016, Central Luzon State University
  • 58.