Downloaded 65 times
![tics
Slide
1
Problem 1: Relationship between Two
Variables-1 (1)
First, identify two variables with which this
question is related. Here, the variables of
interest are [attend] and [sex].
Second, examine the direction of relationship. In
other words, for example, examine whether female
were “more” or “less” likely to attend religious
services more than once a week than male.](https://image.slidesharecdn.com/class9crosstabulation-150731095410-lva1-app6892/75/cross-tabulation-1-2048.jpg)
![tics
Slide
2
Problem 1: Relationship between Two
Variables-1 (2)
Furthermore, by now, you should be able
to identify that [sex] is an independent
variable and [attend] is a dependent
variable in this statement.
Now, let’s explore how to answer this
question using SPSS.](https://image.slidesharecdn.com/class9crosstabulation-150731095410-lva1-app6892/75/cross-tabulation-2-2048.jpg)
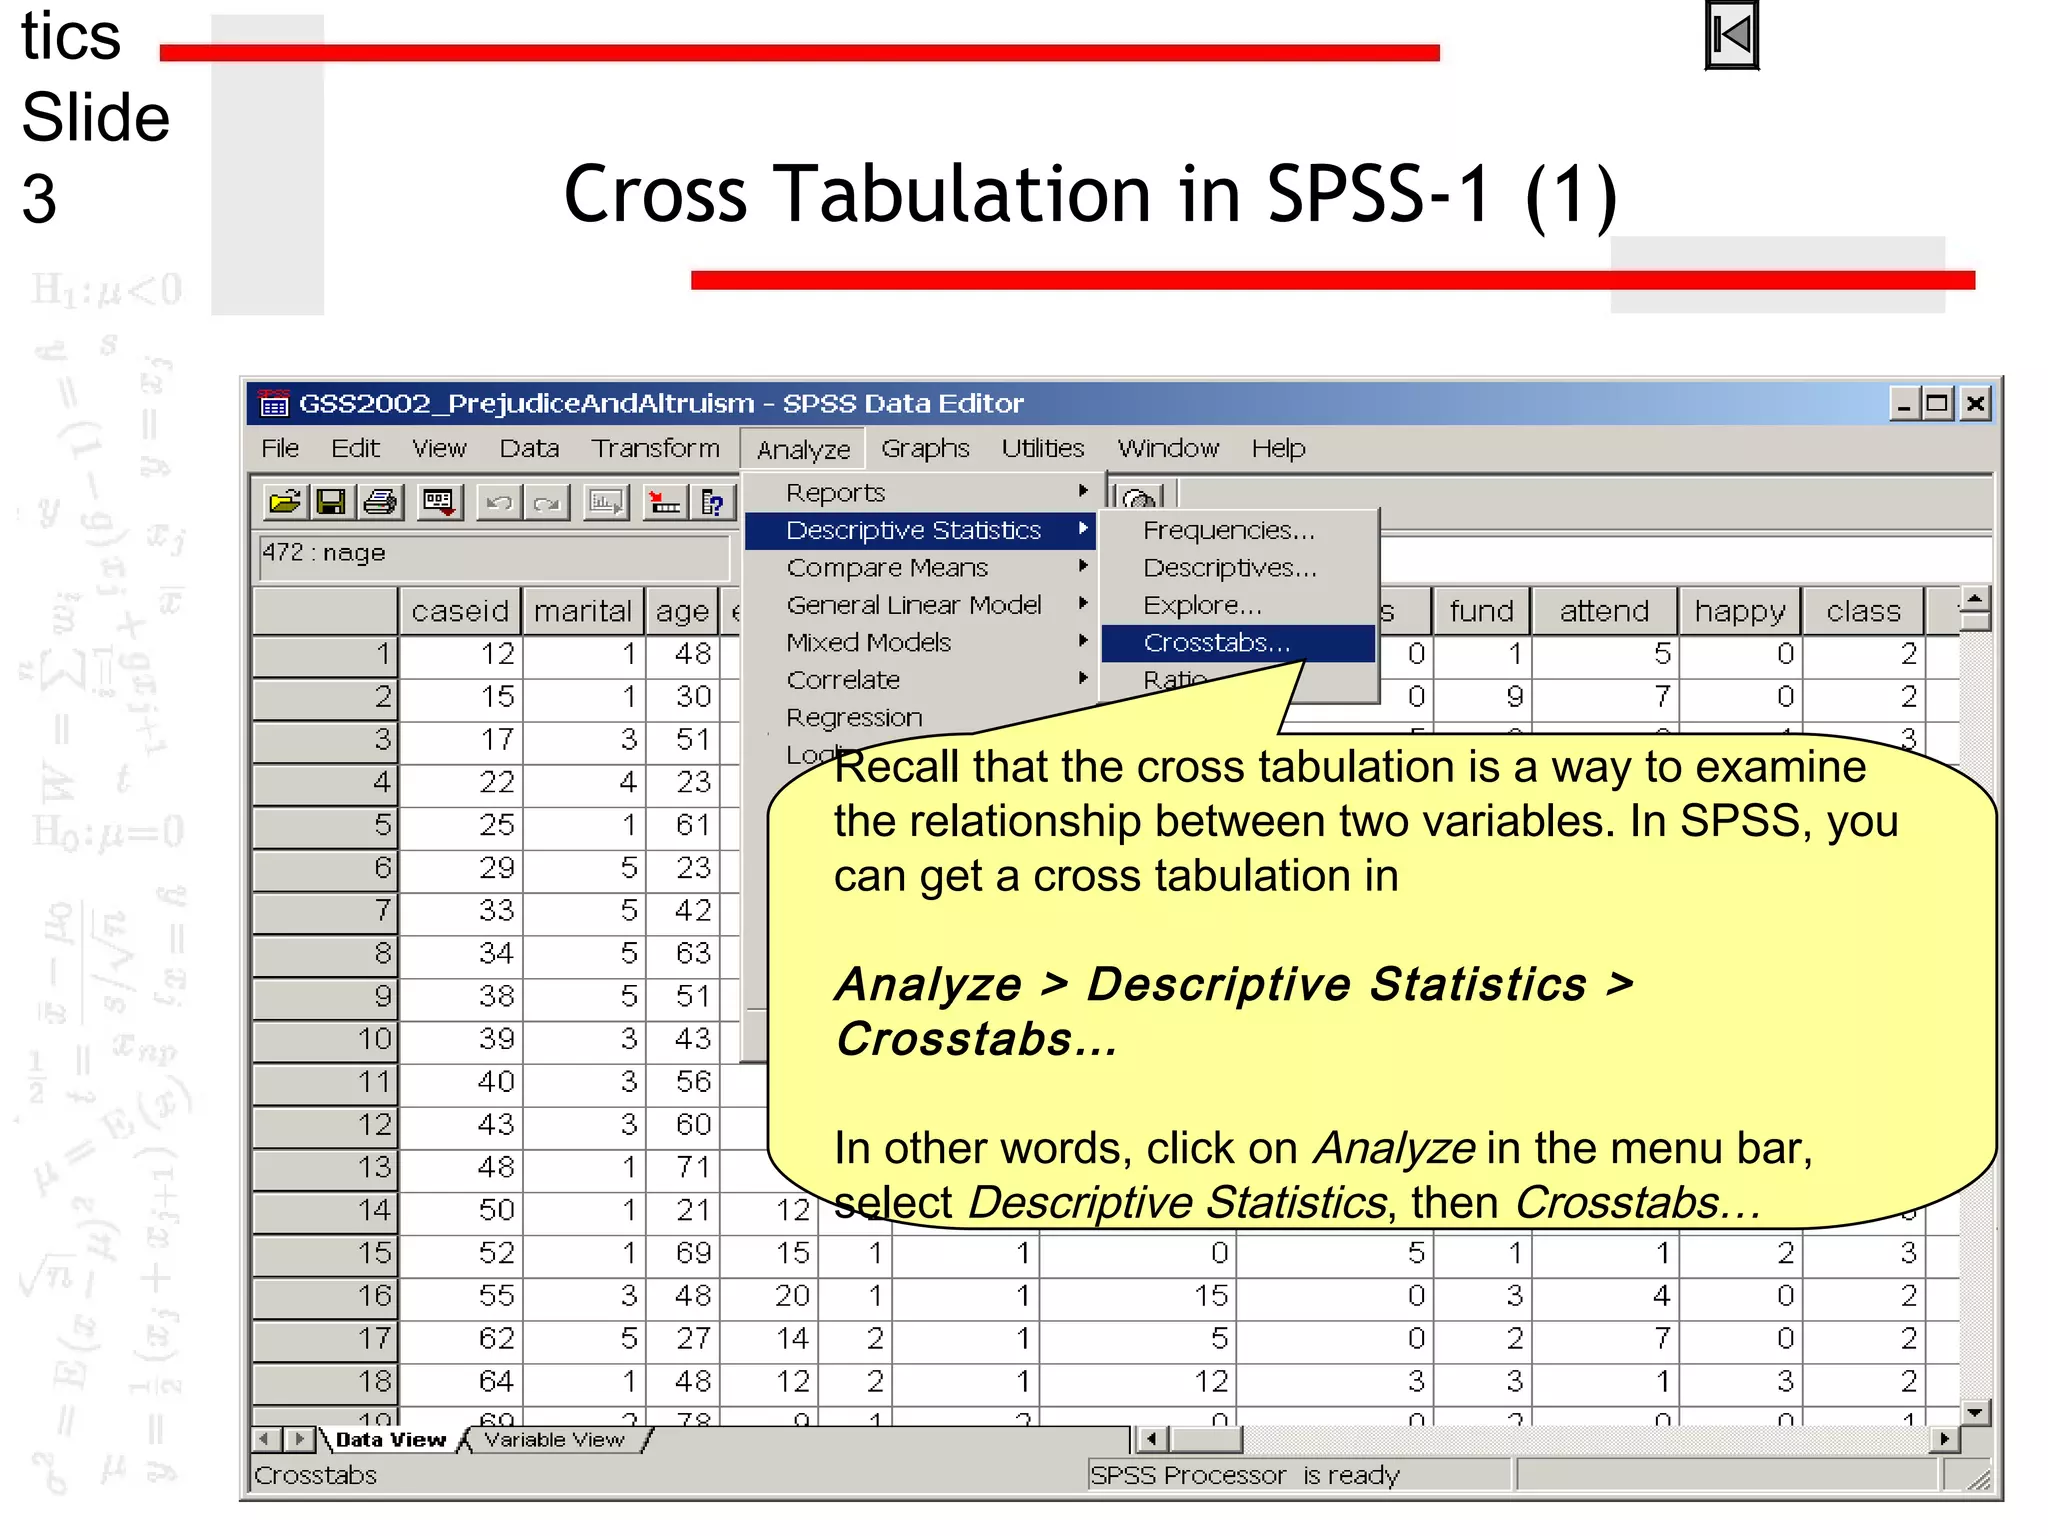
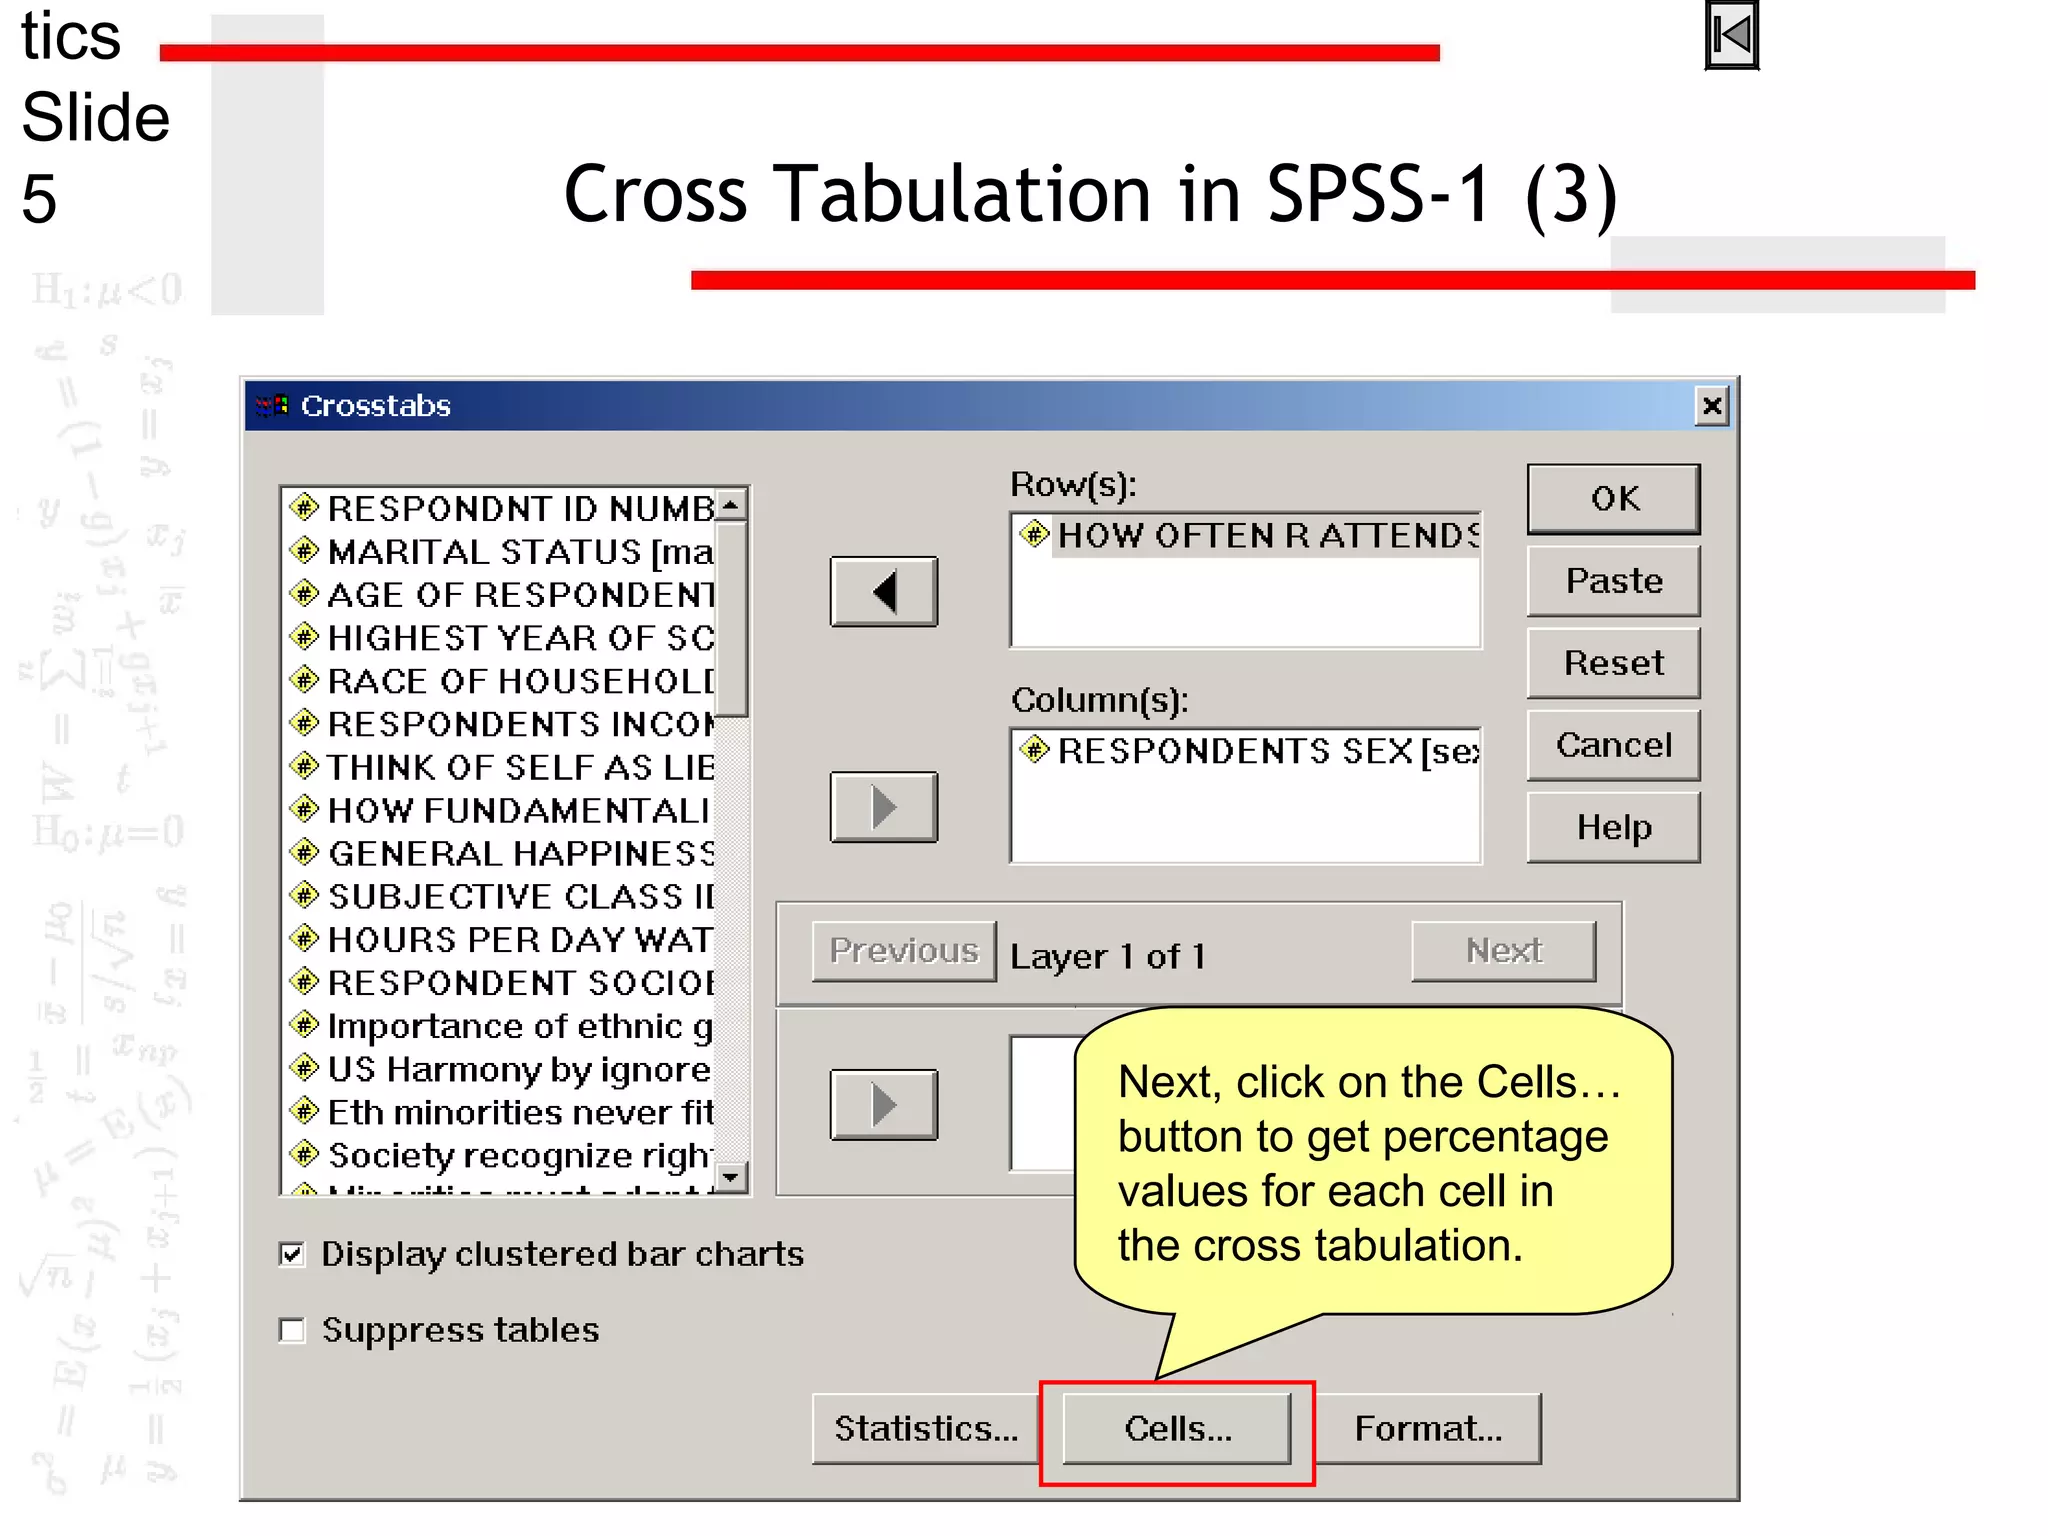
![tics
Slide
4 Cross Tabulation in SPSS-1 (2)
In the Crosstabs window, find and move the
independent and dependent variable to
Column(s): and Row(s): boxes, respectively. In
this case, the independent variable [sex] goes to
Column(s): box and the dependent variable
[attend] goes to Row(s): box.](https://image.slidesharecdn.com/class9crosstabulation-150731095410-lva1-app6892/75/cross-tabulation-4-2048.jpg)
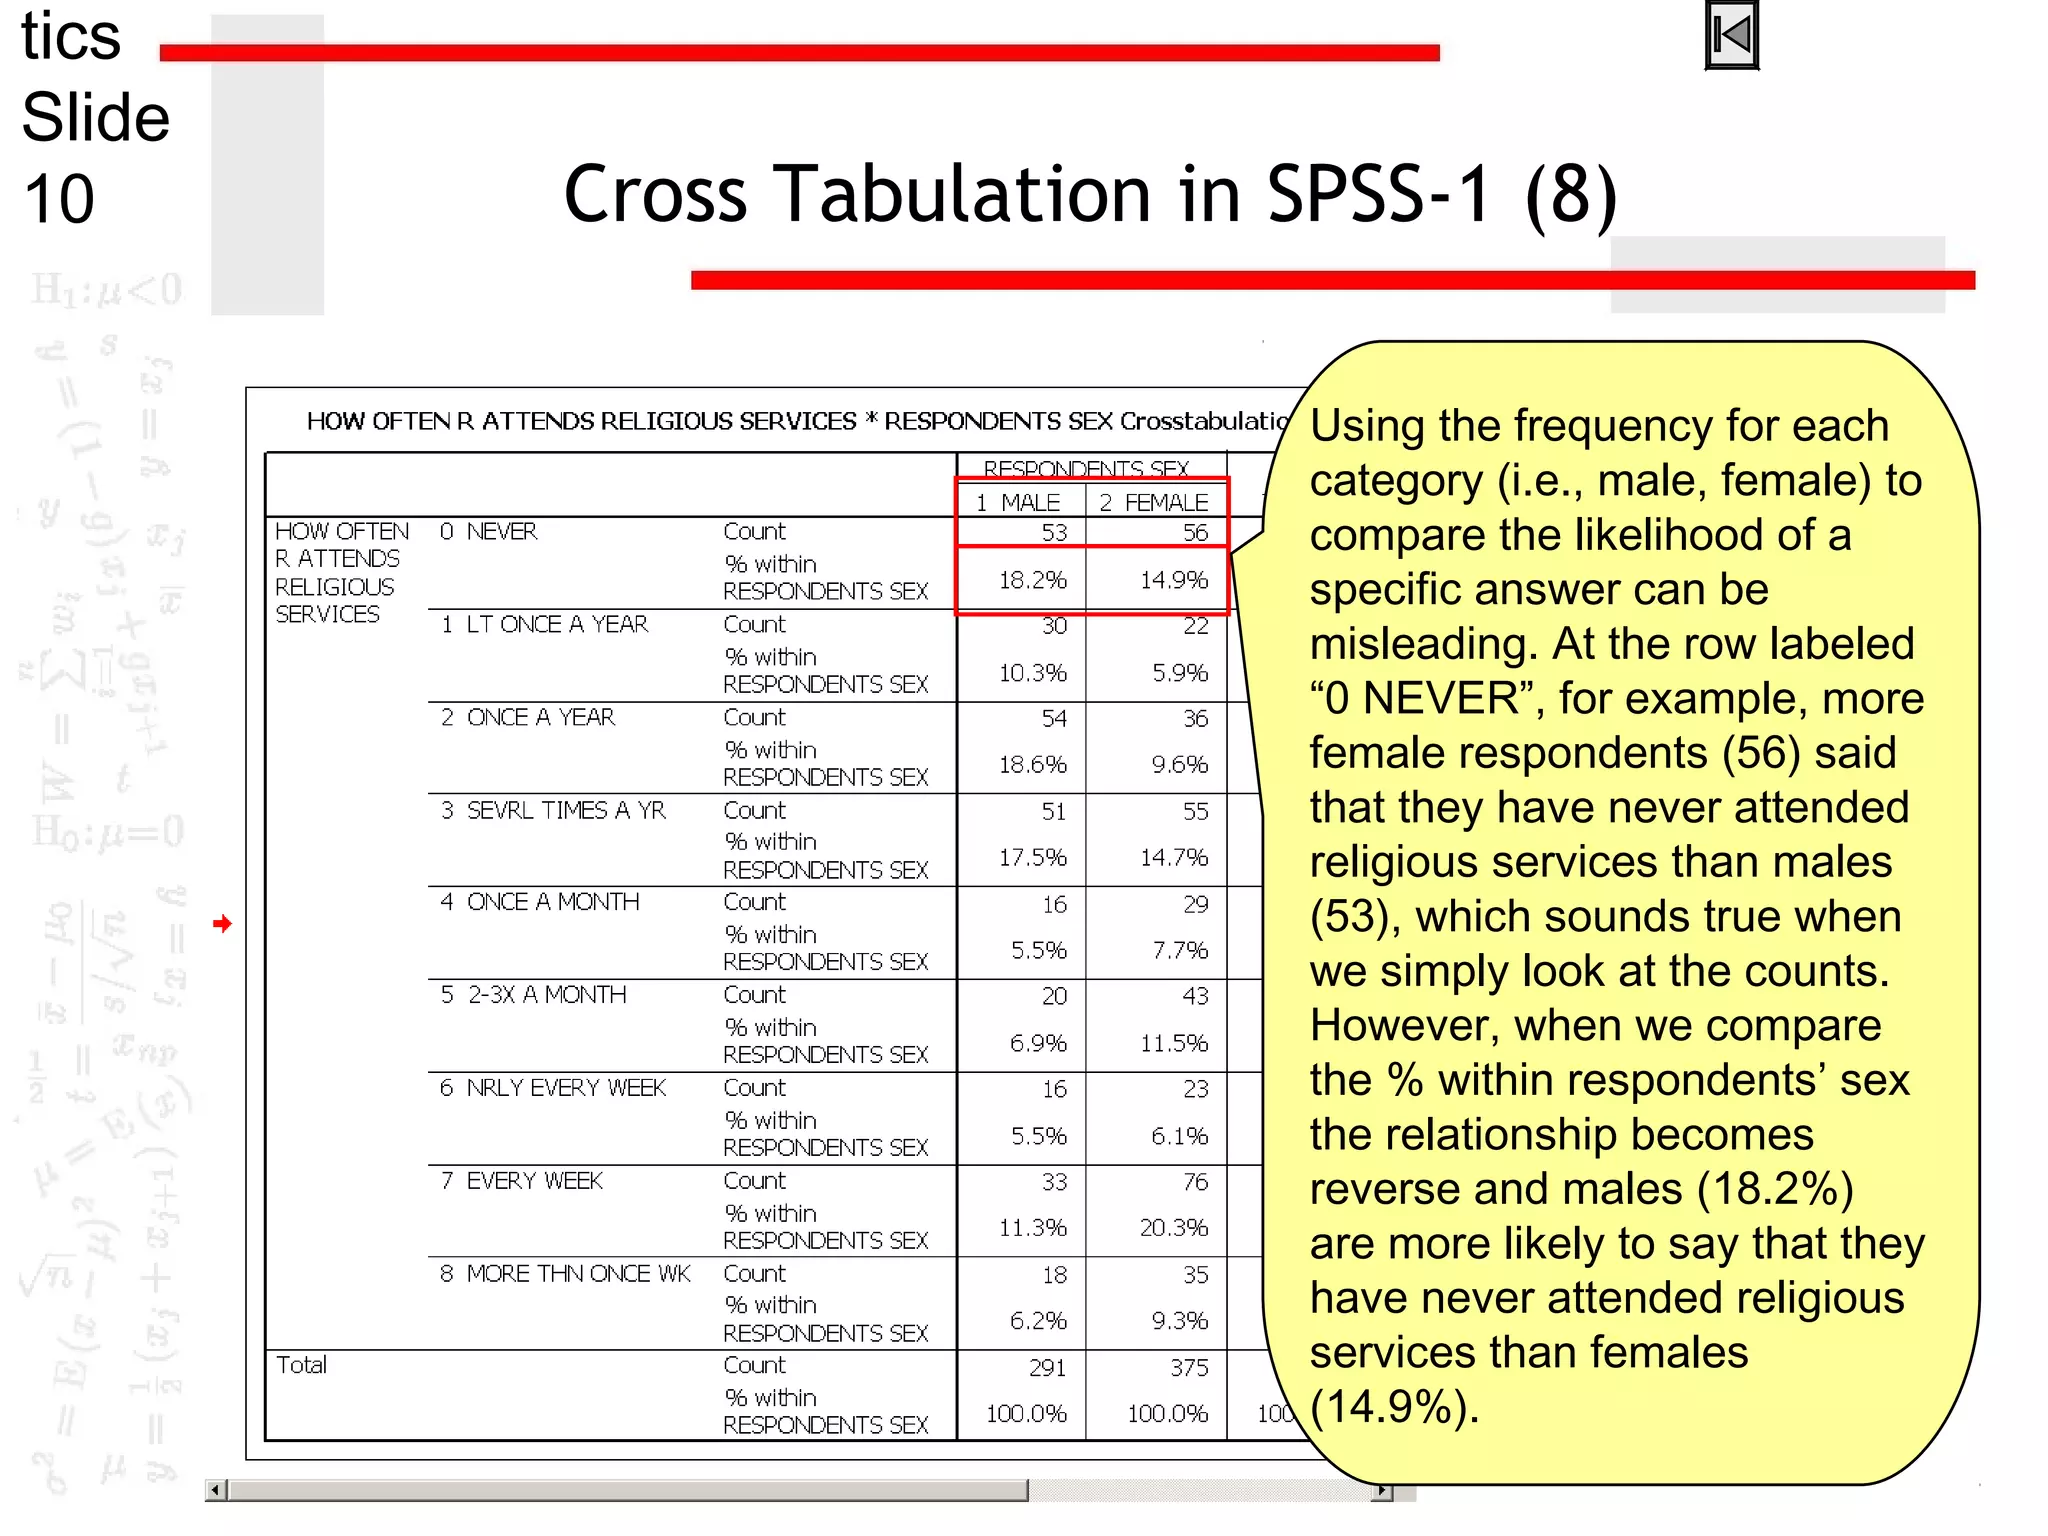
![tics
Slide
7 Cross Tabulation in SPSS-1 (5)
The output displays two
tables, one for case
processing summary
and the other for cross
tabulation of the two
variables. Notice that
[sex] is on the column
and [attend] is on the
row of the cross
tabulation as we
assigned.](https://image.slidesharecdn.com/class9crosstabulation-150731095410-lva1-app6892/75/cross-tabulation-7-2048.jpg)
![tics
Slide
8 Cross Tabulation in SPSS-1 (6)
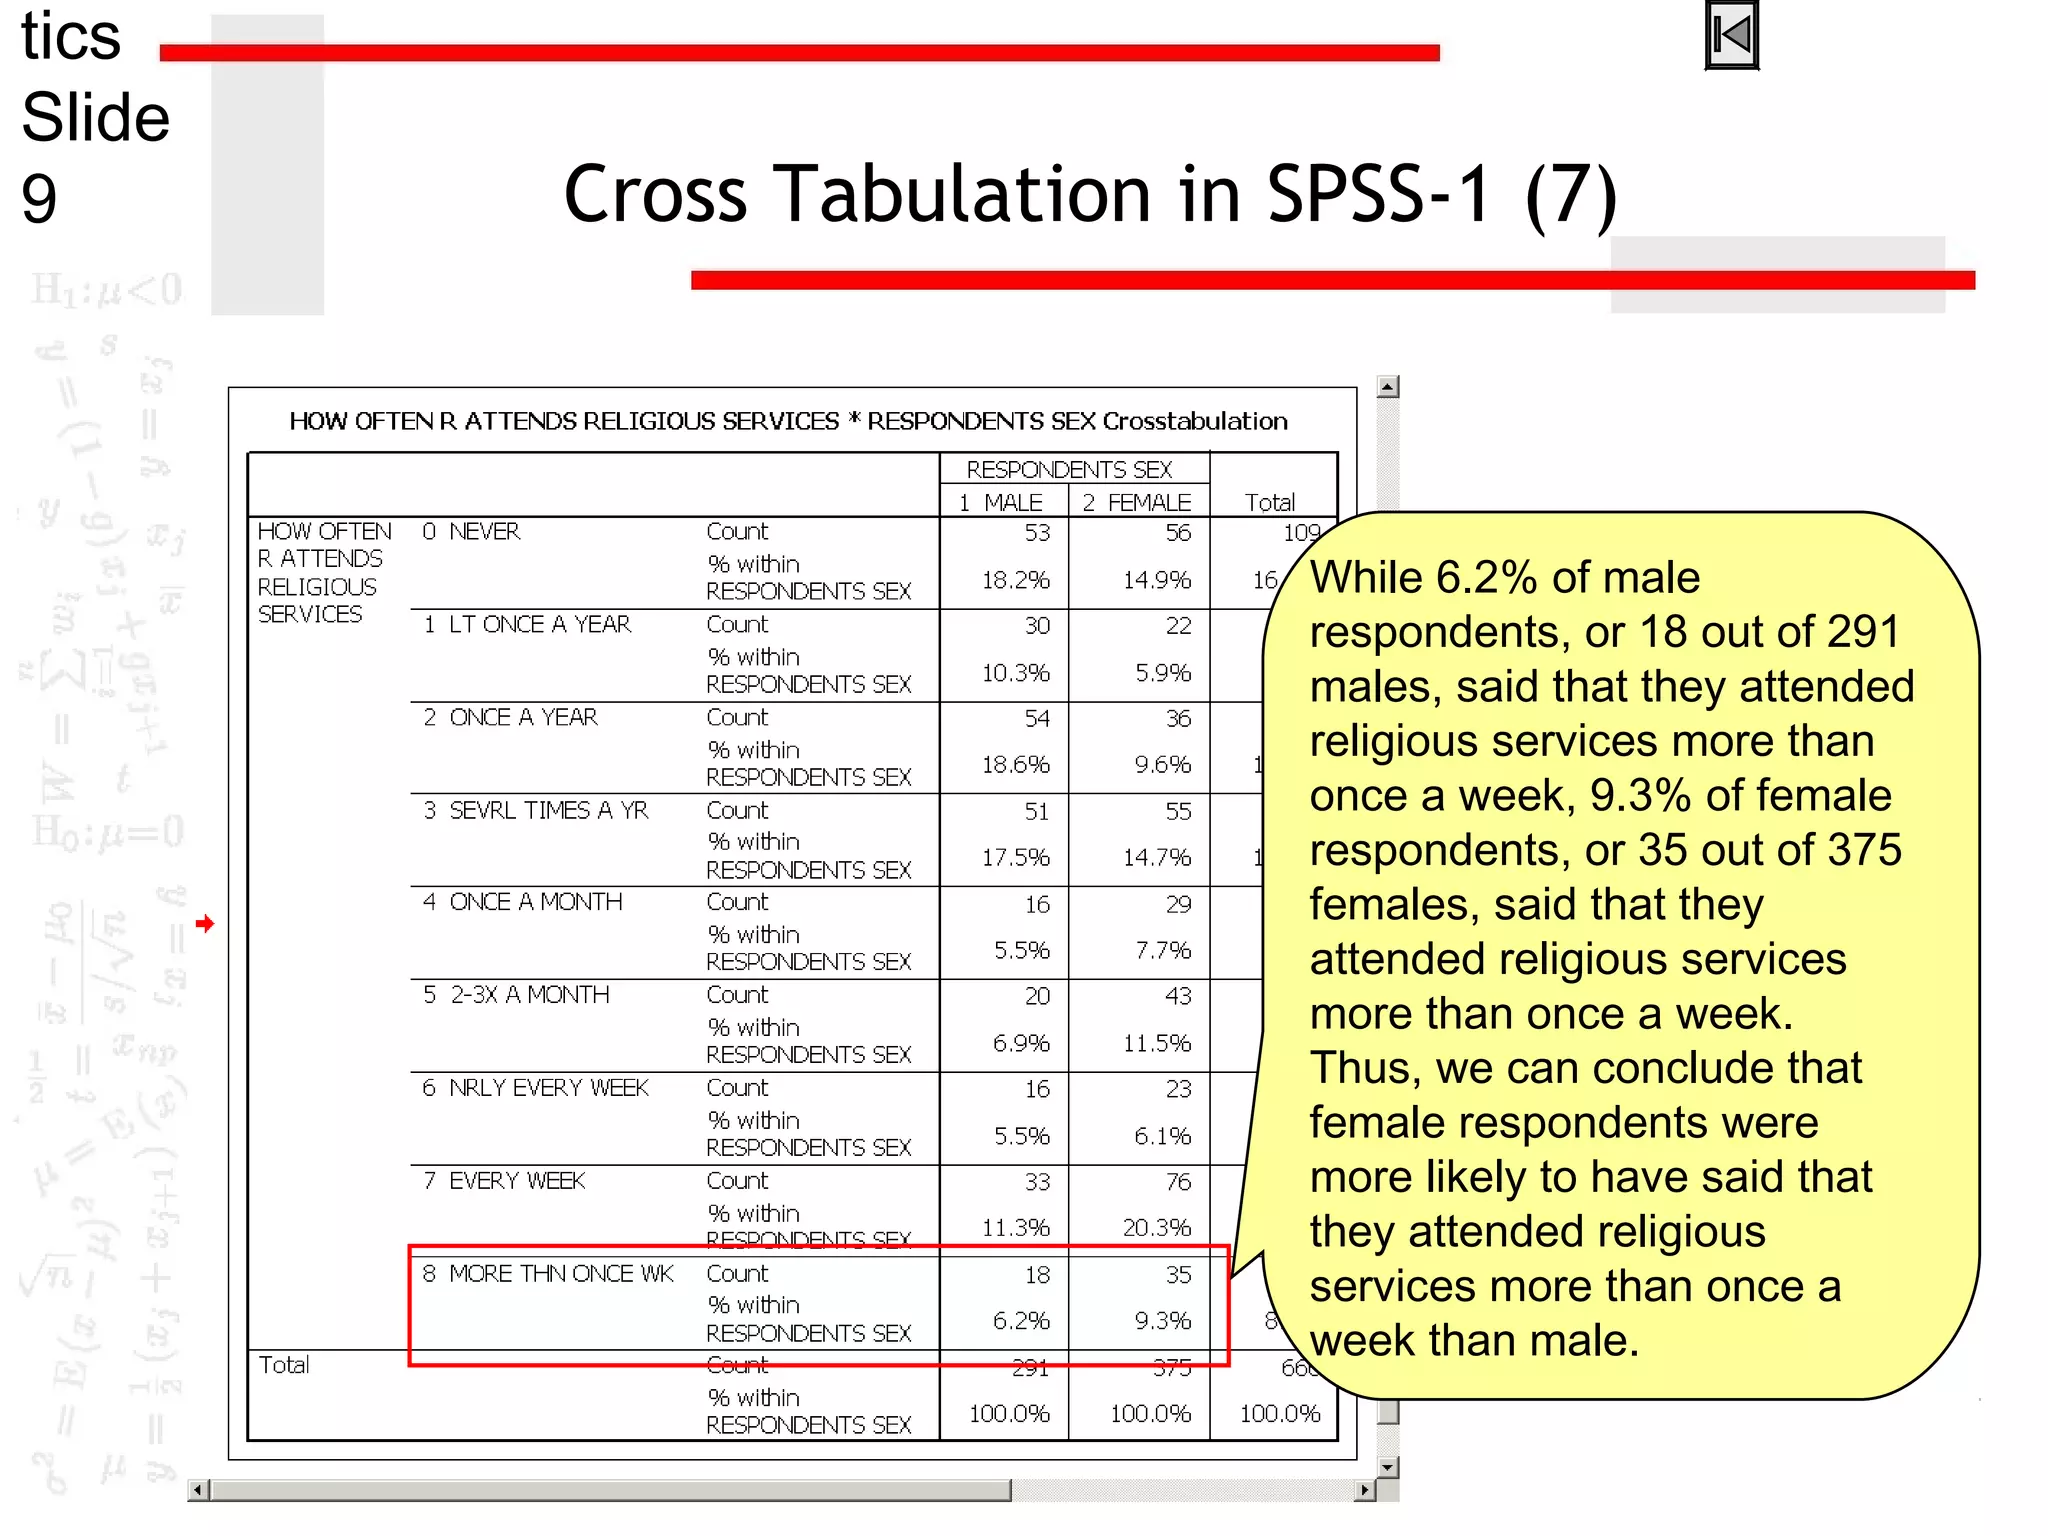
Also notice that the percentage
values were calculated by column
(i.e., [sex]). For example, the
percentage value on the row
labeled “8 MORE THAN ONCE
WK”, “% within RESPONDENTS
SEX”, in the column labeled “1
MALE” was obtained with the
count of the cell (18) divided by
the count of the males (291) (i.e.
18/291=6.2%). In other words,
6.2% of male respondents said
that they attended religious
services more than once a week.](https://image.slidesharecdn.com/class9crosstabulation-150731095410-lva1-app6892/75/cross-tabulation-8-2048.jpg)
![tics
Slide
11
Problem 2: Relationship between Two
Variables-2
This question is asking
whether there is a
relationship between
[sex] and [ethimp].
Again, you have to
know that [sex] is an
independent variable
and [ethimp] is a
dependent variable
here.](https://image.slidesharecdn.com/class9crosstabulation-150731095410-lva1-app6892/75/cross-tabulation-11-2048.jpg)
![tics
Slide
13 Cross Tabulation in SPSS-2 (2)
First, in the Crosstabs window,
find and move the independent
variable [sex] to Column(s): box
and the dependent variable
[ethimp] to Row(s): box.
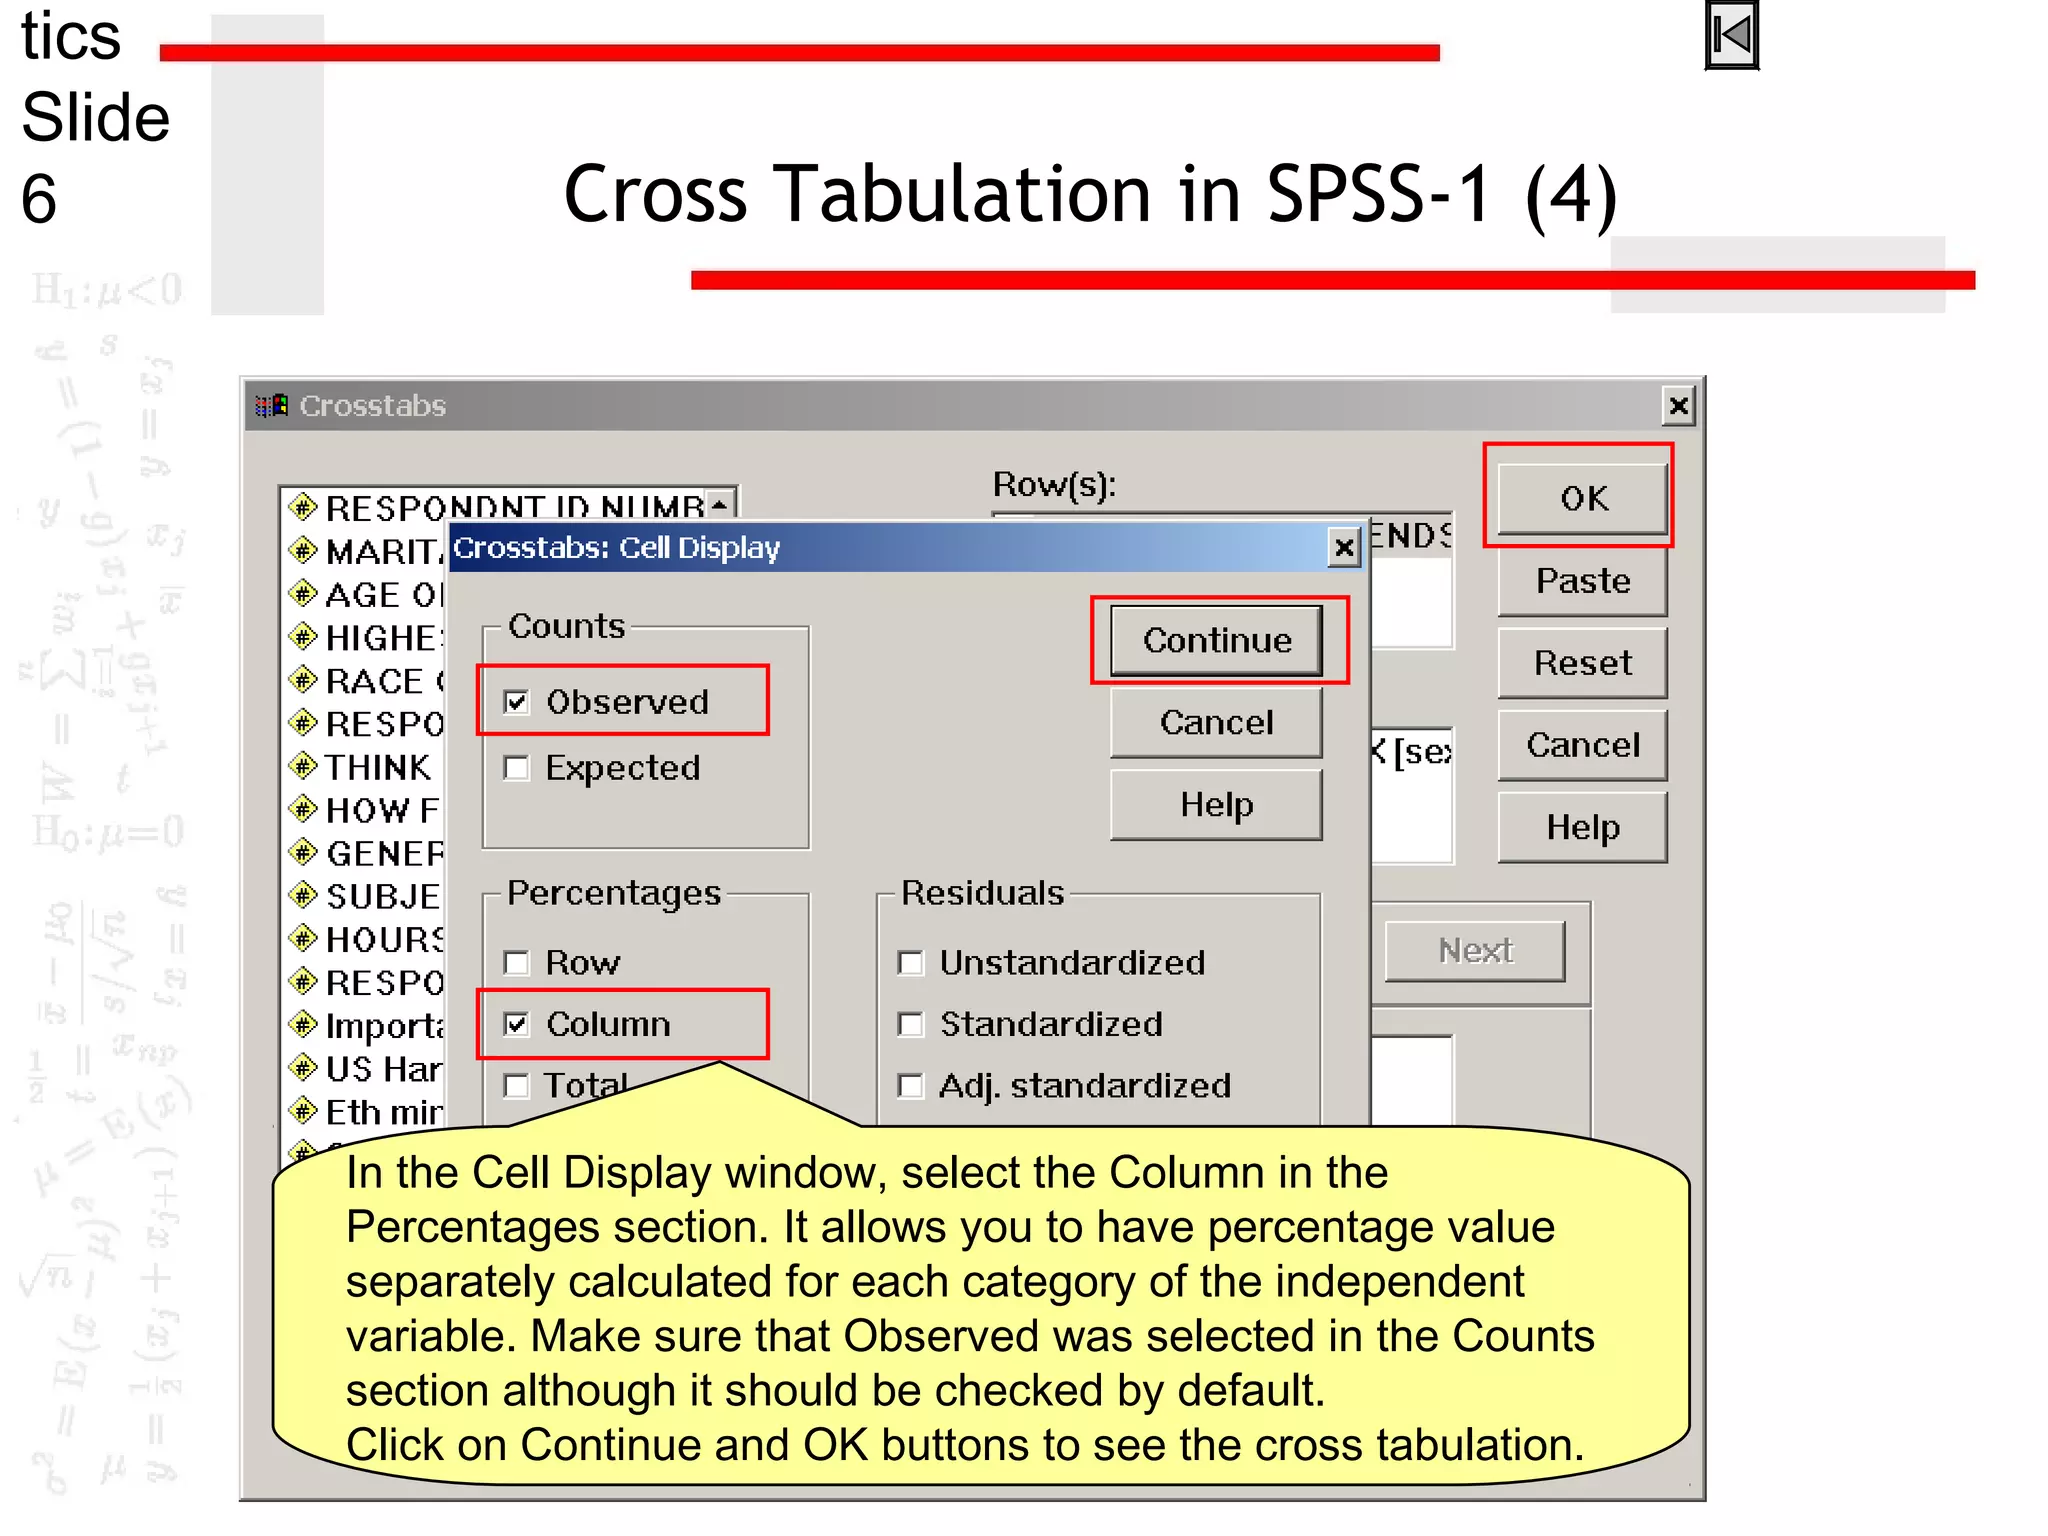
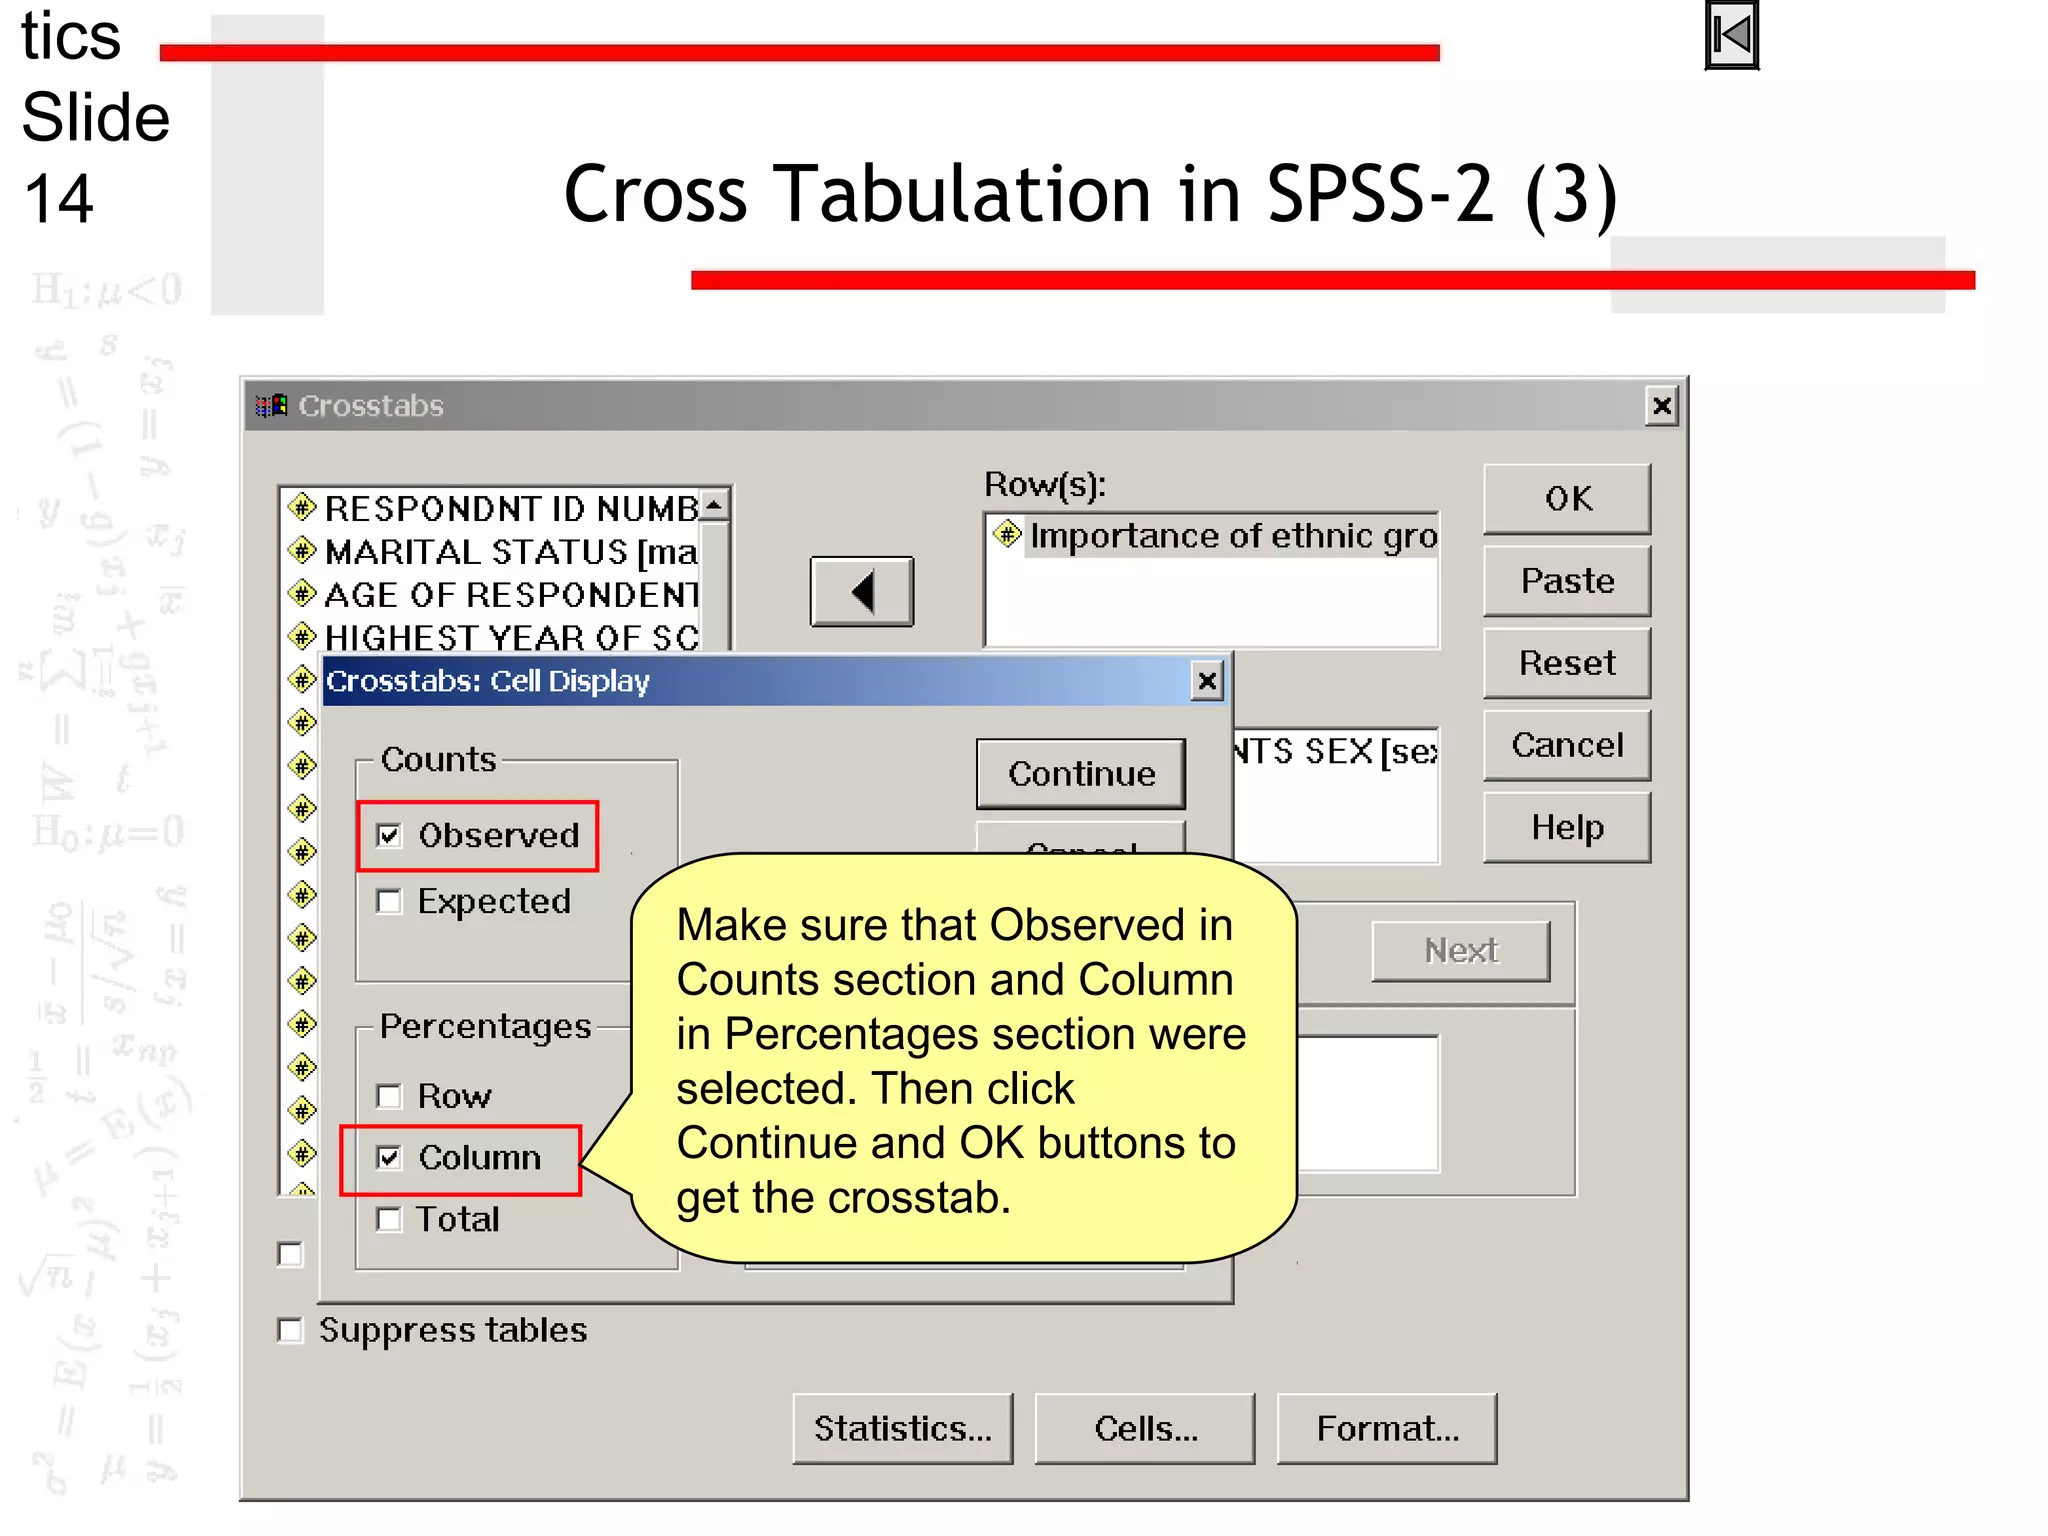
Next, click Cells… button and
select Columns in Percentages
section.](https://image.slidesharecdn.com/class9crosstabulation-150731095410-lva1-app6892/75/cross-tabulation-13-2048.jpg)
![tics
Slide
16
Problem 3: Relationship between Two
Variables-3 (1)
This question asks about how much is the relationship
between the two variables. Notice that the dependent
variable in this question is [ethtrads] and the independent
variable is [sex].](https://image.slidesharecdn.com/class9crosstabulation-150731095410-lva1-app6892/75/cross-tabulation-16-2048.jpg)
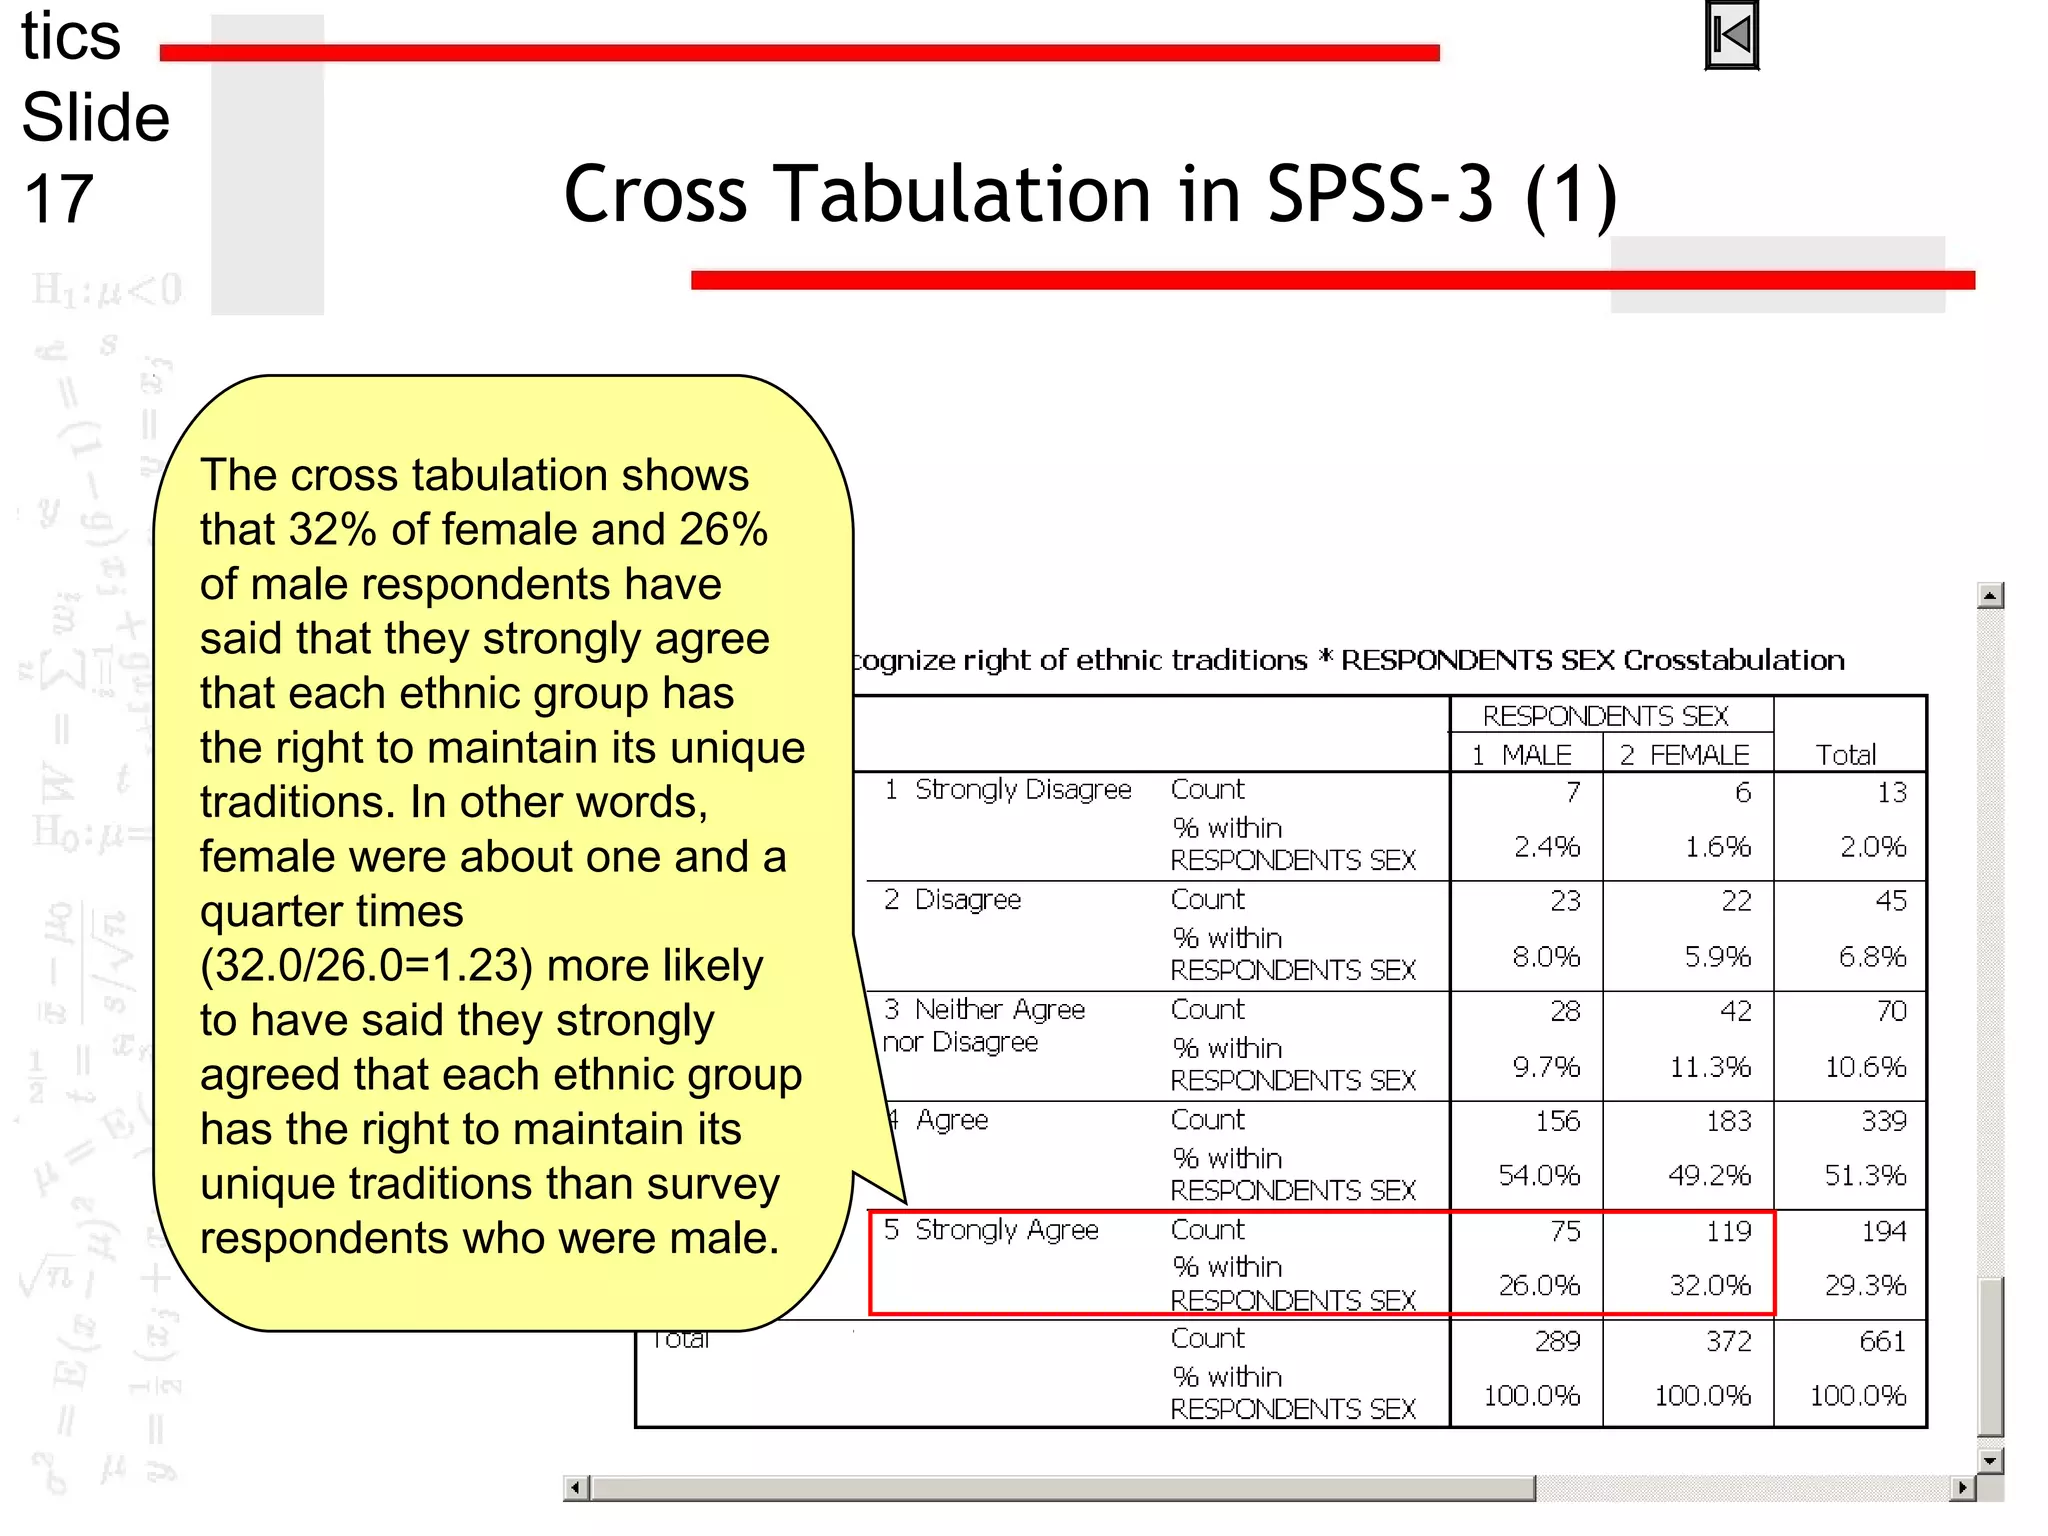
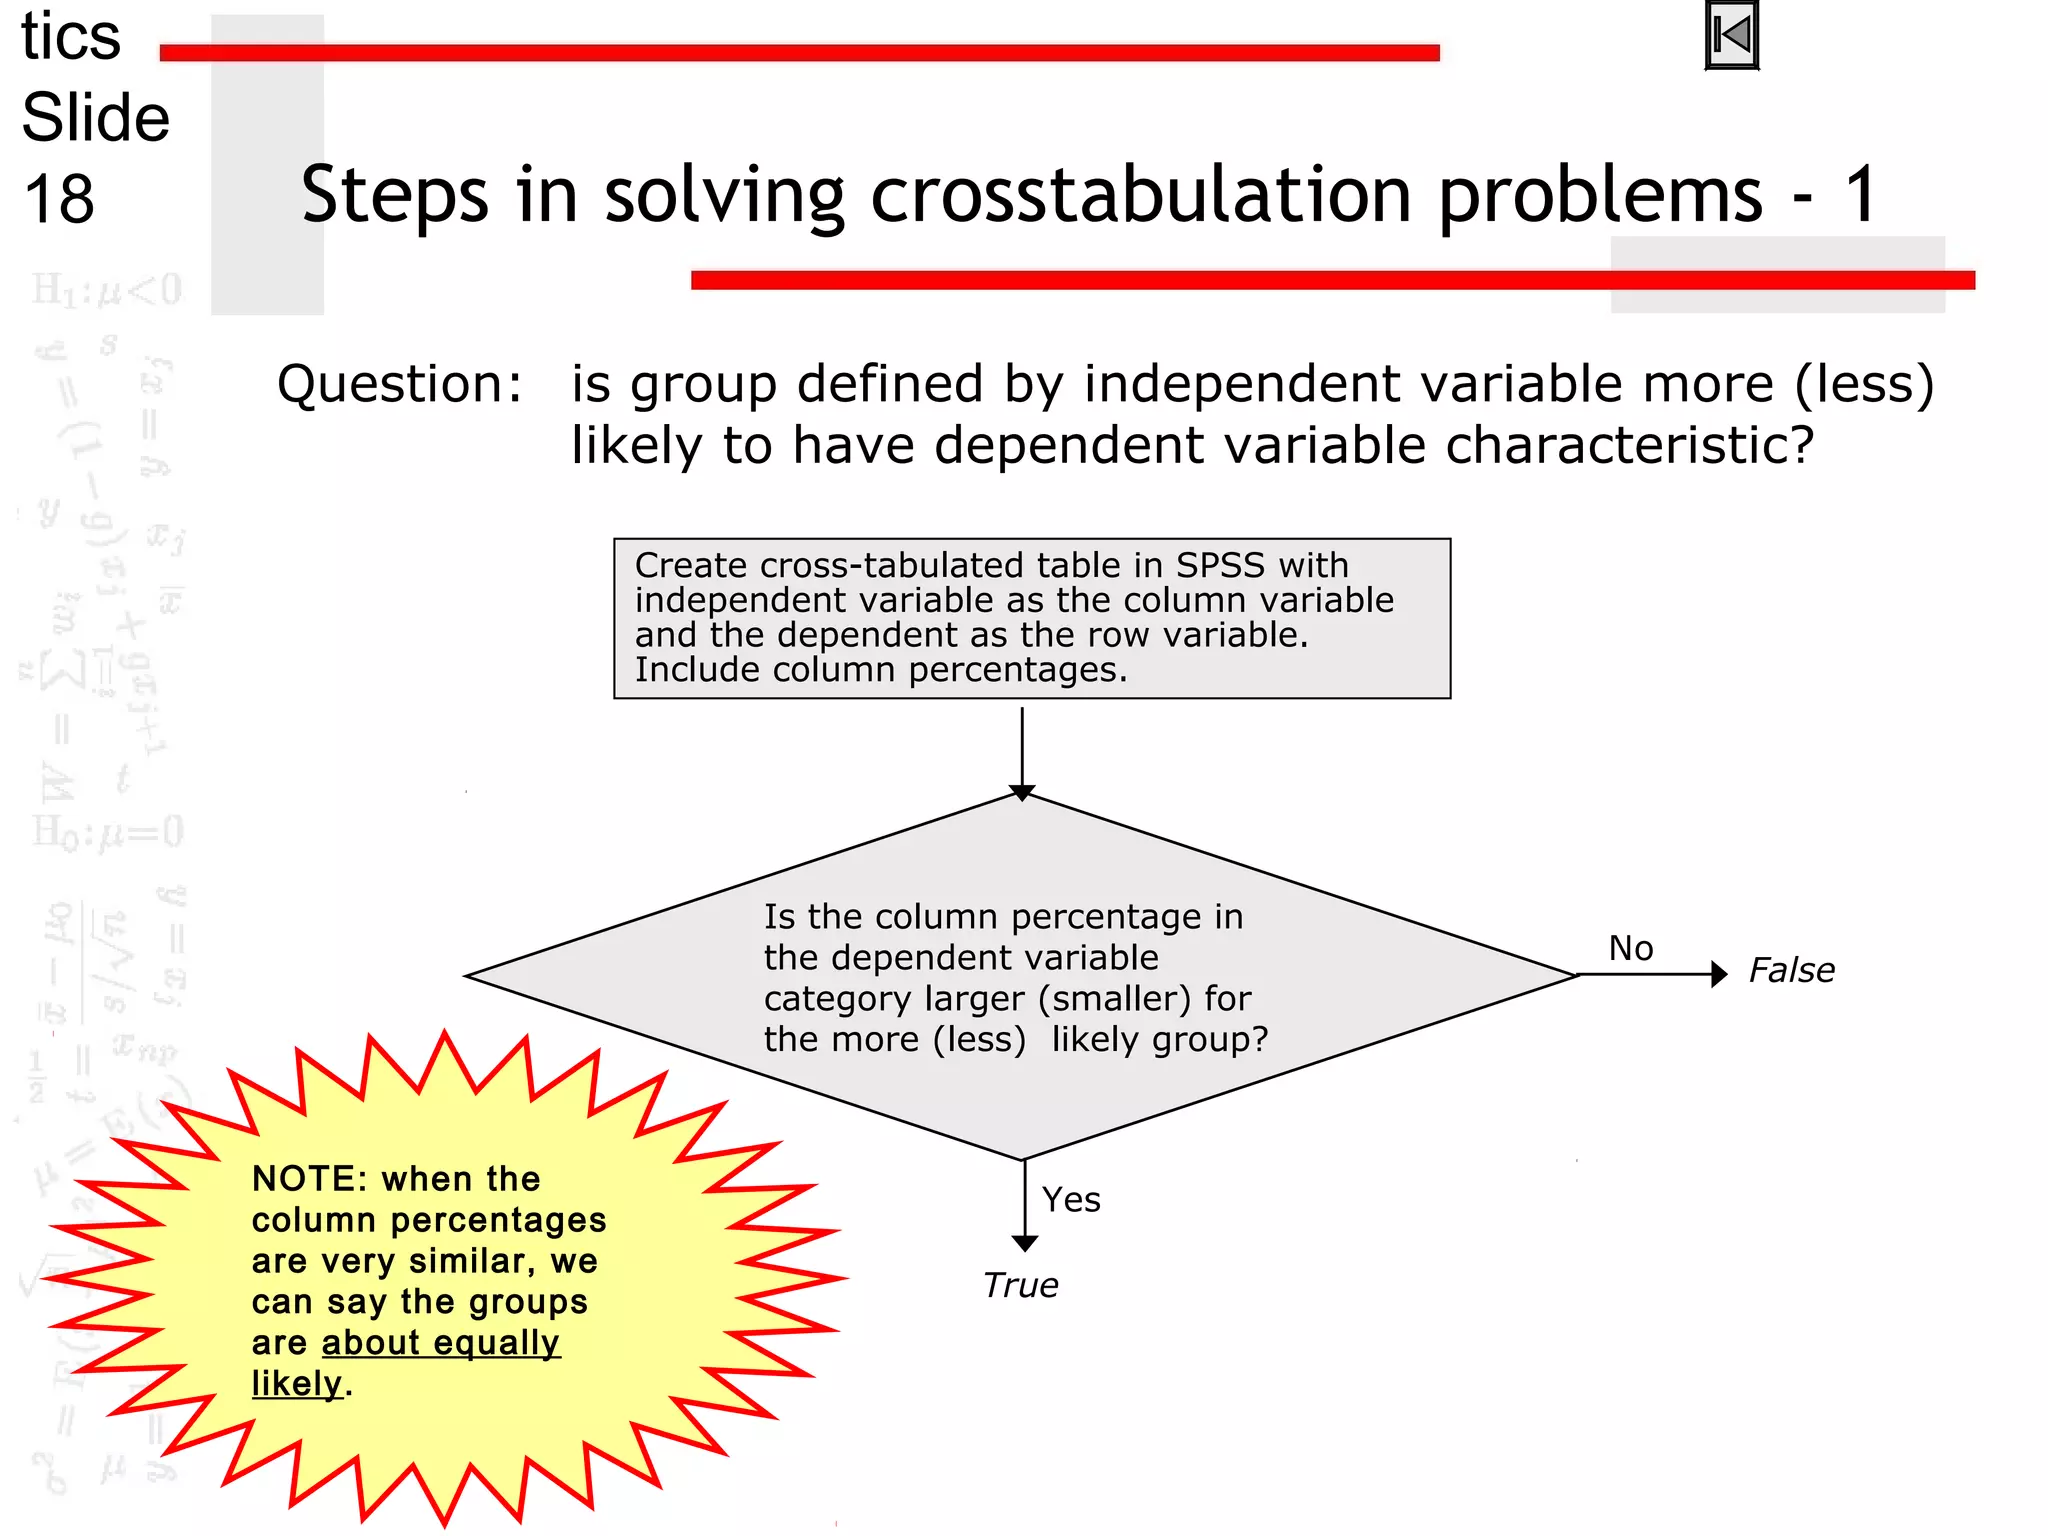

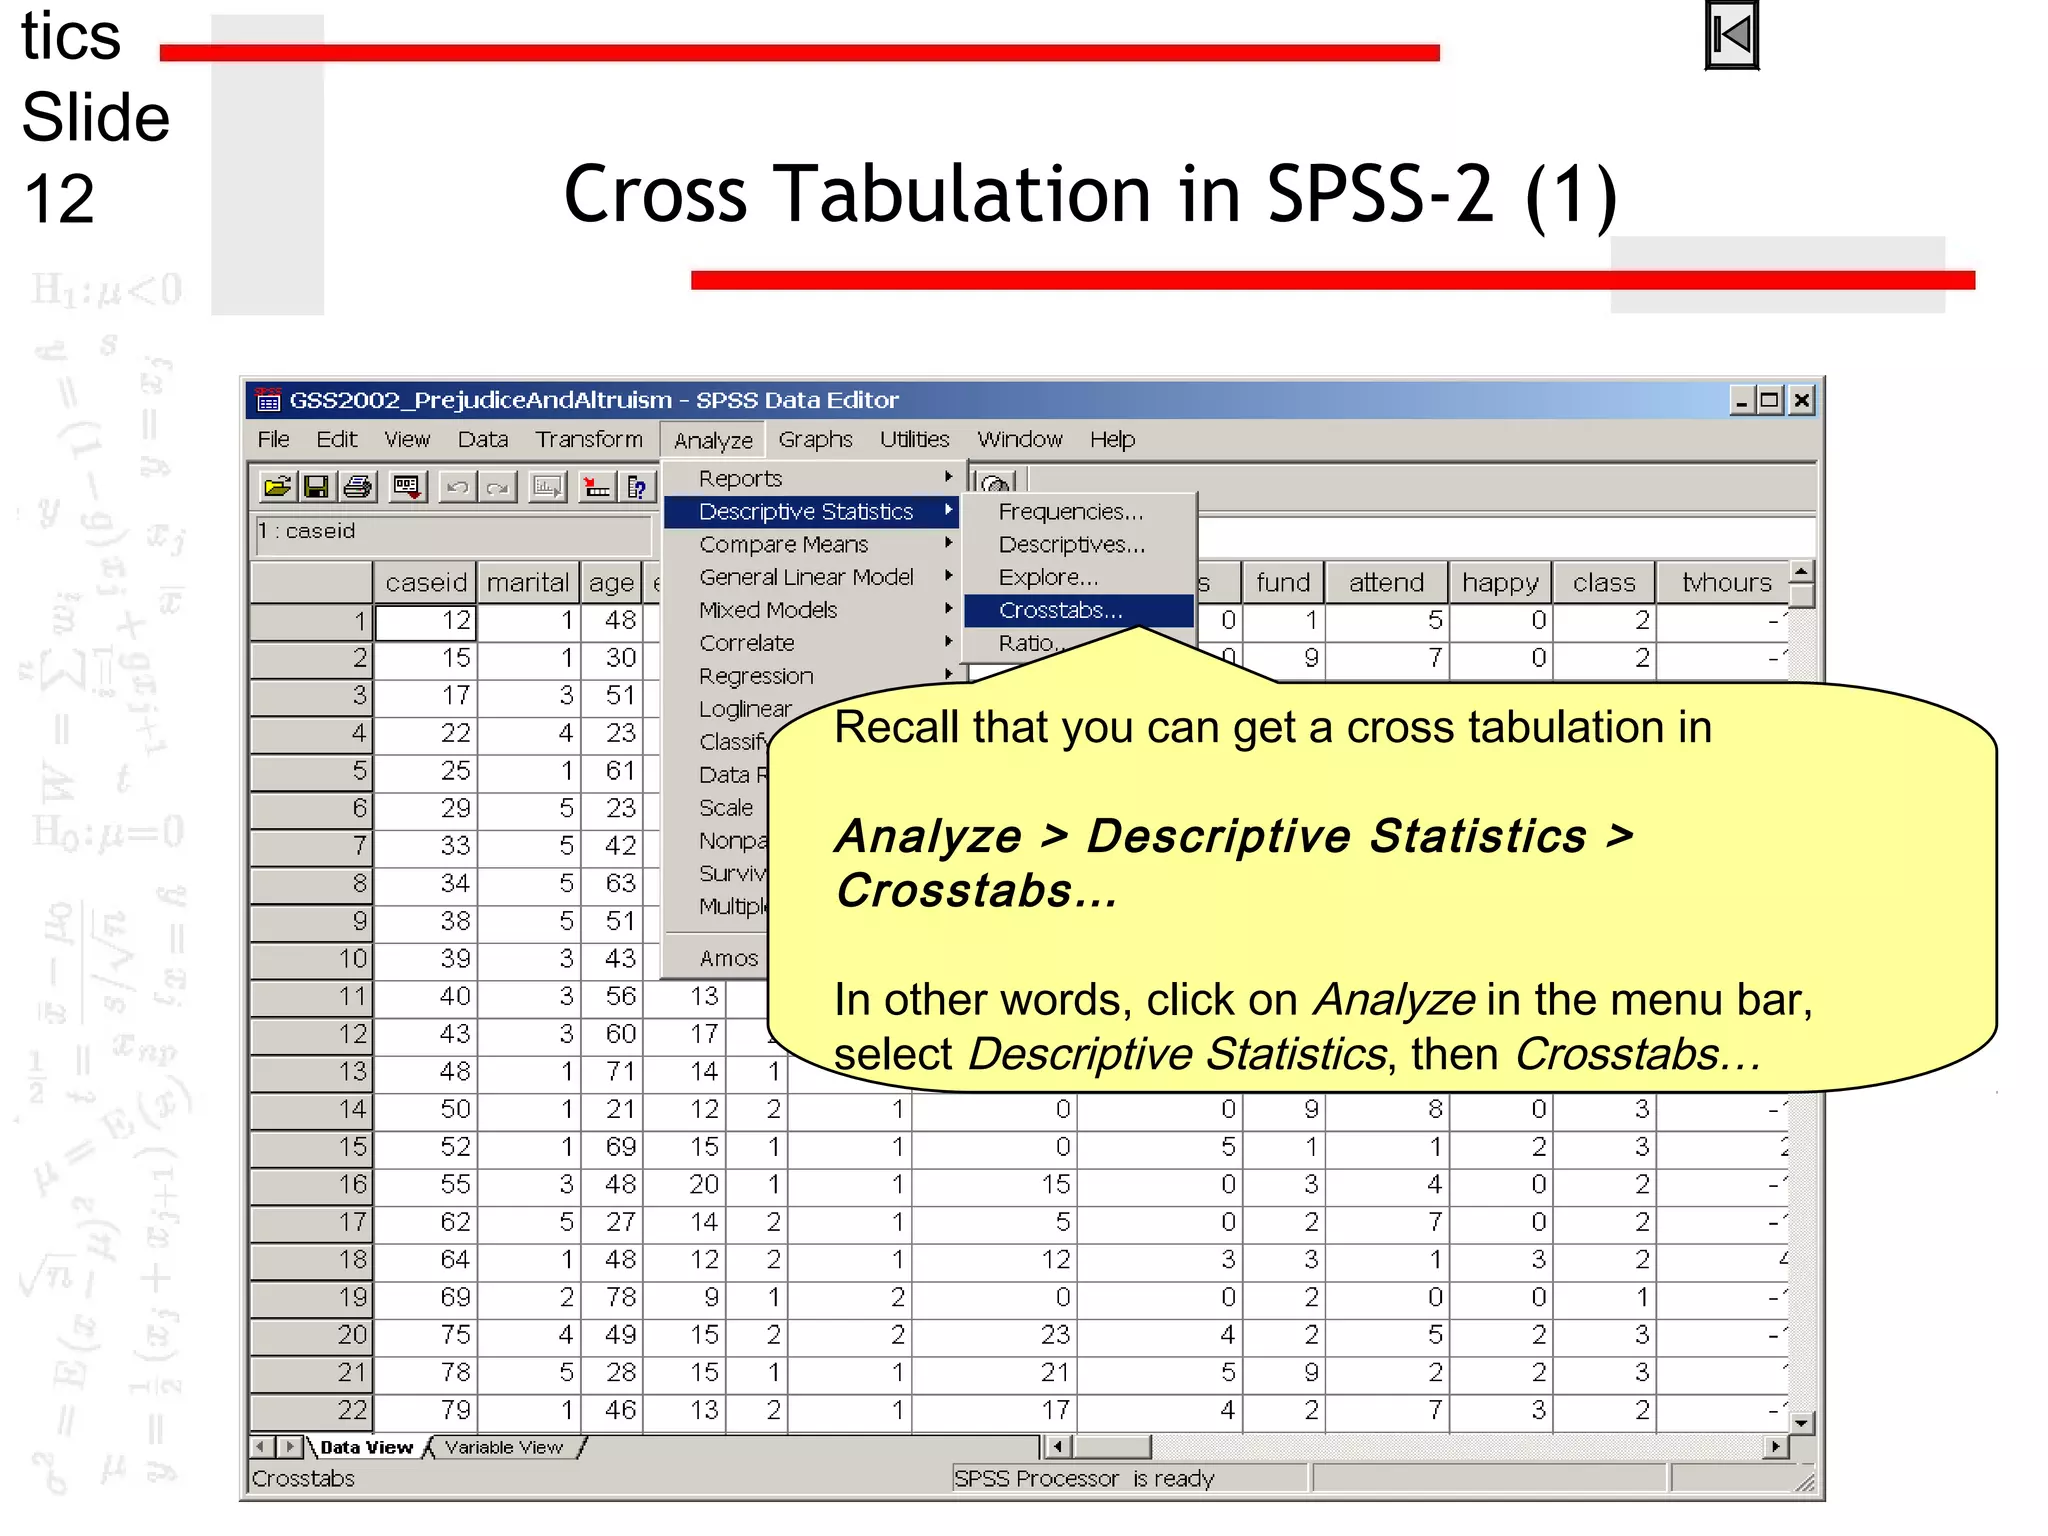
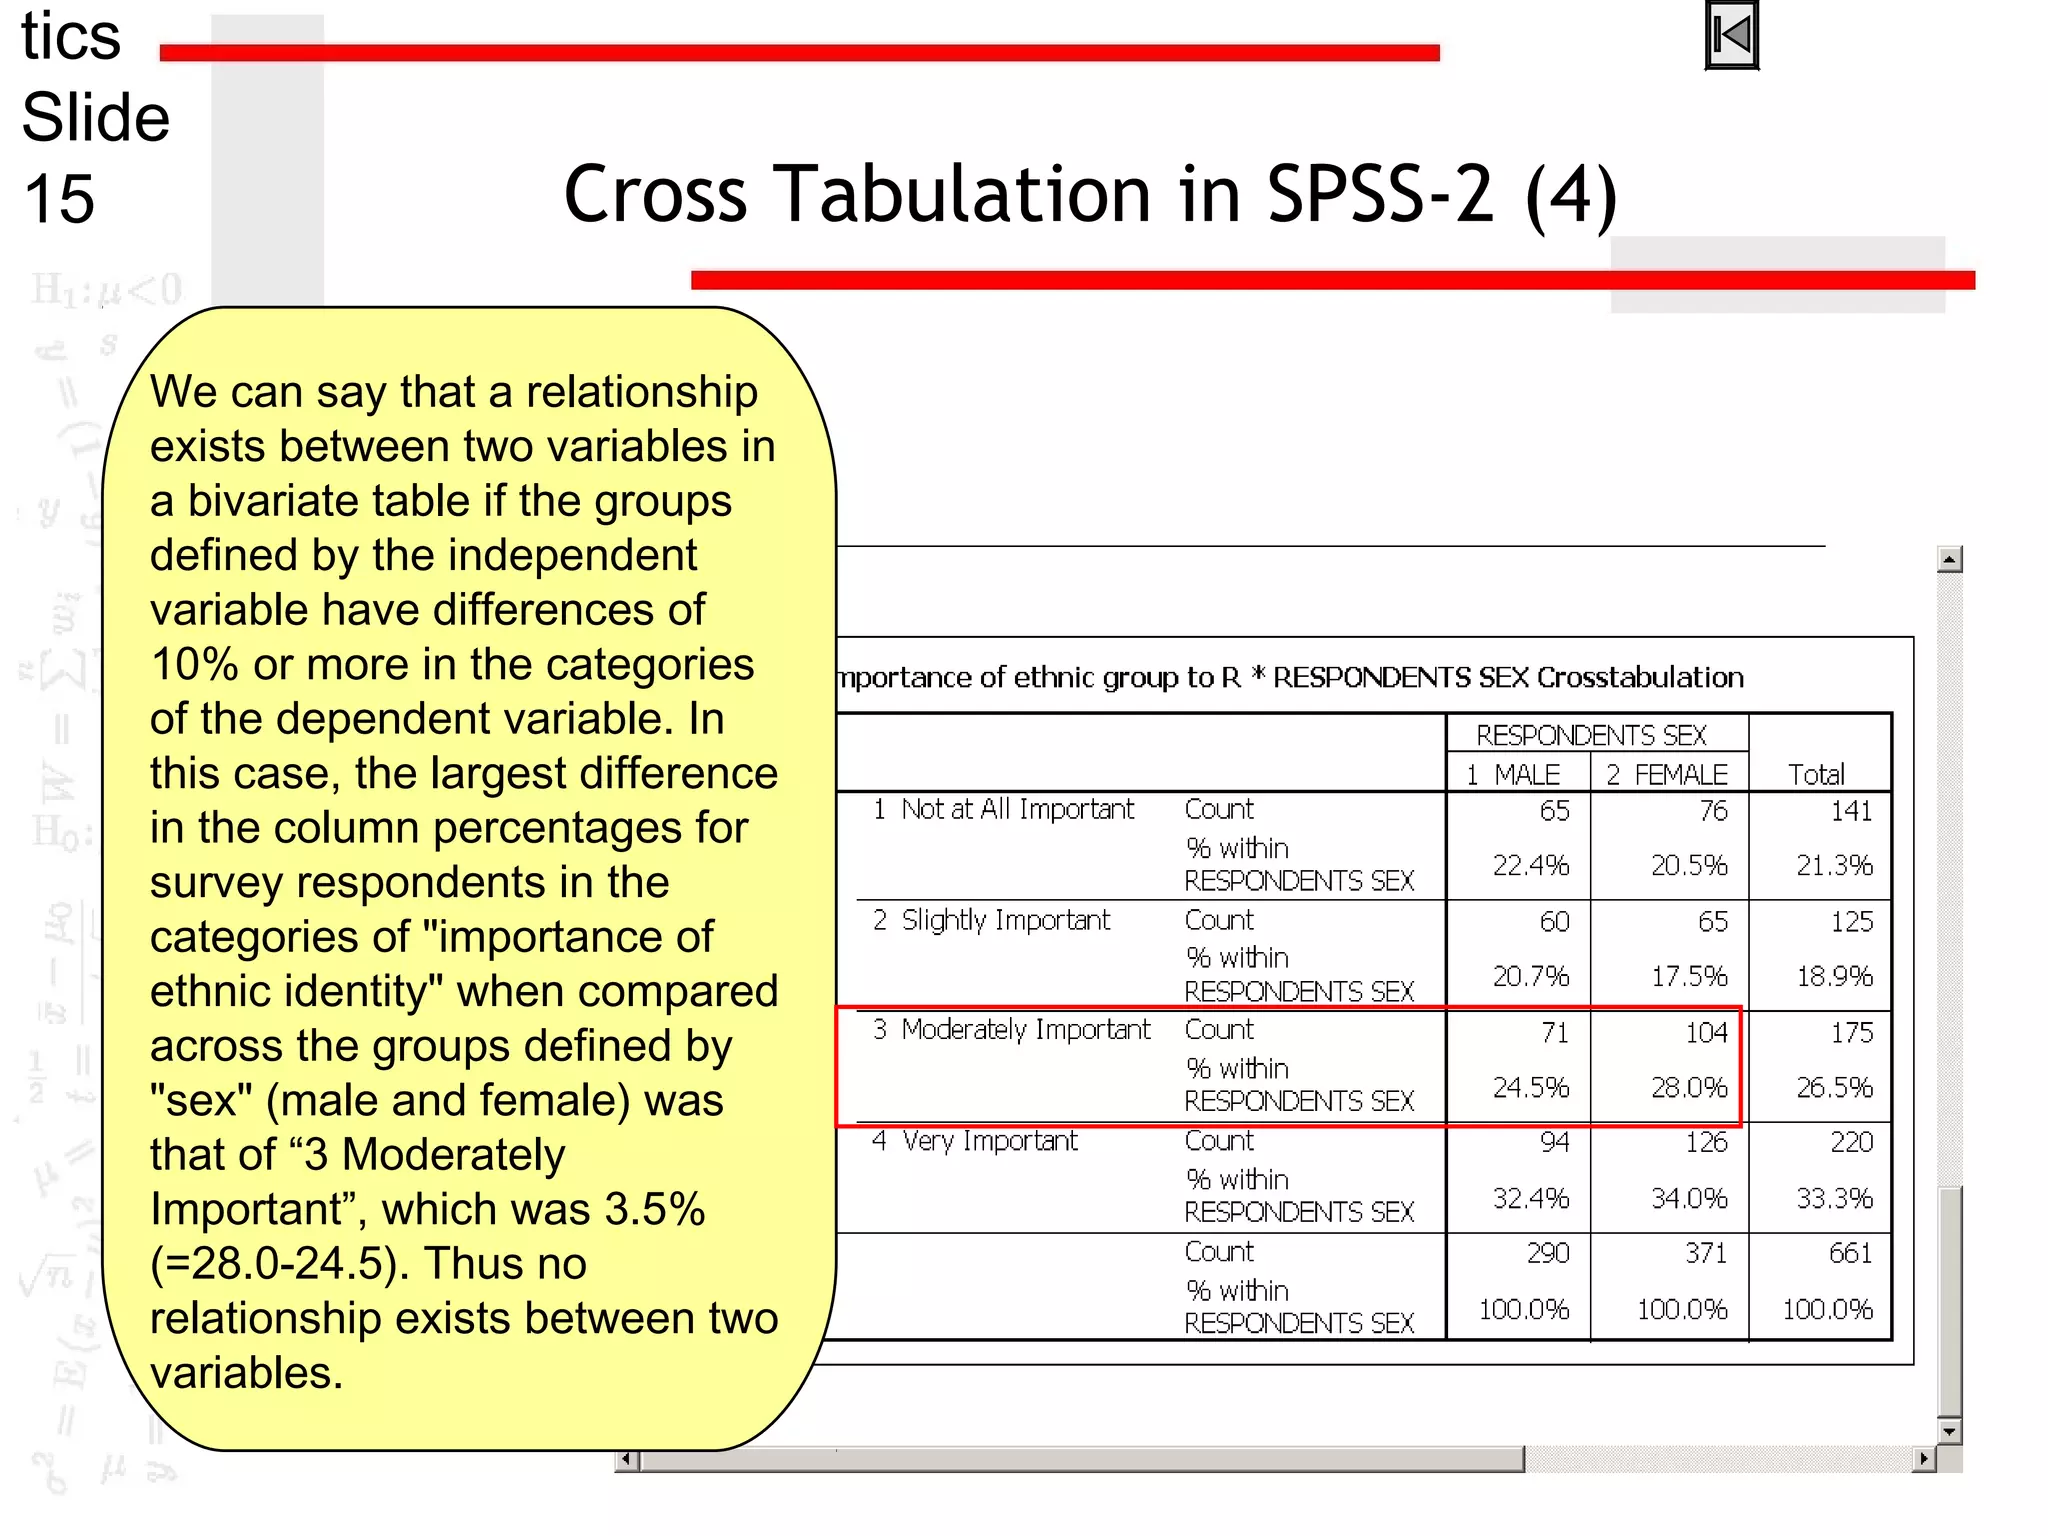
This document provides instructions for analyzing the relationship between two variables using cross tabulation in SPSS. It discusses identifying independent and dependent variables, creating cross tabs by moving variables to column and row positions, calculating column percentages to compare groups, and determining if a relationship exists based on differences in percentages between groups. Examples are provided to demonstrate how to interpret cross tabs and determine if one group is more or less likely than another to have a characteristic.