Downloaded 20 times


![The contingency coefficient takes values
between 0 and SQRT[(k-1)/k], where k = the
number of rows or columns, whichever is
smaller. It becomes more conservative with
respect to phi as the associations between
the variables become stronger.
The Contingency Co-efficient](https://image.slidesharecdn.com/spsscross-classification-150121141422-conversion-gate02/85/Spss-cross-classification-19-320.jpg)


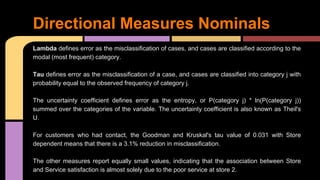


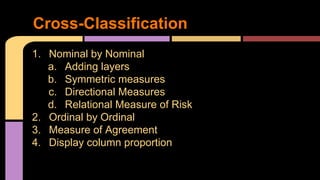
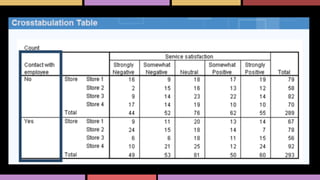
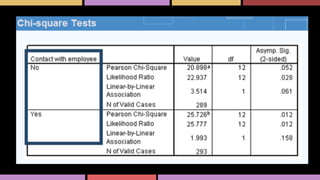
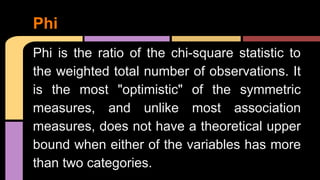
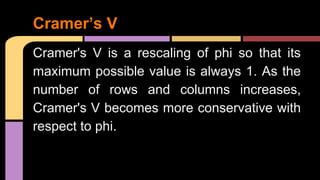
This document discusses different methods for cross-classifying and summarizing relationships between variables, including nominal by nominal, ordinal by ordinal, and adding additional layers. Key points covered include using chi-square tests to determine if differences are due to chance, symmetric measures like phi and cramer's v to quantify relationship strength, and directional measures for nominal and ordinal variables to analyze concordance and discordance. Examples are provided using SPSS output to demonstrate interpreting these various cross-classification techniques.