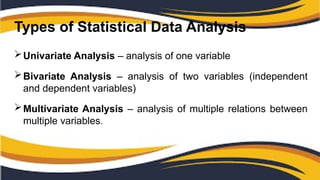
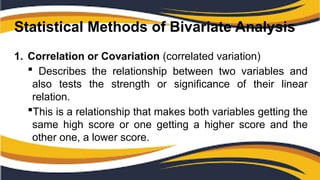
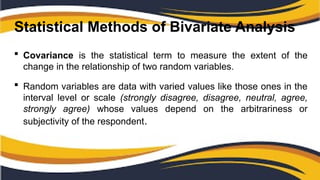
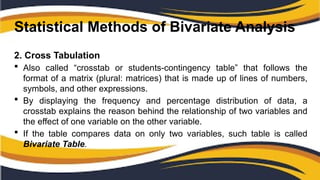
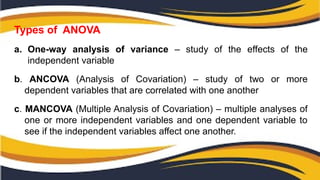
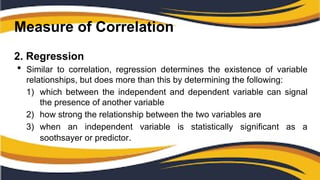
Different Statistical Techniques
Life Performance
Outcomes
I am Courageous, Resourceful
EXPLORERS & PROBLEM
SOLVERS
Essential Performance
Outcomes
Seek out issues, possibilities, and
sources of related information
willingly for further investigation and
development.
Intended Learning
Outcomes
Seek out issues, possibilities, and sources
of related information using different
statistical techniques for further
investigation and development.
Statistics - is a term that pertains to your acts of collecting and
analyzing numerical data.
 Doing statistics then means performing some arithmetic procedures
like addition, division, subtraction, multiplication, and other
mathematical calculations.
 Statistics involves analysis, planning, interpreting, and organizing
data in relation to the design of the experimental method you chose.
 Statistical methods then are ways of gathering, analyzing, and
interpreting variable or fluctuating numerical data.
Statistical Methodologies
1. Descriptive Statistics
 This describes a certain aspect of a data set by making you
calculate the Mean, Median, Mode and Standard Deviation.
 It tells about the placement or position of one data item in relation to
the other data, the extent of the distribution or spreading out of data,
and whether they are correlations or regressions between or among
variables. This kind of statistics does not tell anything about the
population.
Statistical Methodologies
2. Inferential Statistics
 It is a branch of statistics that focuses on conclusions,
generalizations, predictions, interpretations, hypotheses, and the
like.
 There are a lot of hypotheses testing in this method of statistics that
require you to perform complex and advanced mathematical
operations.
Types of Statistical Data Analysis
Univariate Analysis – analysis of one variable
Bivariate Analysis – analysis of two variables (independent
and dependent variables)
Multivariate Analysis – analysis of multiple relations between
multiple variables.
Statistical Methods of Bivariate Analysis
1. Correlation or Covariation (correlated variation)
 Describes the relationship between two variables and
also tests the strength or significance of their linear
relation.
This is a relationship that makes both variables getting the
same high score or one getting a higher score and the
other one, a lower score.
Statistical Methods of Bivariate Analysis
 Covariance is the statistical term to measure the extent of the
change in the relationship of two random variables.
 Random variables are data with varied values like those ones in the
interval level or scale (strongly disagree, disagree, neutral, agree,
strongly agree) whose values depend on the arbitrariness or
subjectivity of the respondent.
Statistical Methods of Bivariate Analysis
2. Cross Tabulation
 Also called “crosstab or students-contingency table” that follows the
format of a matrix (plural: matrices) that is made up of lines of numbers,
symbols, and other expressions.
 By displaying the frequency and percentage distribution of data, a
crosstab explains the reason behind the relationship of two variables and
the effect of one variable on the other variable.
 If the table compares data on only two variables, such table is called
Bivariate Table.
Example of a Bivariate Table
HEI Participants in the 2016 NUSP Conference
HEI MALE FEMALE Row Total
CEU 83 (10.2%) 101 (12.2%) 184
FEU 69 (8.5%) 93 (11.3%) 162
JRU 102 (12.6%) 120 (14.5%) 222
LA SALLE 79 (9.7%) 99 (12%) 178
MLQU 81 (10%) 79 (9.5%) 159
NU 61 (7.5%) 58 (7%) 119
OUP 59 (7.2%) 48 (5.8%) 107
UP 120 (14.8%) 98 (11.9%) 218
UST 152 (18.7%) 127 (15.4%) 279
Column Total 806 (100%) 823 (100%) 1,629
Measure of Correlation
1. Correlation Coefficient
• This is a measure of the strength and direction of the linear
relationship between variables and likewise gives the extent of
dependence between two variables; meaning, the effect of one
variable on the other variable.
 Spearman’s rho– the test to measure the dependence of the
dependent variable on the independent variable
1. Correlation Coefficient
 Pearson product-moment correlation – measures the strength and
direction of the linear relationship of two variables and of the association
between interval and ordinal variables.
 Chi-square – is the statistical test for bivariate analysis of nominal
variables, specifically, to test the null hypothesis. It tests whether or not a
relationship exists between or among variables and tells the probability
that the relationship is caused by chance. This cannot in any way show
the extent of the association between two variables.
1. Correlation Coefficient
 t-test – evaluates the probability that the mean of the sample reflects the mean
of the population from where the sample was drawn. It also tests the difference
between two means: the sample mean and the population mean. ANOVA or
analysis of variance also uses t-test to determine the variance or the difference
between the predicted number of the sample and the actual measurement.
Types of ANOVA
a. One-way analysis of variance – study of the effects of the
independent variable
b. ANCOVA (Analysis of Covariation) – study of two or more
dependent variables that are correlated with one another
c. MANCOVA (Multiple Analysis of Covariation) – multiple analyses of
one or more independent variables and one dependent variable to
see if the independent variables affect one another.
Measure of Correlation
2. Regression
 Similar to correlation, regression determines the existence of variable
relationships, but does more than this by determining the following:
1) which between the independent and dependent variable can signal
the presence of another variable
2) how strong the relationship between the two variables are
3) when an independent variable is statistically significant as a
soothsayer or predictor.

Different Statistical Techniques - Practical Research 1

  • 1.
  • 2.
    Life Performance Outcomes I amCourageous, Resourceful EXPLORERS & PROBLEM SOLVERS
  • 3.
    Essential Performance Outcomes Seek outissues, possibilities, and sources of related information willingly for further investigation and development.
  • 4.
    Intended Learning Outcomes Seek outissues, possibilities, and sources of related information using different statistical techniques for further investigation and development.
  • 5.
    Statistics - isa term that pertains to your acts of collecting and analyzing numerical data.  Doing statistics then means performing some arithmetic procedures like addition, division, subtraction, multiplication, and other mathematical calculations.  Statistics involves analysis, planning, interpreting, and organizing data in relation to the design of the experimental method you chose.  Statistical methods then are ways of gathering, analyzing, and interpreting variable or fluctuating numerical data.
  • 6.
    Statistical Methodologies 1. DescriptiveStatistics  This describes a certain aspect of a data set by making you calculate the Mean, Median, Mode and Standard Deviation.  It tells about the placement or position of one data item in relation to the other data, the extent of the distribution or spreading out of data, and whether they are correlations or regressions between or among variables. This kind of statistics does not tell anything about the population.
  • 7.
    Statistical Methodologies 2. InferentialStatistics  It is a branch of statistics that focuses on conclusions, generalizations, predictions, interpretations, hypotheses, and the like.  There are a lot of hypotheses testing in this method of statistics that require you to perform complex and advanced mathematical operations.
  • 8.
    Types of StatisticalData Analysis Univariate Analysis – analysis of one variable Bivariate Analysis – analysis of two variables (independent and dependent variables) Multivariate Analysis – analysis of multiple relations between multiple variables.
  • 9.
    Statistical Methods ofBivariate Analysis 1. Correlation or Covariation (correlated variation)  Describes the relationship between two variables and also tests the strength or significance of their linear relation. This is a relationship that makes both variables getting the same high score or one getting a higher score and the other one, a lower score.
  • 10.
    Statistical Methods ofBivariate Analysis  Covariance is the statistical term to measure the extent of the change in the relationship of two random variables.  Random variables are data with varied values like those ones in the interval level or scale (strongly disagree, disagree, neutral, agree, strongly agree) whose values depend on the arbitrariness or subjectivity of the respondent.
  • 11.
    Statistical Methods ofBivariate Analysis 2. Cross Tabulation  Also called “crosstab or students-contingency table” that follows the format of a matrix (plural: matrices) that is made up of lines of numbers, symbols, and other expressions.  By displaying the frequency and percentage distribution of data, a crosstab explains the reason behind the relationship of two variables and the effect of one variable on the other variable.  If the table compares data on only two variables, such table is called Bivariate Table.
  • 12.
    Example of aBivariate Table HEI Participants in the 2016 NUSP Conference HEI MALE FEMALE Row Total CEU 83 (10.2%) 101 (12.2%) 184 FEU 69 (8.5%) 93 (11.3%) 162 JRU 102 (12.6%) 120 (14.5%) 222 LA SALLE 79 (9.7%) 99 (12%) 178 MLQU 81 (10%) 79 (9.5%) 159 NU 61 (7.5%) 58 (7%) 119 OUP 59 (7.2%) 48 (5.8%) 107 UP 120 (14.8%) 98 (11.9%) 218 UST 152 (18.7%) 127 (15.4%) 279 Column Total 806 (100%) 823 (100%) 1,629
  • 13.
    Measure of Correlation 1.Correlation Coefficient • This is a measure of the strength and direction of the linear relationship between variables and likewise gives the extent of dependence between two variables; meaning, the effect of one variable on the other variable.  Spearman’s rho– the test to measure the dependence of the dependent variable on the independent variable
  • 14.
    1. Correlation Coefficient Pearson product-moment correlation – measures the strength and direction of the linear relationship of two variables and of the association between interval and ordinal variables.  Chi-square – is the statistical test for bivariate analysis of nominal variables, specifically, to test the null hypothesis. It tests whether or not a relationship exists between or among variables and tells the probability that the relationship is caused by chance. This cannot in any way show the extent of the association between two variables.
  • 15.
    1. Correlation Coefficient t-test – evaluates the probability that the mean of the sample reflects the mean of the population from where the sample was drawn. It also tests the difference between two means: the sample mean and the population mean. ANOVA or analysis of variance also uses t-test to determine the variance or the difference between the predicted number of the sample and the actual measurement.
  • 16.
    Types of ANOVA a.One-way analysis of variance – study of the effects of the independent variable b. ANCOVA (Analysis of Covariation) – study of two or more dependent variables that are correlated with one another c. MANCOVA (Multiple Analysis of Covariation) – multiple analyses of one or more independent variables and one dependent variable to see if the independent variables affect one another.
  • 17.
    Measure of Correlation 2.Regression  Similar to correlation, regression determines the existence of variable relationships, but does more than this by determining the following: 1) which between the independent and dependent variable can signal the presence of another variable 2) how strong the relationship between the two variables are 3) when an independent variable is statistically significant as a soothsayer or predictor.

Editor's Notes

  • #2 c) Survey questionnaire
  • #3 b) To solve real-world problems
  • #4 b) An educated guess
  • #5 Tell the students that statistics demands much time and effort, for it is not merely a matter of collecting and examining data.
  • #7 Explain to the students that this statistical method is not as simple as the descriptive statistics. This does not focus itself only on the features of the category of set, but on the characteristics of the sample that are also true for the population from where they have drawn the sample. Their analysis begins with the sample, then, based on their findings about the sample, they make inferences or assumptions about the population. Since the sample serves as the basis of their conclusions or generalizations about the population, it is a must that they use random sampling to guarantee the representativeness of the sample; meaning, to make sure that the sample truly represents the population in general. This is one reason inferential statistics is not as popular as the descriptive statistics in the college level where very few have solid foundation of statistics. (Argyrous 2011; Russell 2013; Levin & Fox 2014)
  • #9 Tell the students that bivariate analysis happens by means of the following methods. (Argyrous 2011; Babbie 2013; Punch 2014)
  • #11 Similar to one type of graph called table, matrix arranges data in rows and columns.
  • #12 Indicate to the class that the slide presents an example of bivariate table.
  • #13 This is determined through the following statistical tests for Correlation Coefficient. (Argyrous 2011; Creswell 2014; Levin & Fox 2014)
  • #17 Tell the students: 1. Each of these statistical tests has its own formula that, with your good background knowledge about statistics, you may be able to follow easily. However, without solid foundation about statistics, to be able to apply them to your research, you need to read further about statistics or hire the services of a statistician. 2. Think of forking out hundreds of dollars or thousands of pesos for a research study in the graduate or MA/PhD level, not for one in the collegiate level. It is in your bachelor degree level where the world expects you to show your prowess in conducting a research that uses simple descriptive statistical techniques.