This document provides examples and explanations for calculating rates of change, slopes, and describing slopes of lines based on data points or graphs. It includes examples of finding the rate of change and slope from tables of data, graphs of data points, and geometric descriptions of lines. Students are asked to identify rates of change, calculate slopes, and describe slopes as positive, negative, zero or undefined. The greatest rate of change is represented by the steepest line segment on a graph. The constant rate of change of a line is called its slope.
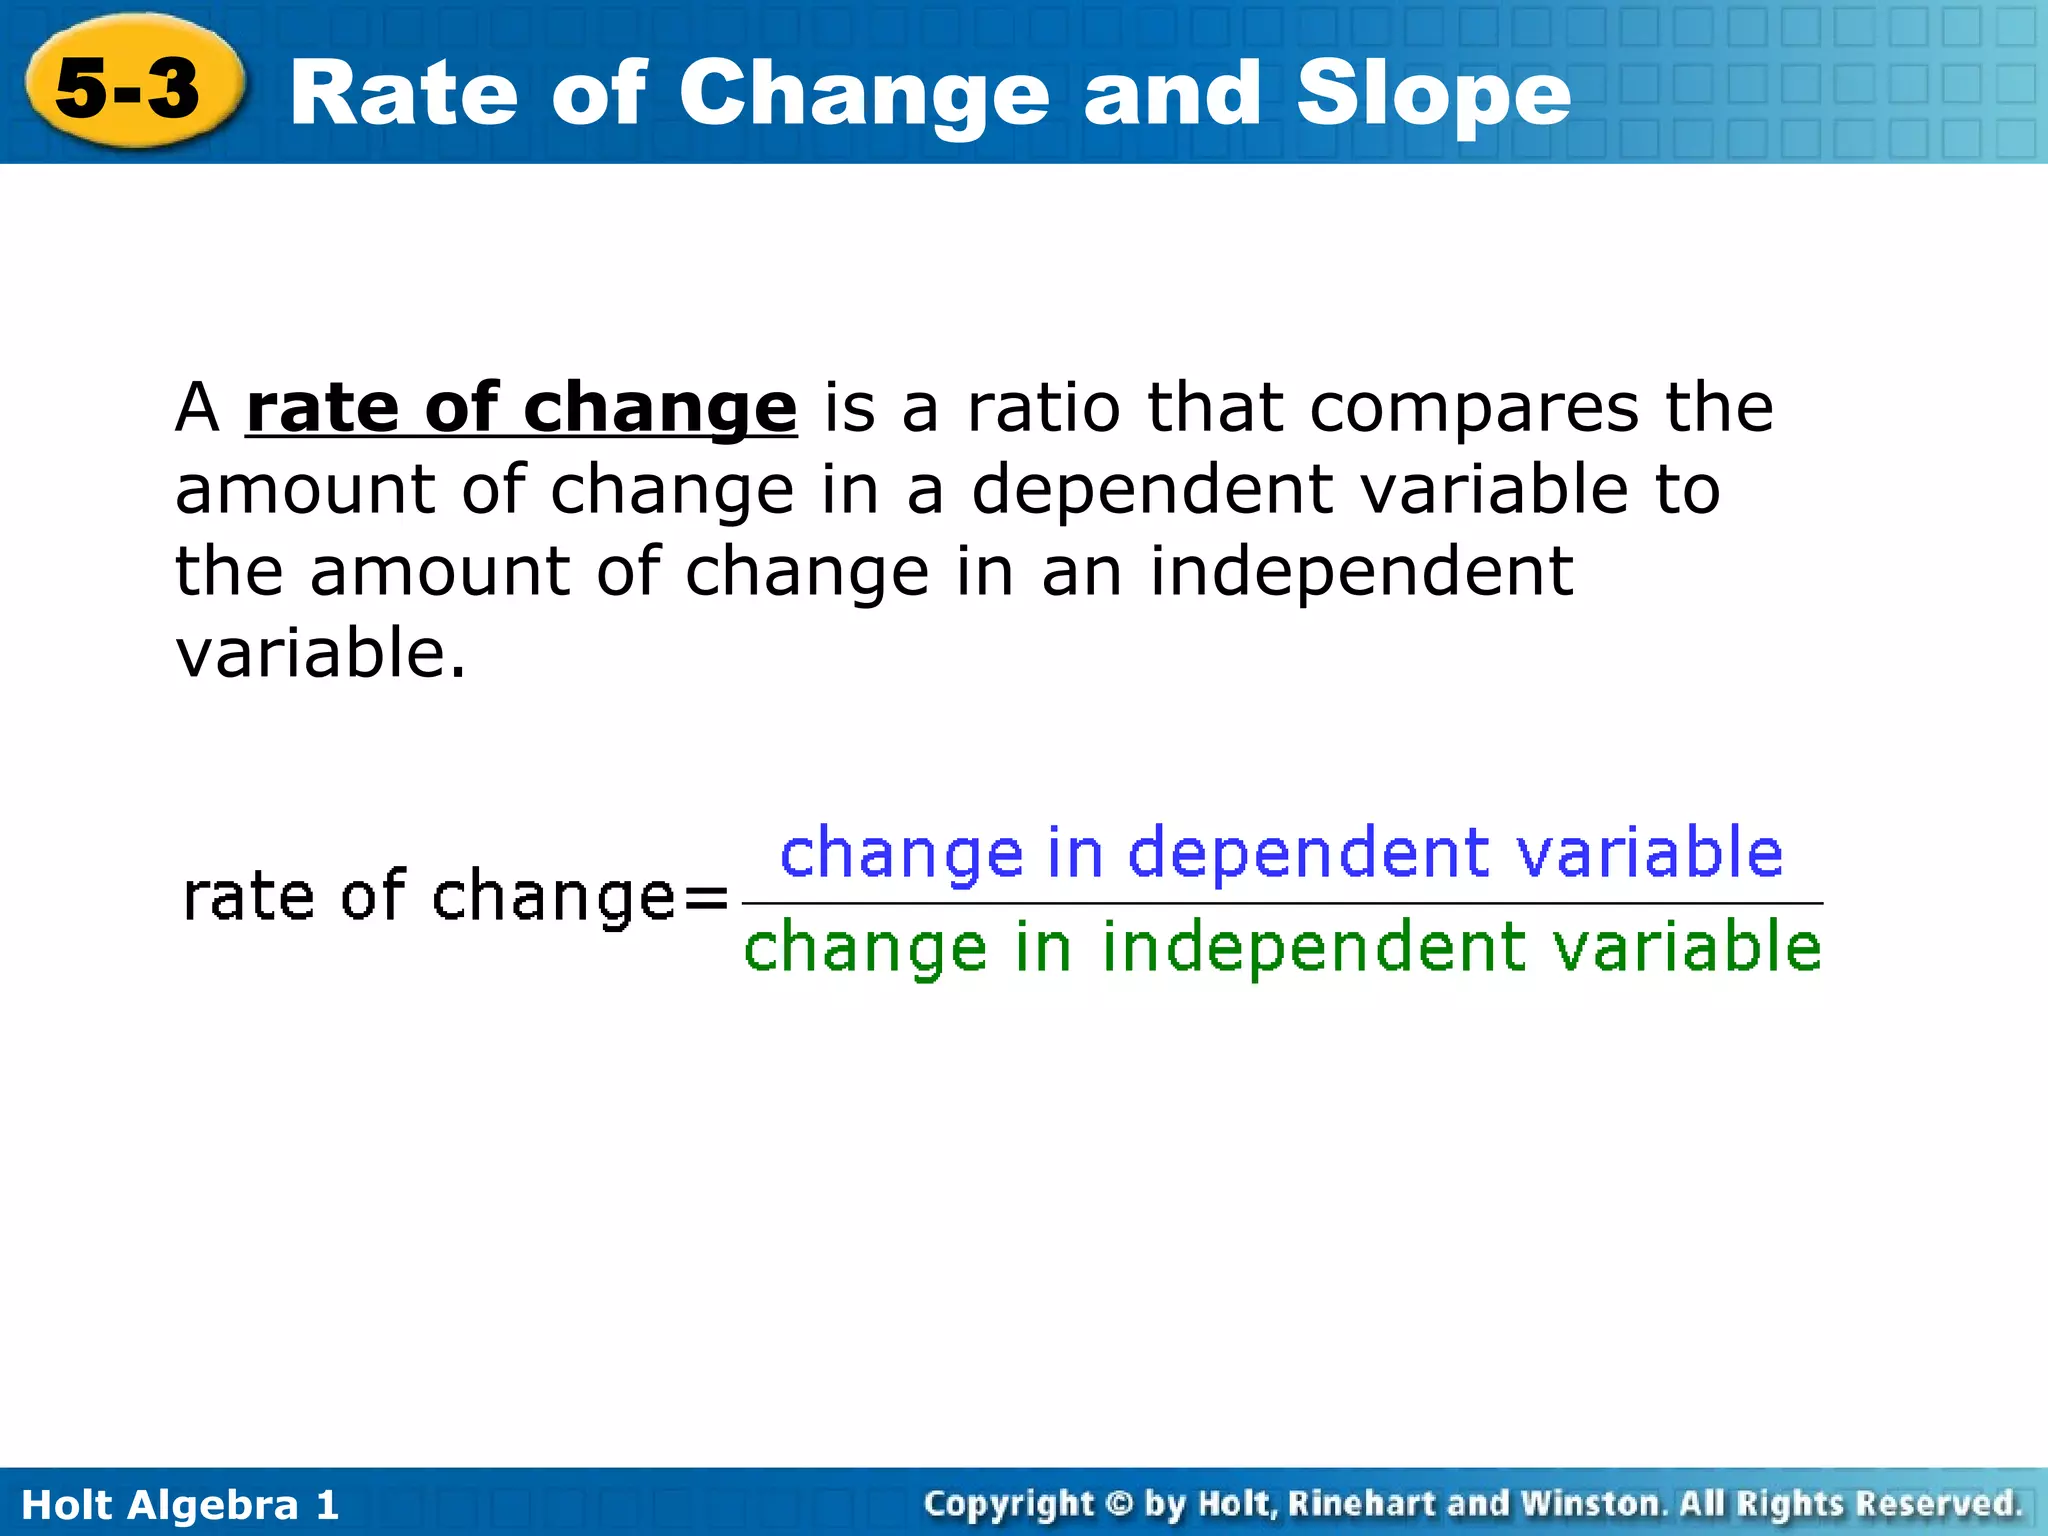
A rateof change is a ratio that compares the amount of change in a dependent variable to the amount of change in an independent variable.
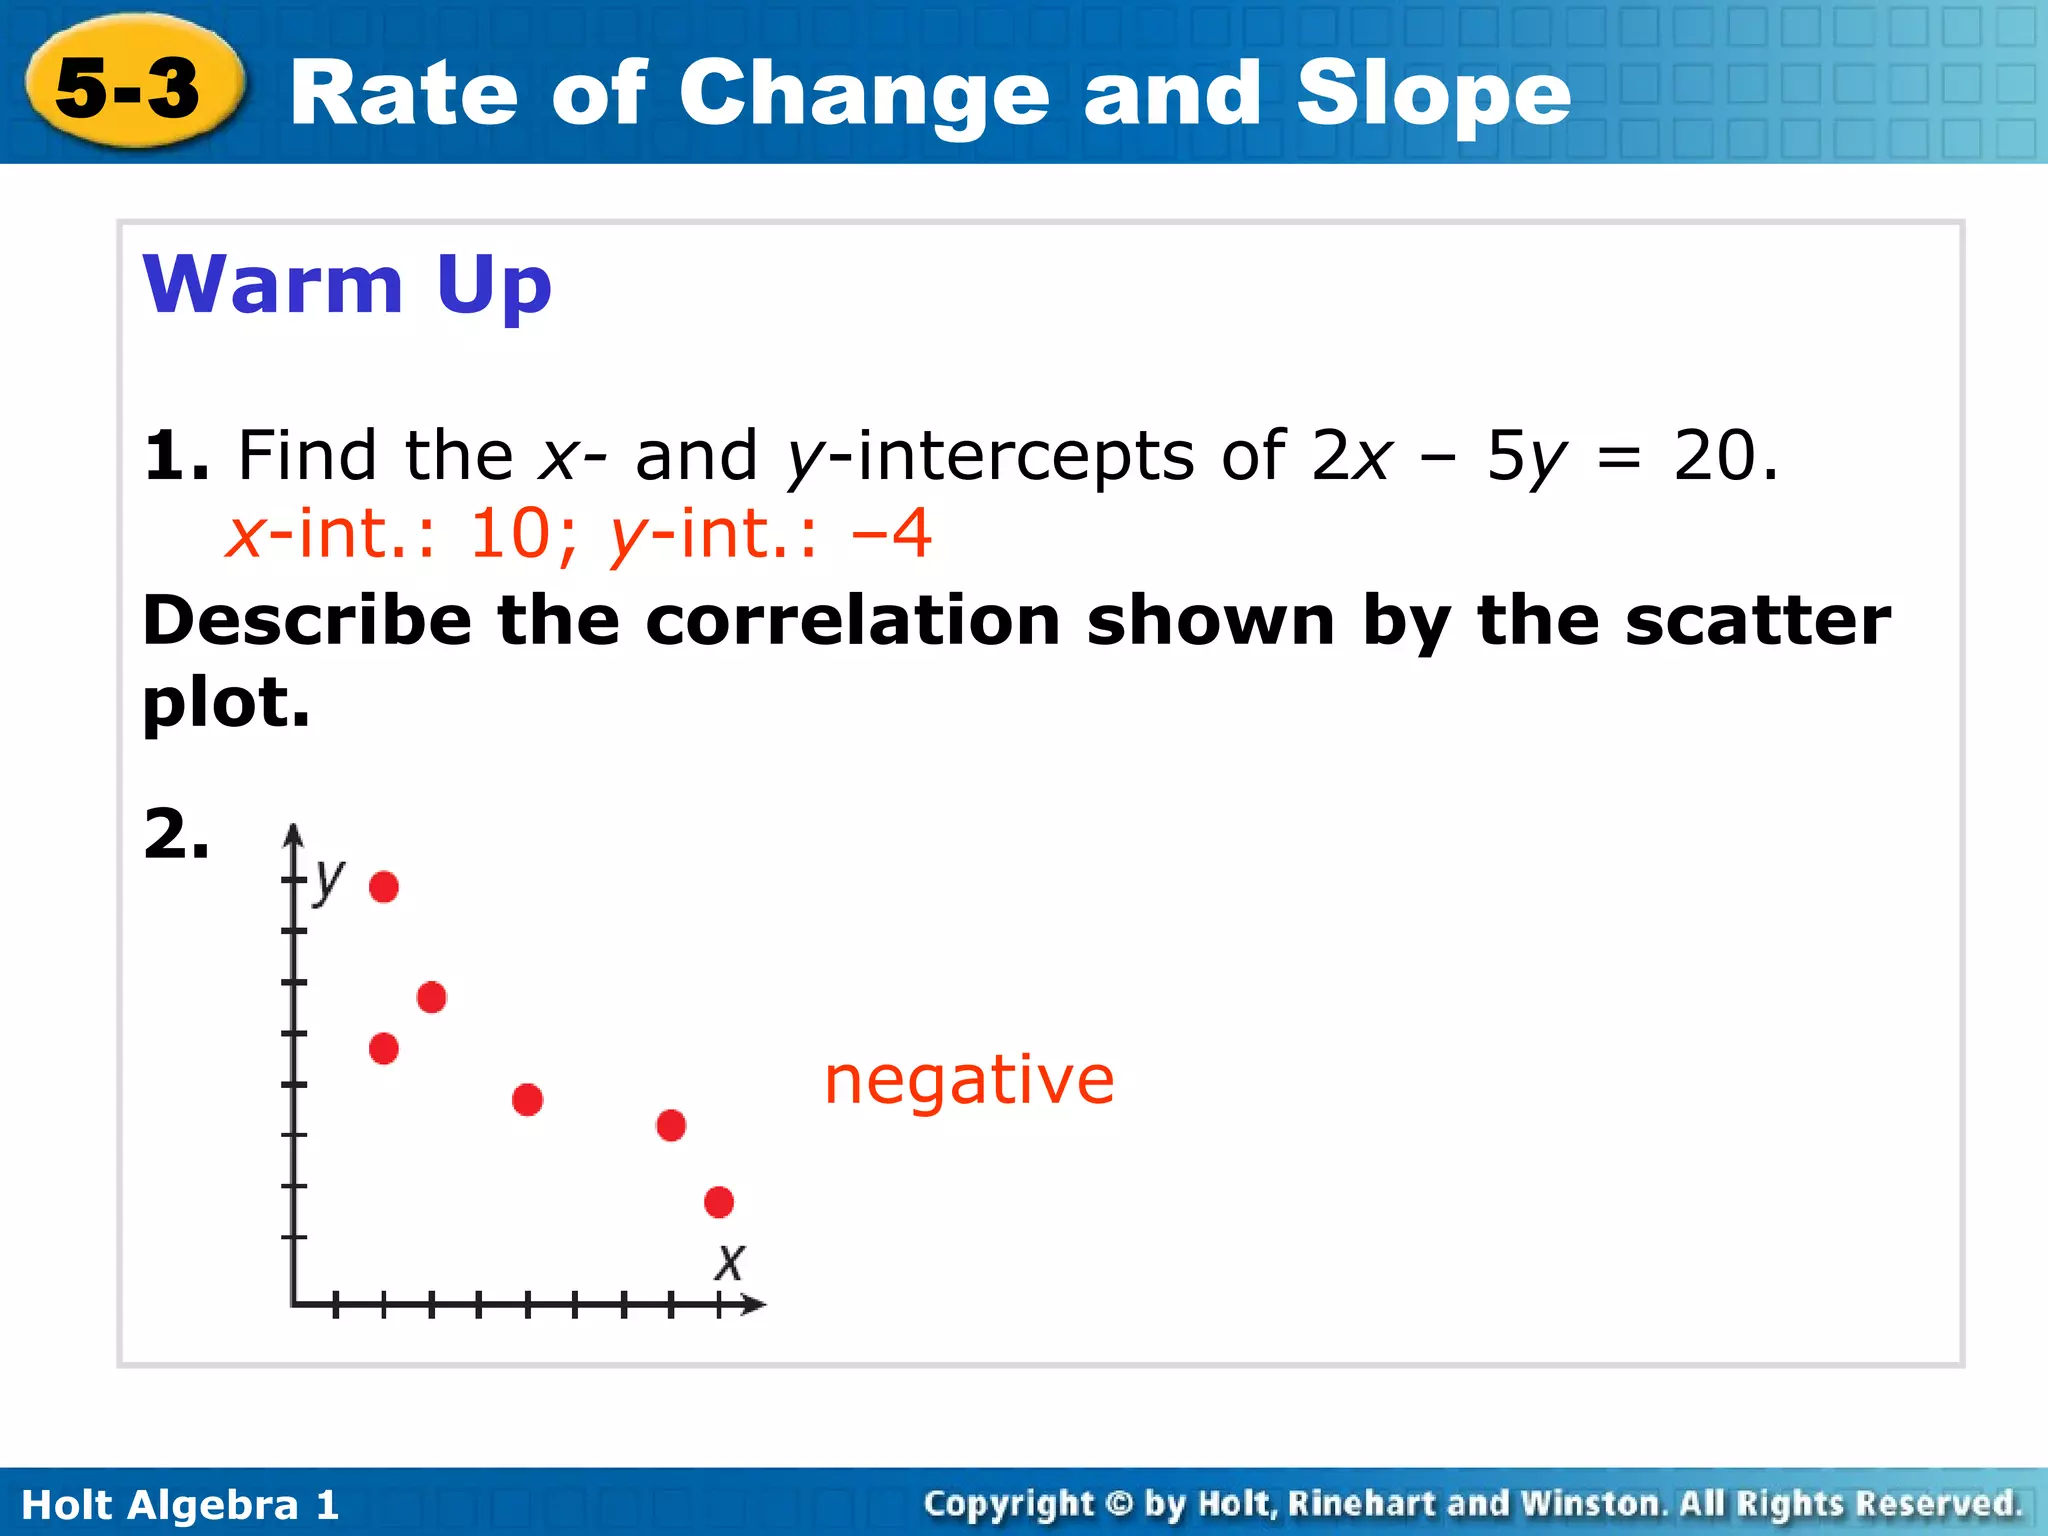
6.
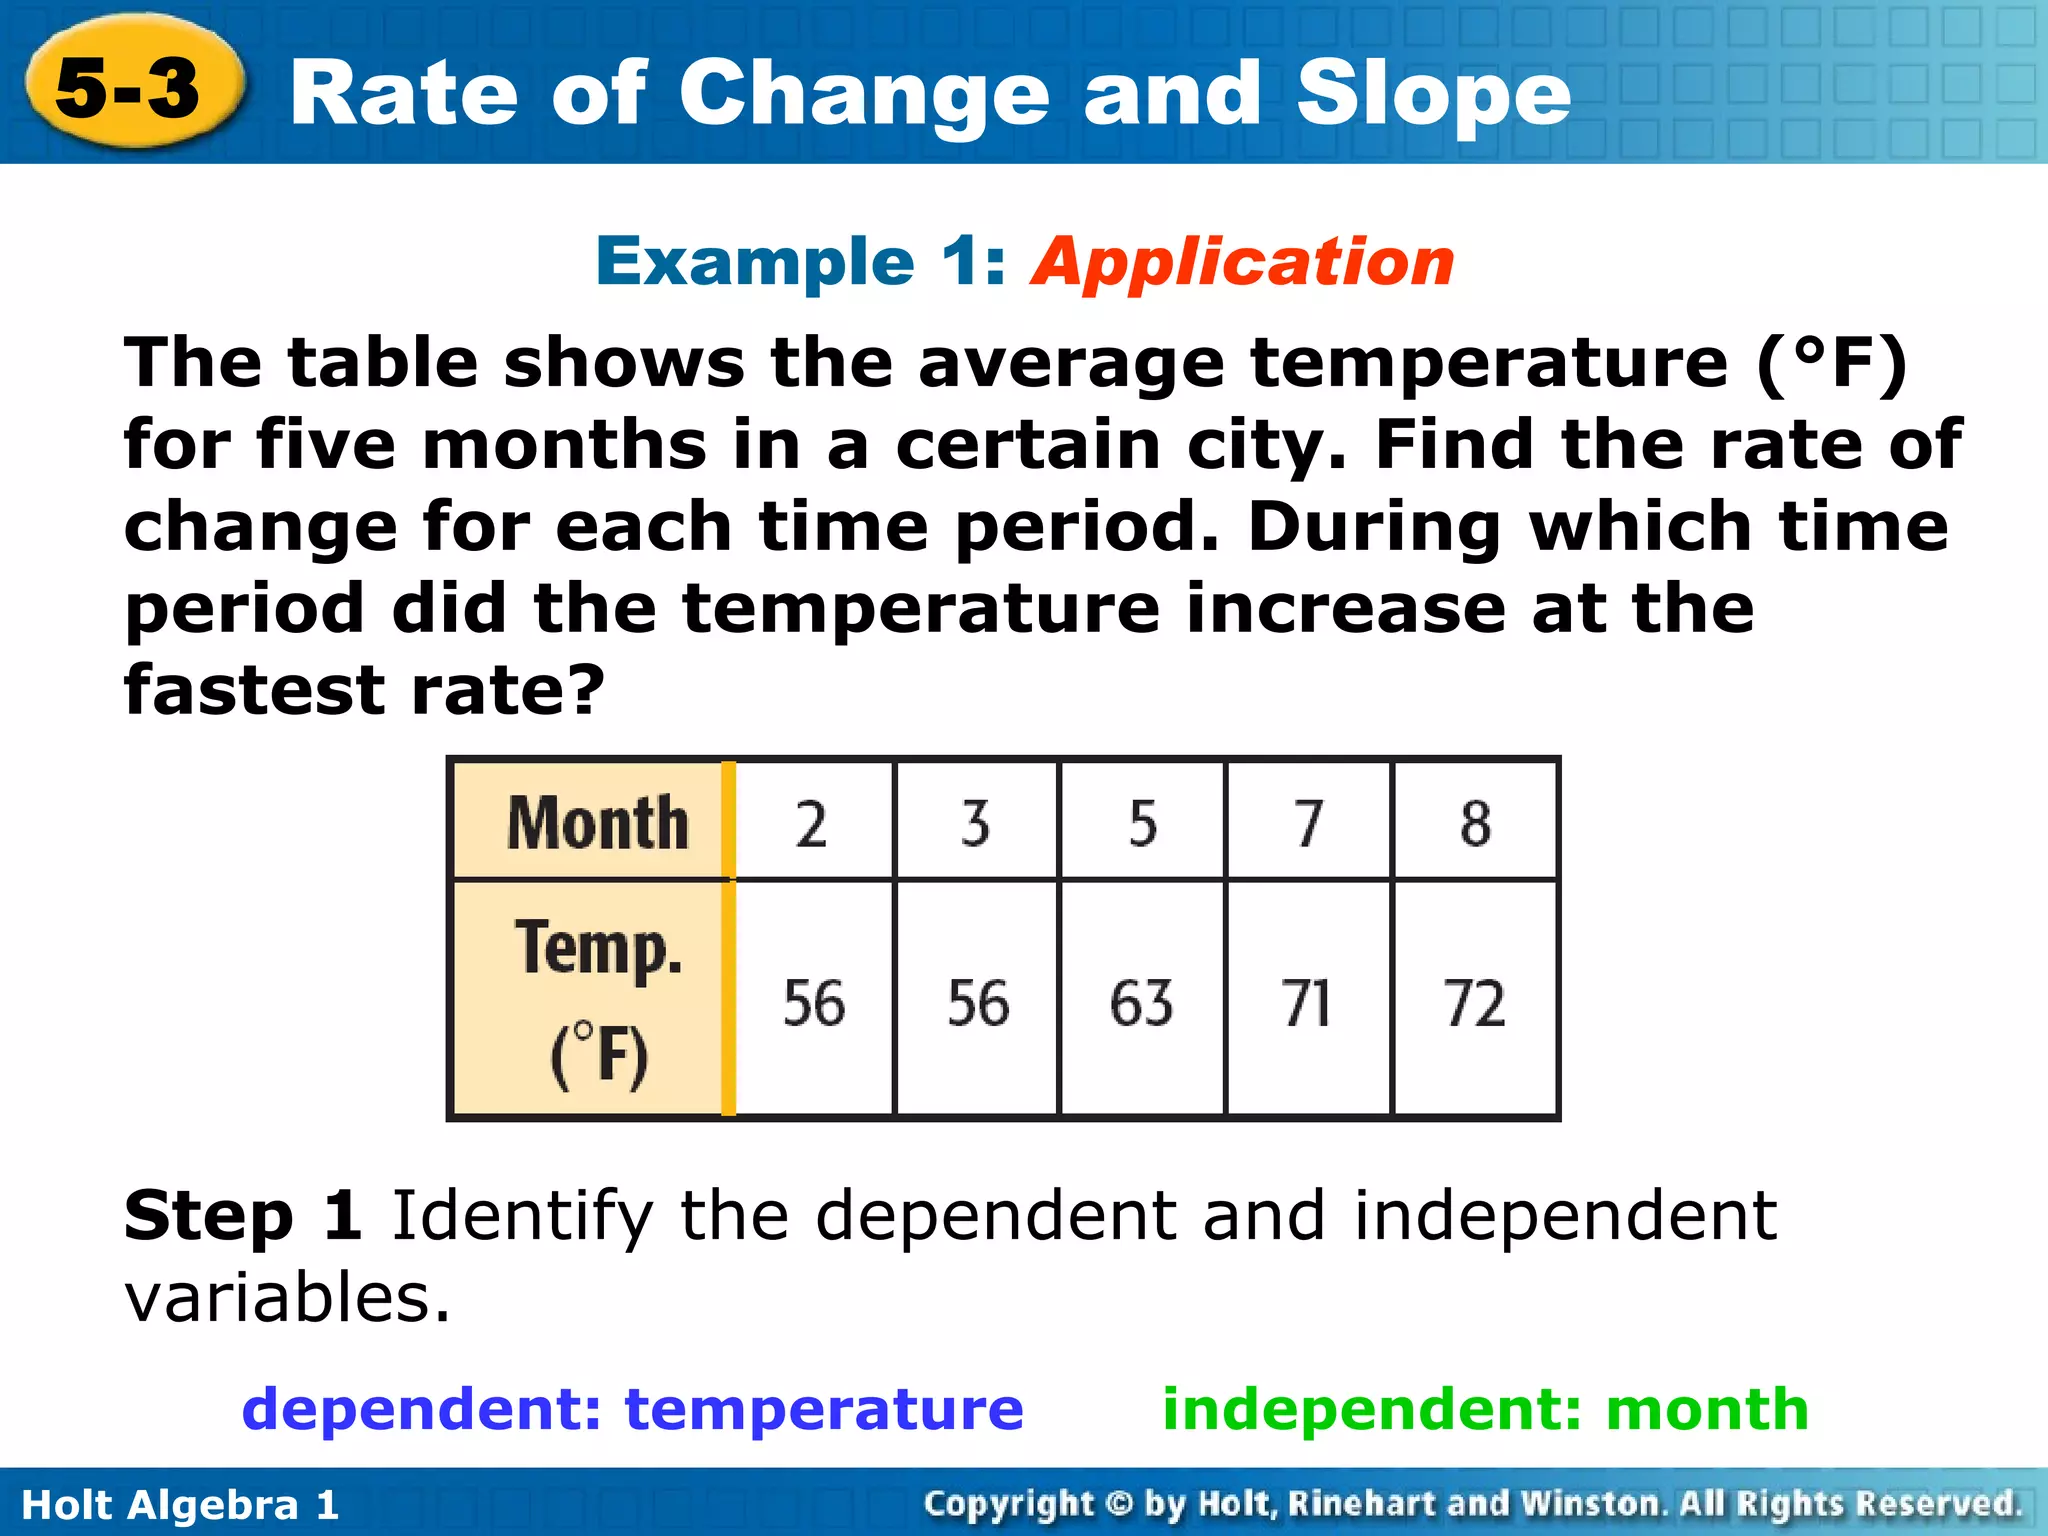
Example 1: Application The table shows the average temperature (°F) for five months in a certain city. Find the rate of change for each time period. During which time period did the temperature increase at the fastest rate? Step 1 Identify the dependent and independent variables. dependent: temperature independent: month
7.
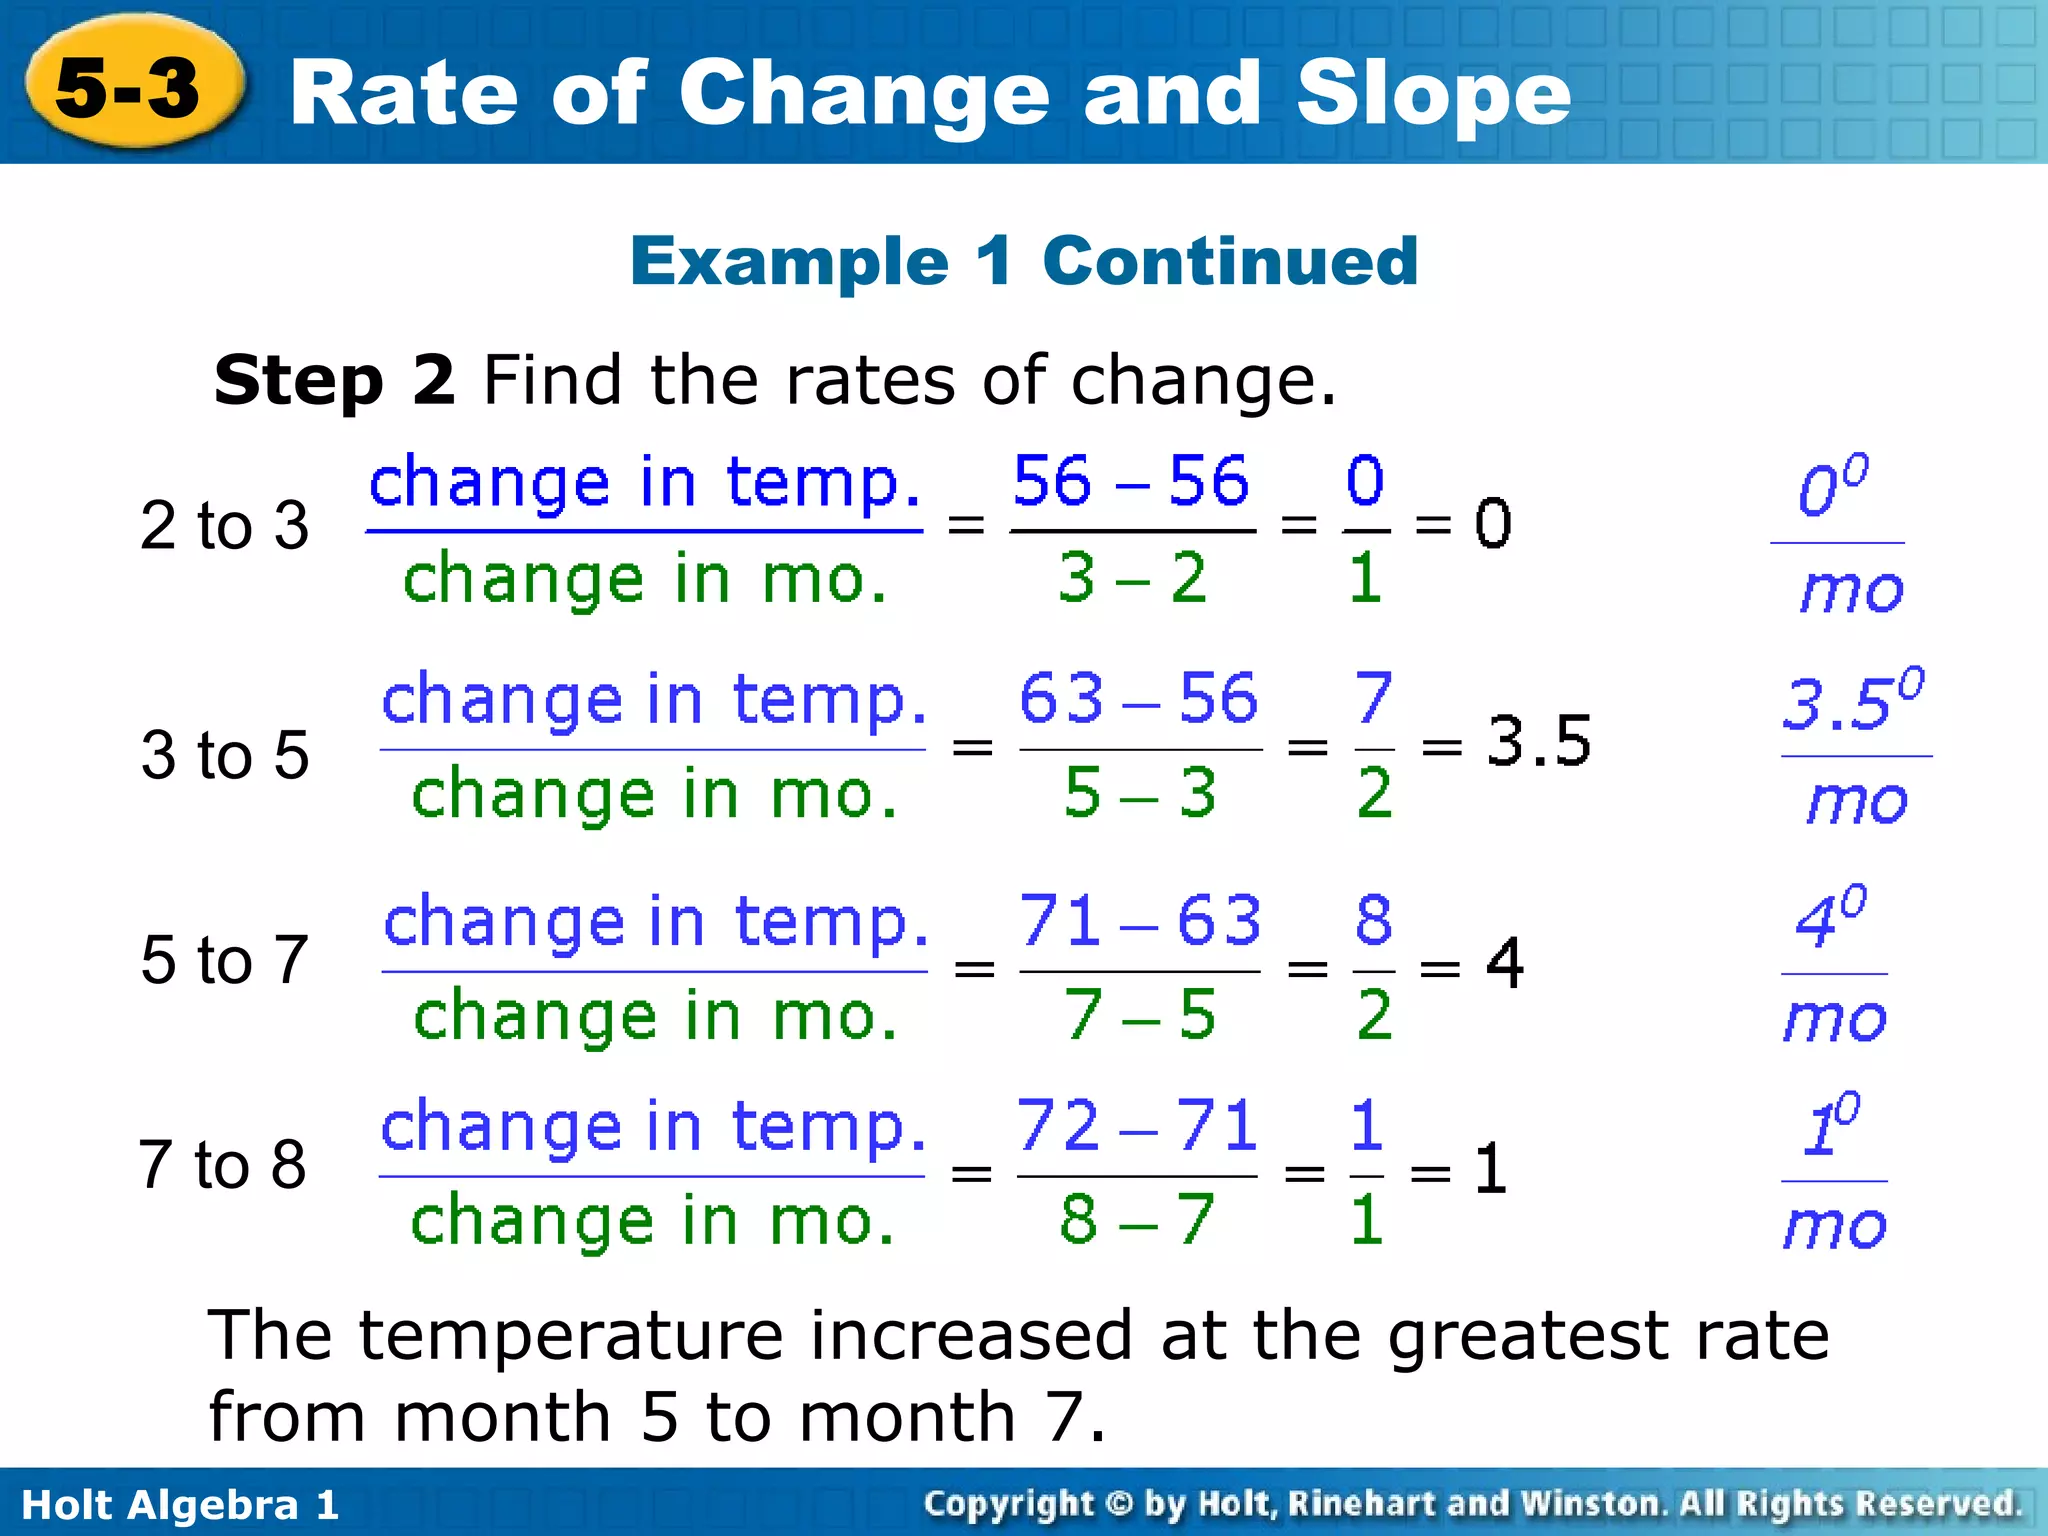
Step 2 Find the rates of change. Example 1 Continued The temperature increased at the greatest rate from month 5 to month 7. 3 to 5 5 to 7 7 to 8 2 to 3
8.
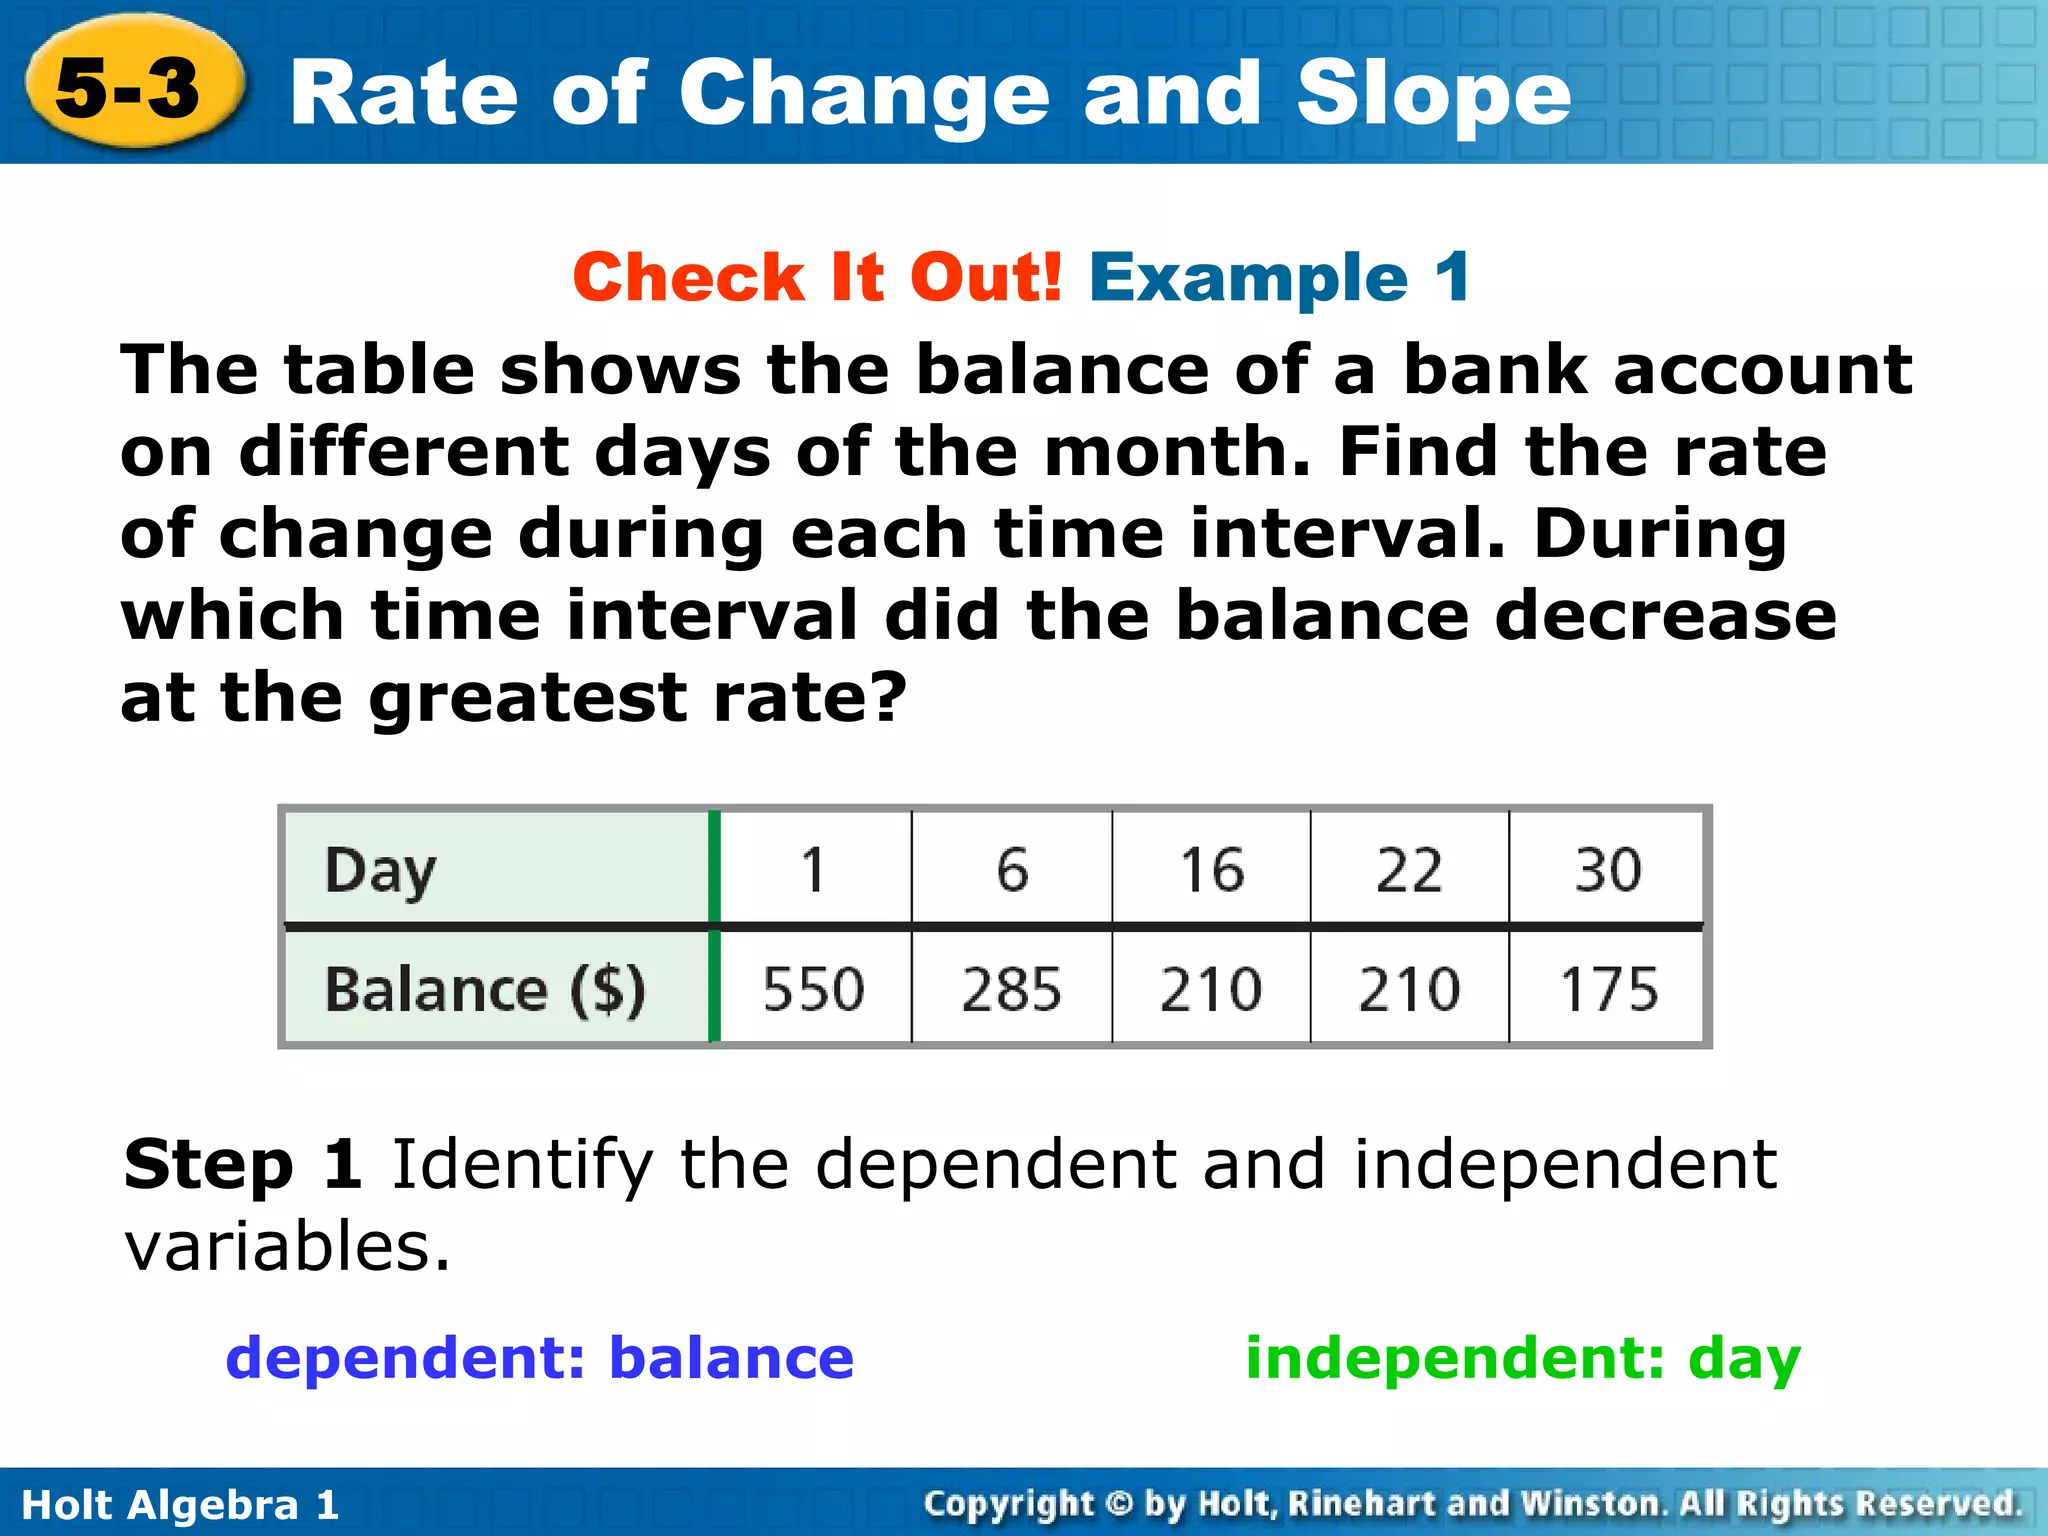
Check It Out! Example 1 The table shows the balance of a bank account on different days of the month. Find the rate of change during each time interval. During which time interval did the balance decrease at the greatest rate? Step 1 Identify the dependent and independent variables. dependent: balance independent: day
9.
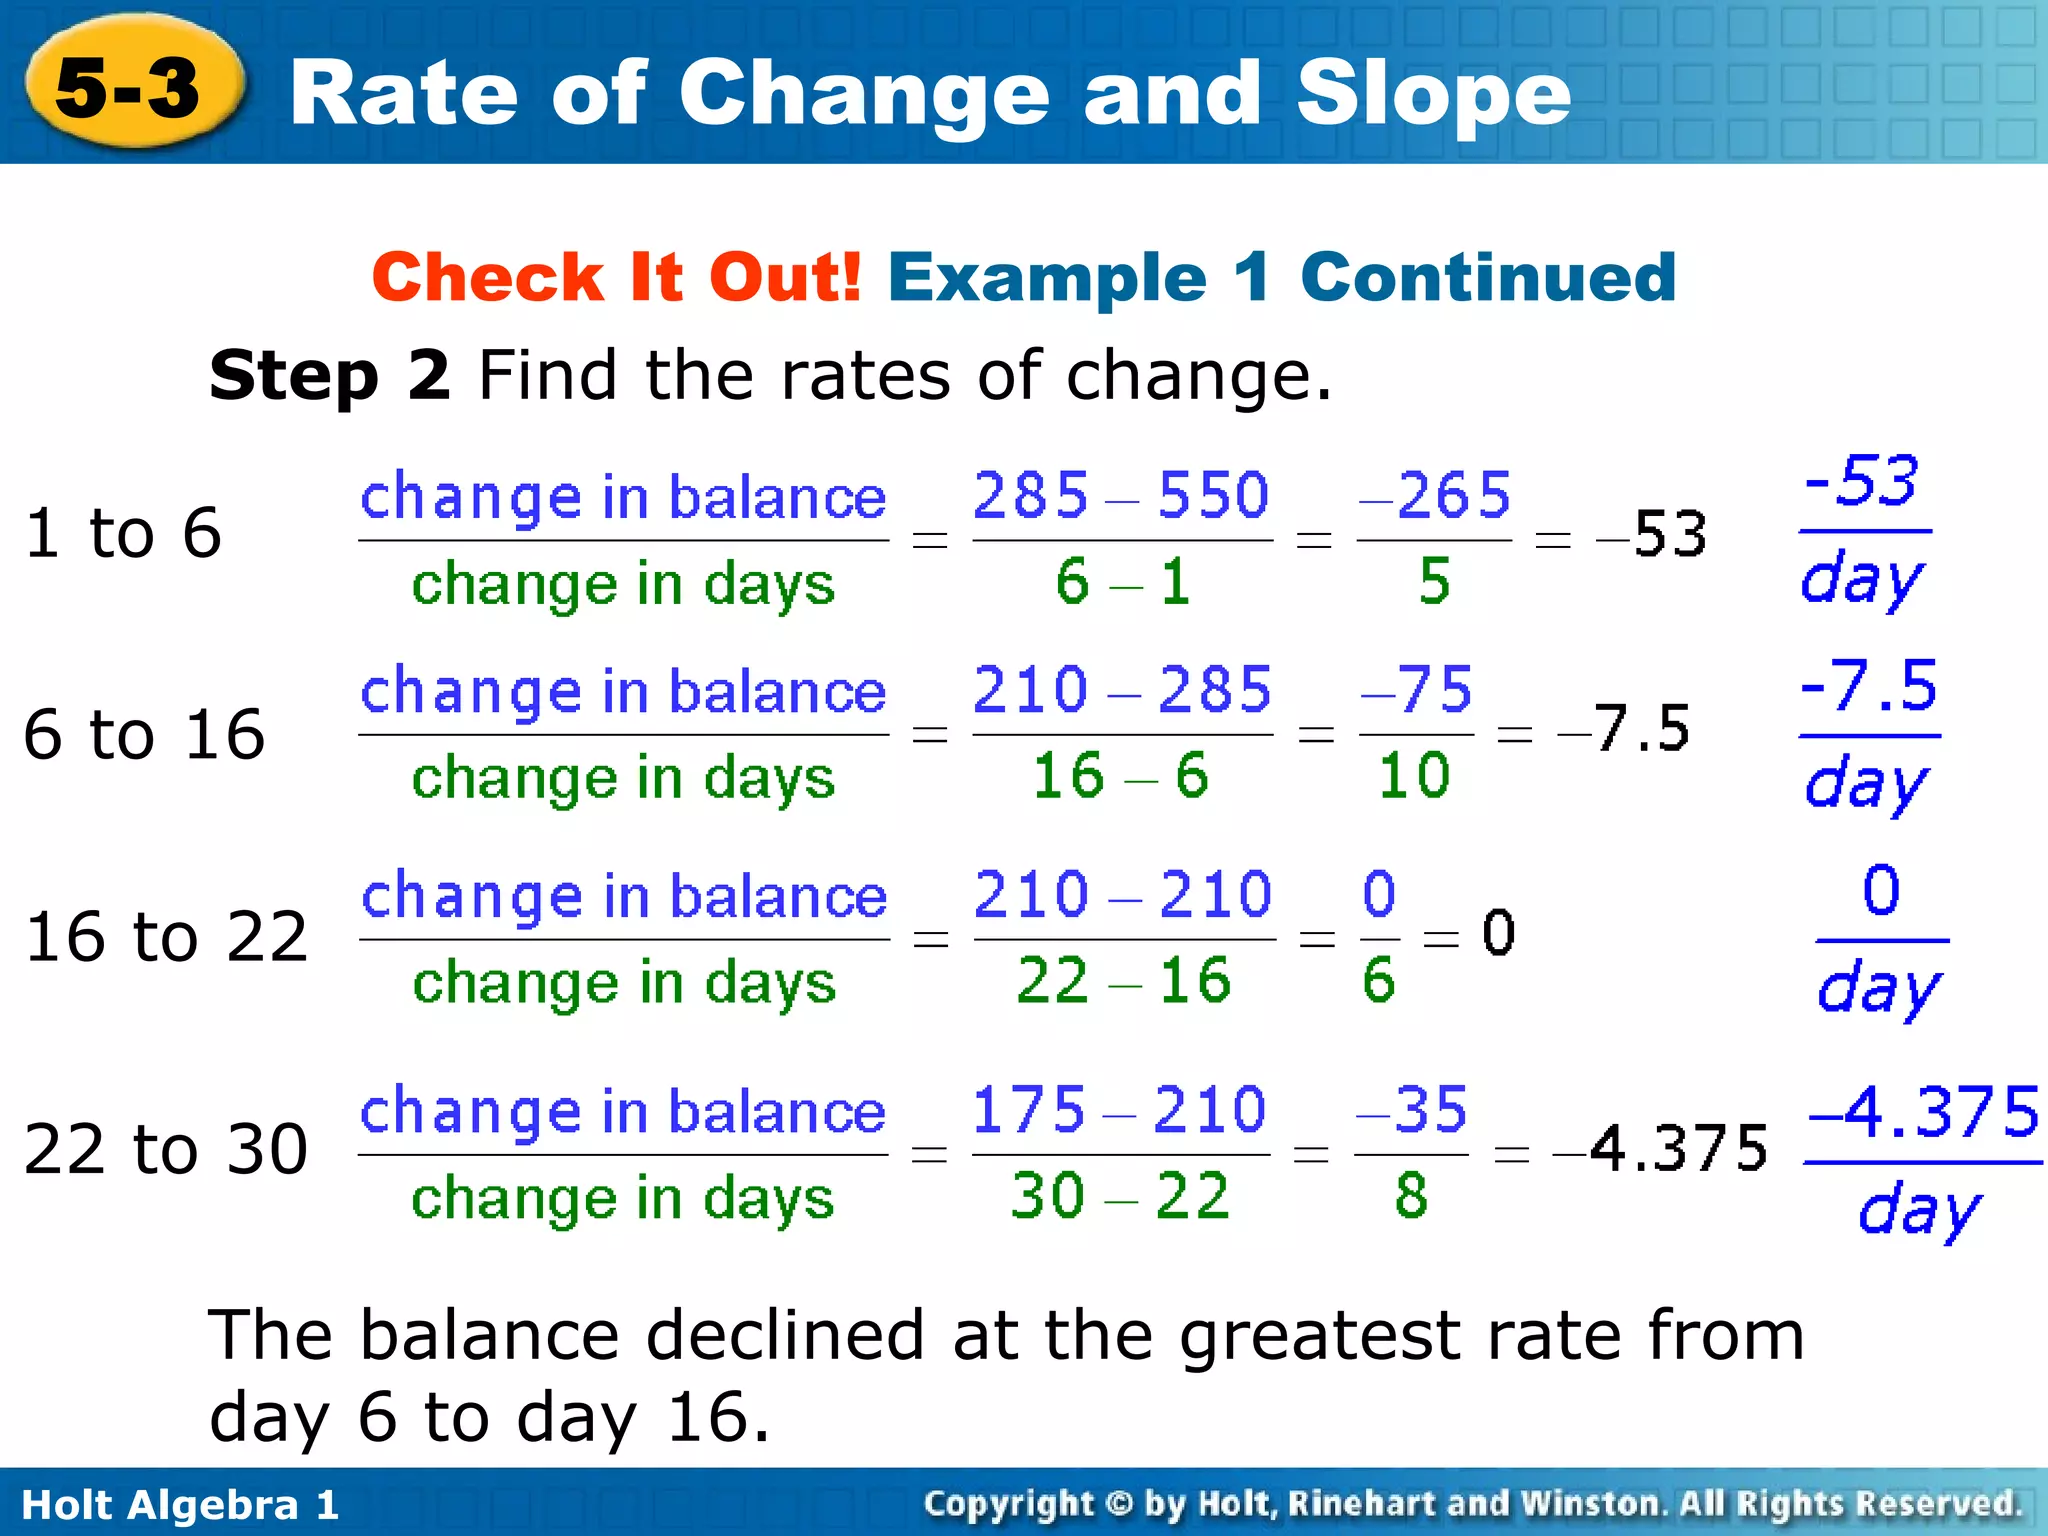
Step 2 Find the rates of change. Check It Out! Example 1 Continued The balance declined at the greatest rate from day 6 to day 16. 1 to 6 6 to 16 16 to 22 22 to 30
10.
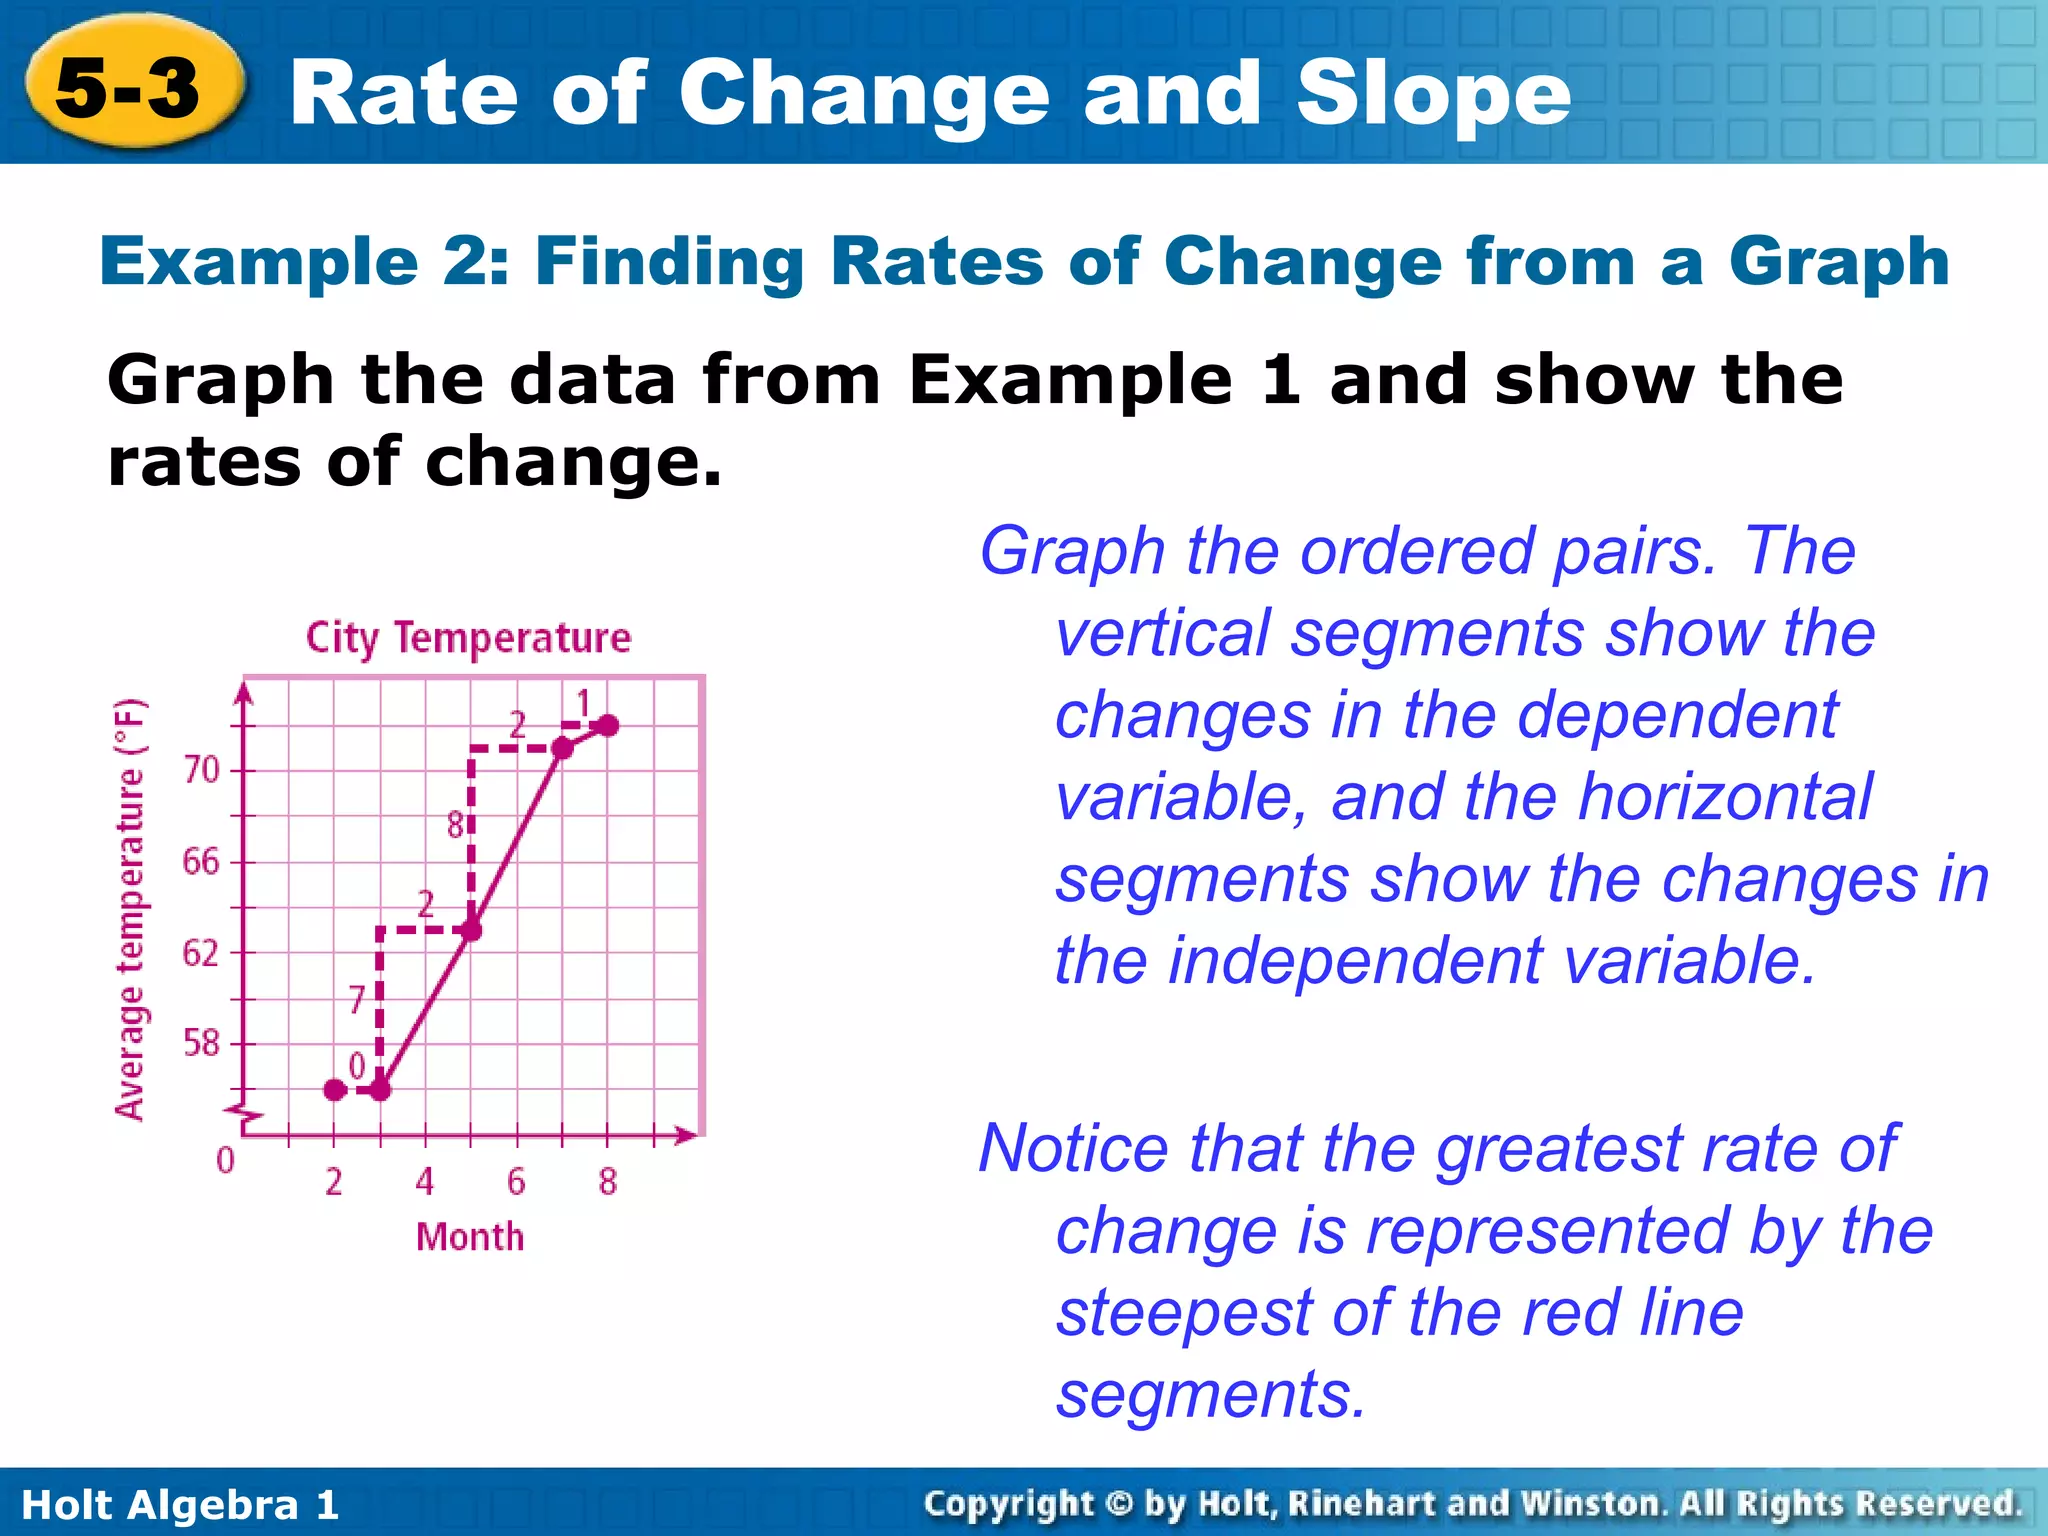
Example 2: FindingRates of Change from a Graph Graph the data from Example 1 and show the rates of change. Graph the ordered pairs. The vertical segments show the changes in the dependent variable, and the horizontal segments show the changes in the independent variable. Notice that the greatest rate of change is represented by the steepest of the red line segments.
11.
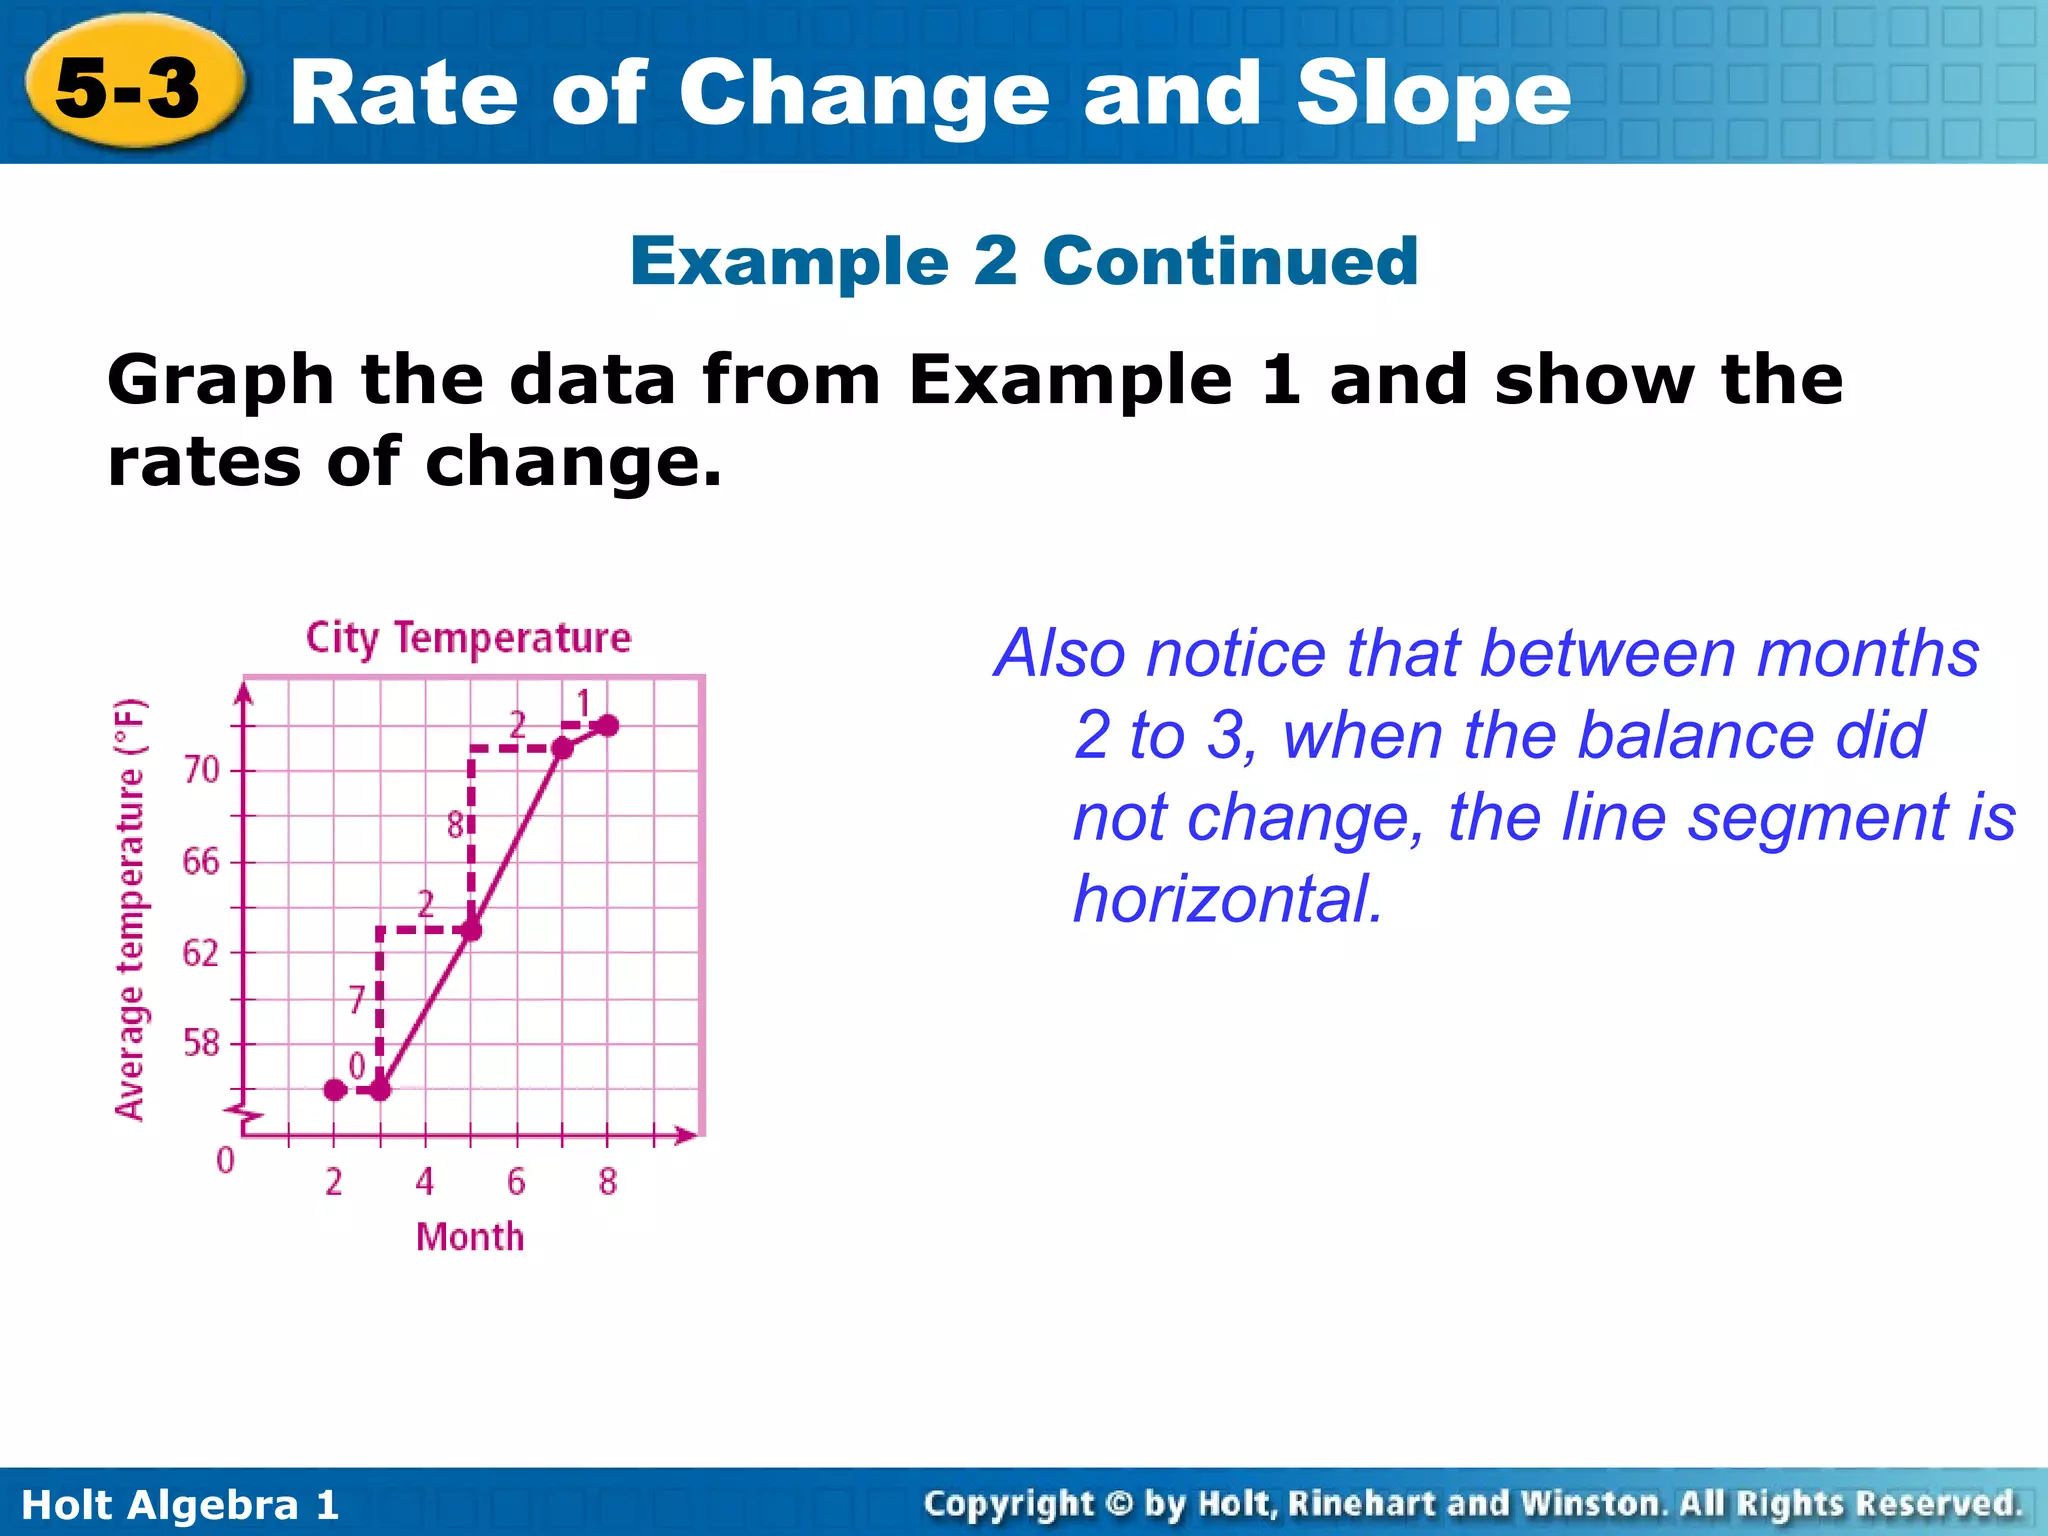
Example 2 ContinuedGraph the data from Example 1 and show the rates of change. Also notice that between months 2 to 3, when the balance did not change, the line segment is horizontal.
12.
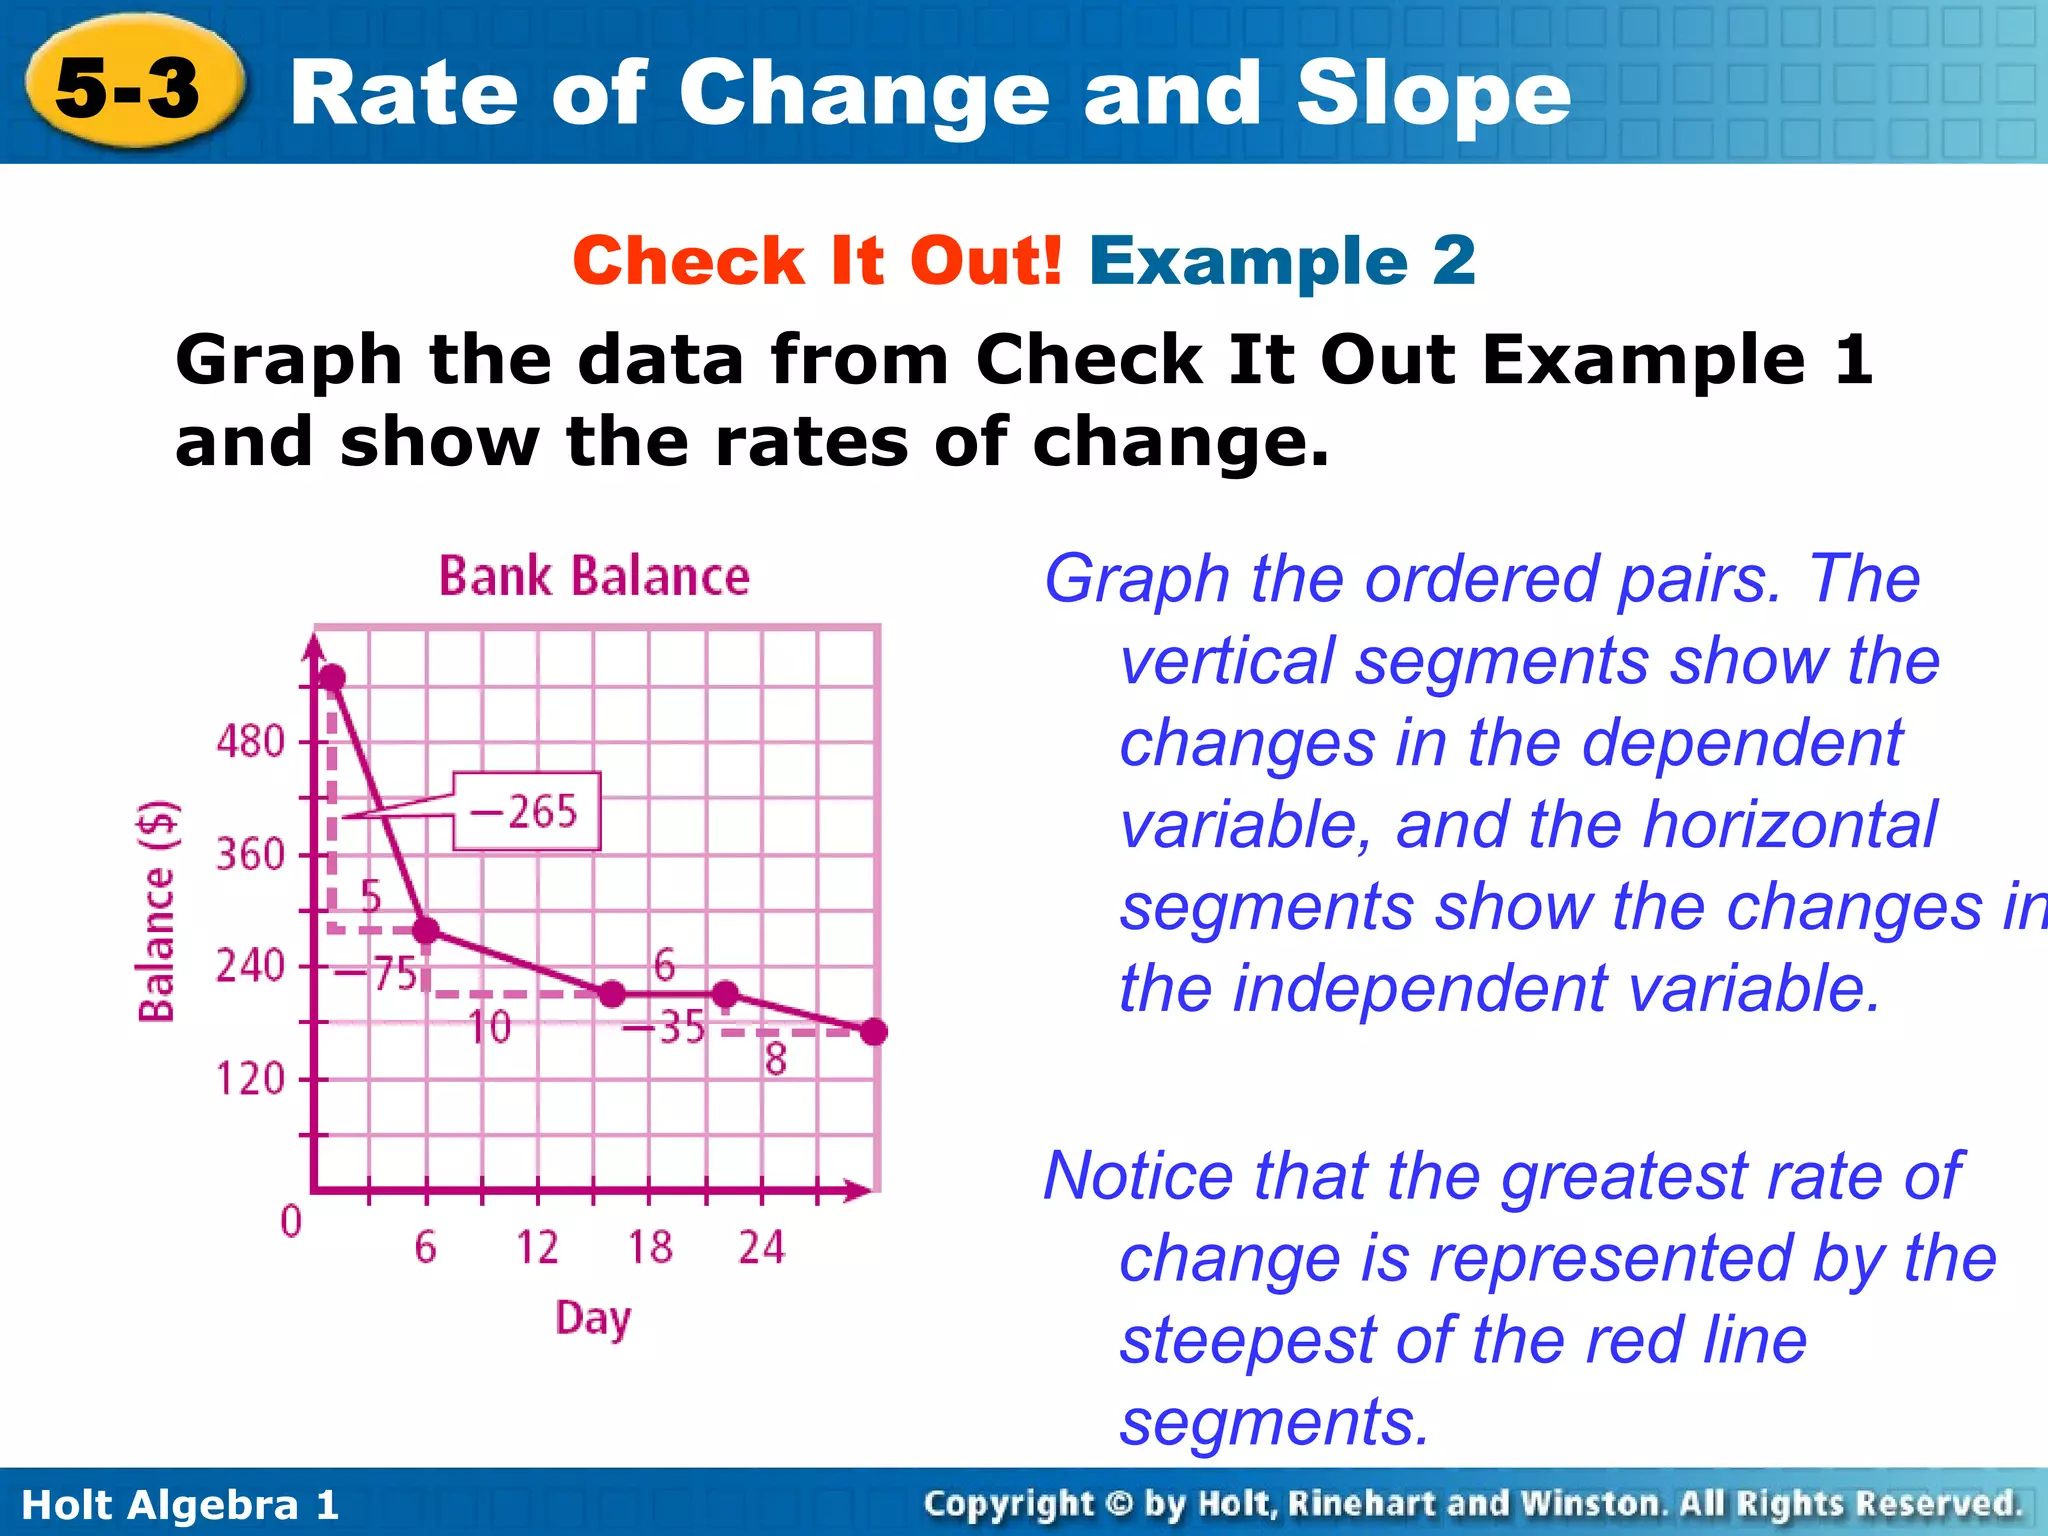
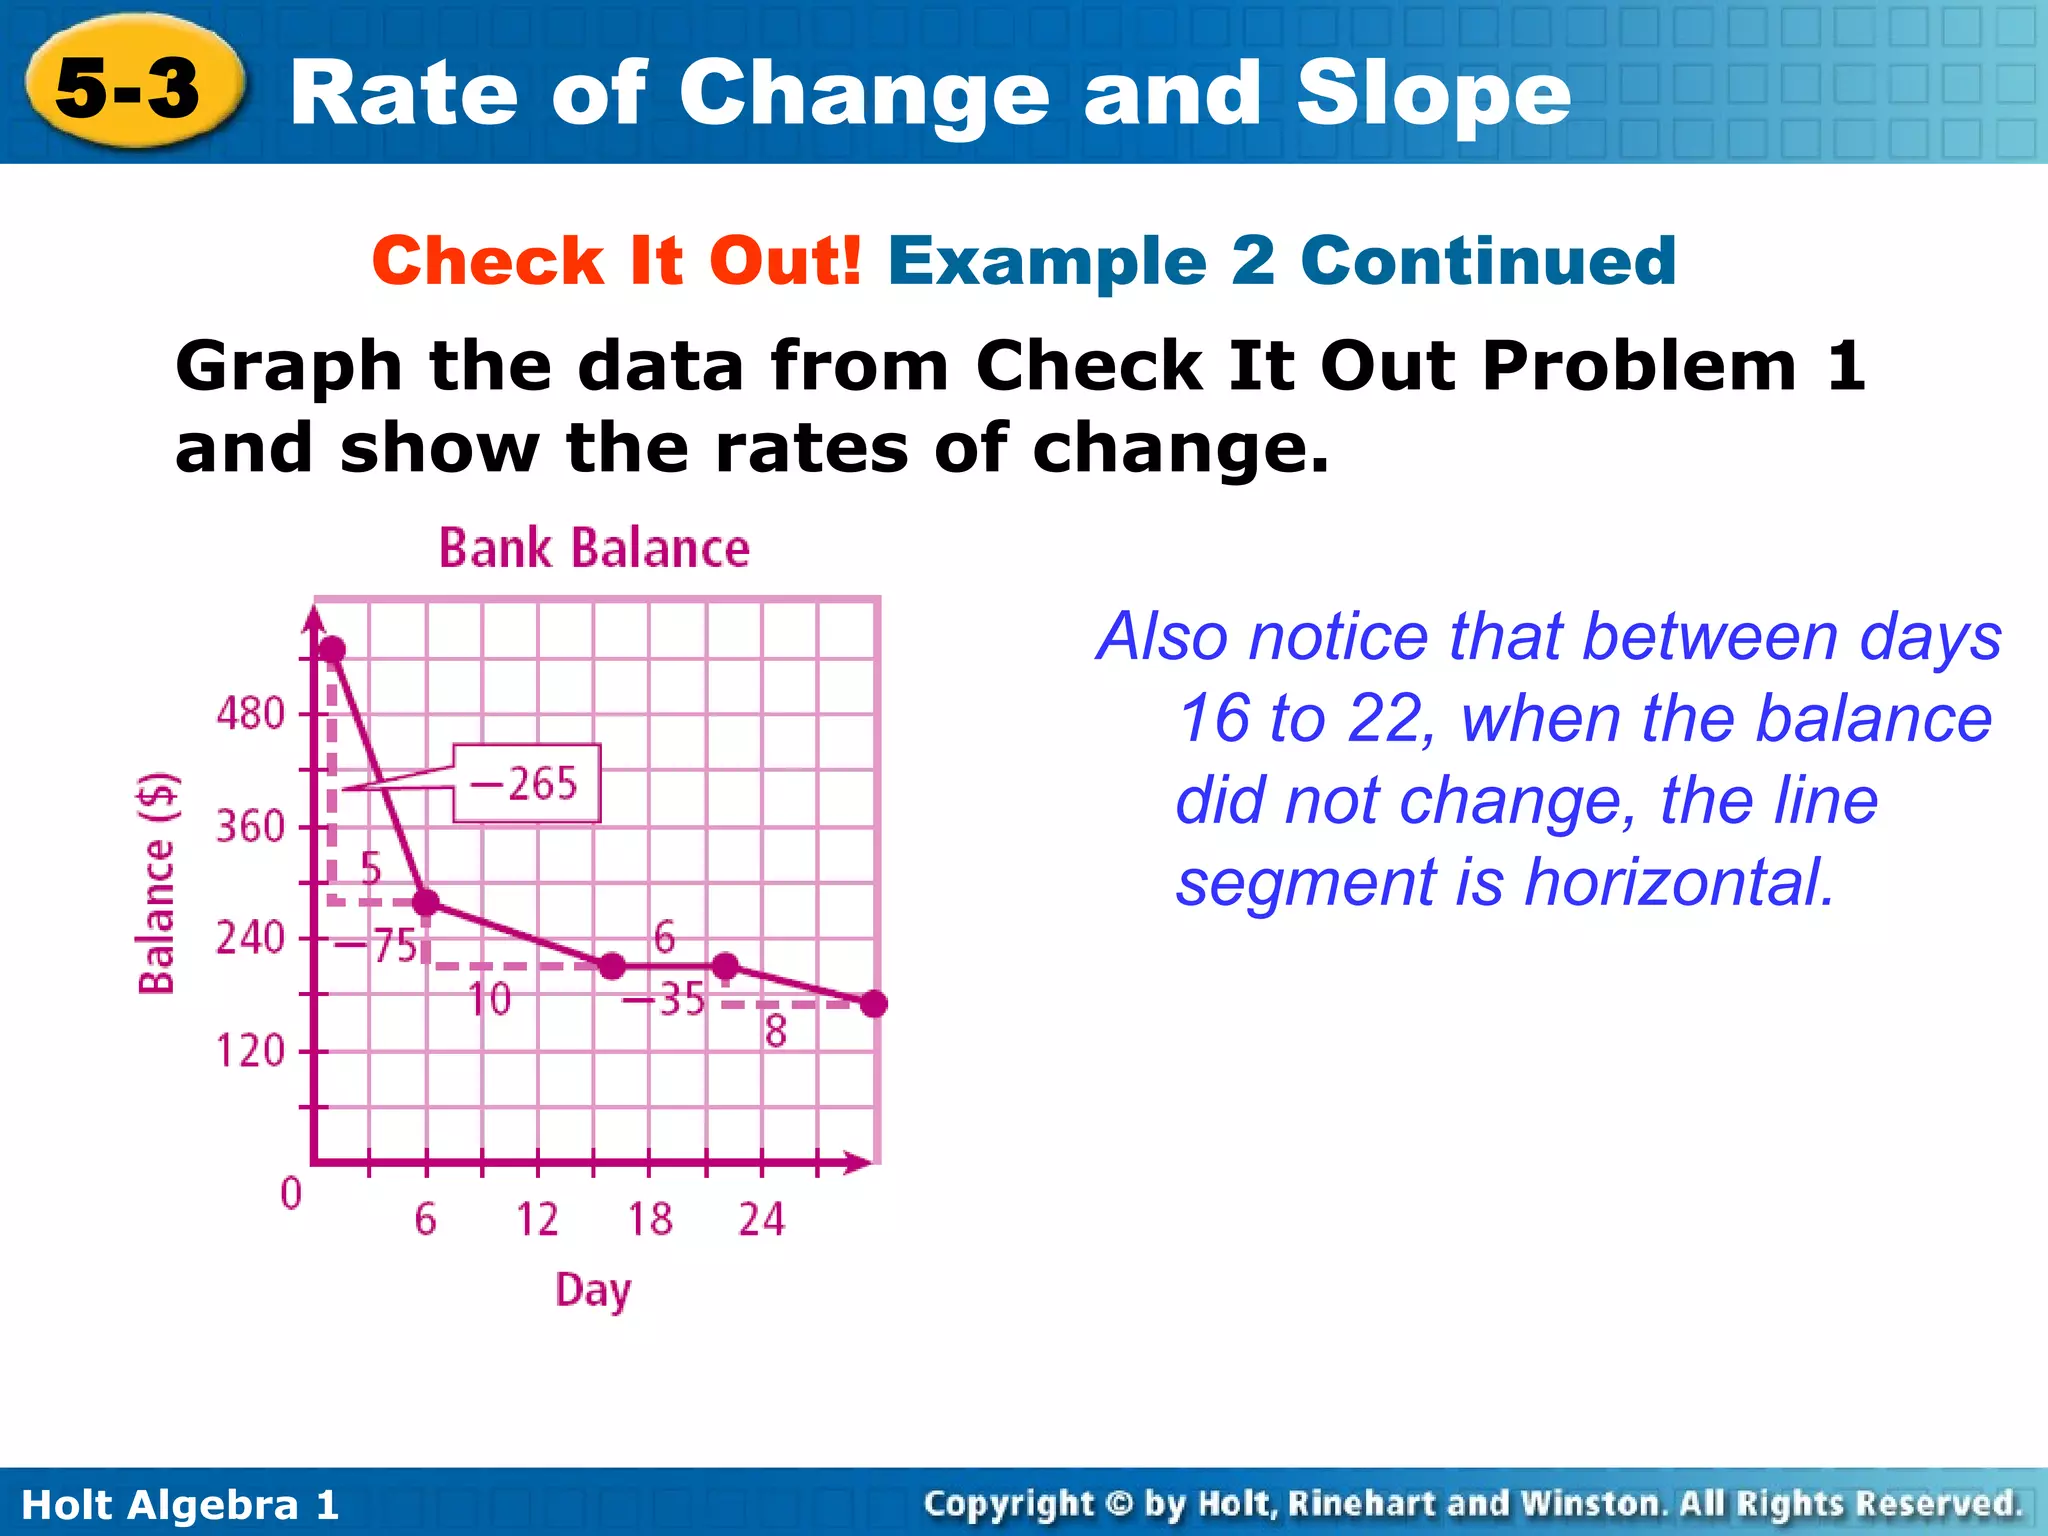
Check It Out! Example 2 Graph the data from Check It Out Example 1 and show the rates of change. Graph the ordered pairs. The vertical segments show the changes in the dependent variable, and the horizontal segments show the changes in the independent variable. Notice that the greatest rate of change is represented by the steepest of the red line segments.
13.
Check It Out! Example 2 Continued Graph the data from Check It Out Problem 1 and show the rates of change. Also notice that between days 16 to 22, when the balance did not change, the line segment is horizontal.
14.
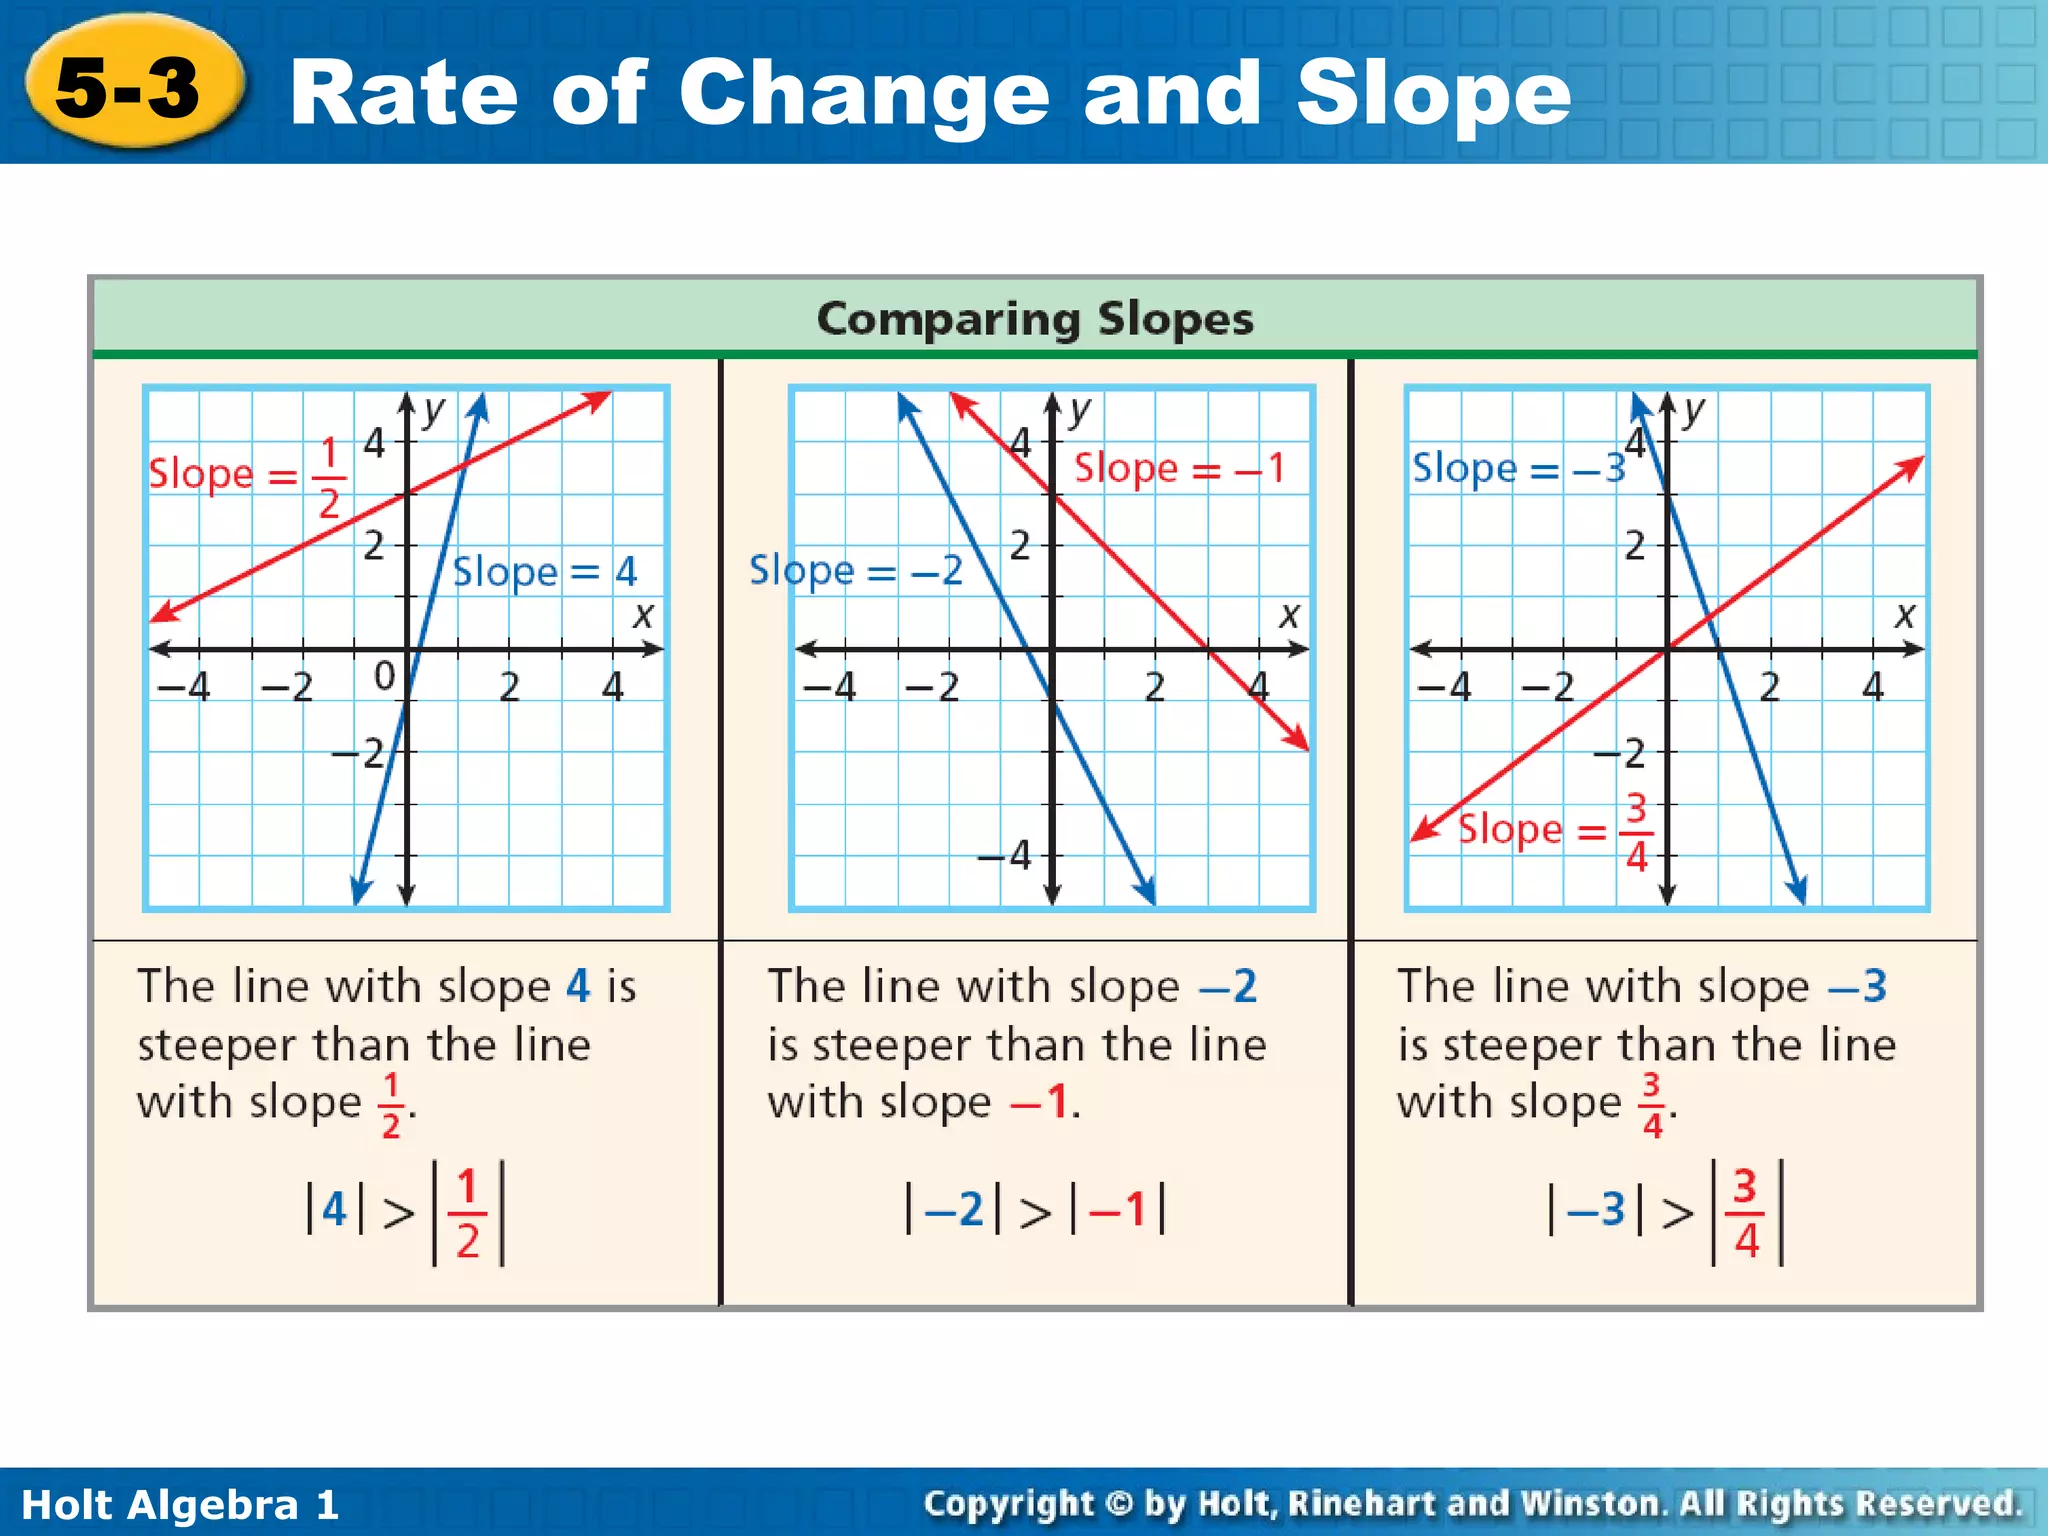
If all ofthe connected segments have the same rate of change, then they all have the same steepness and together form a straight line. The constant rate of change of a line is called the slope of the line.
15.
16.
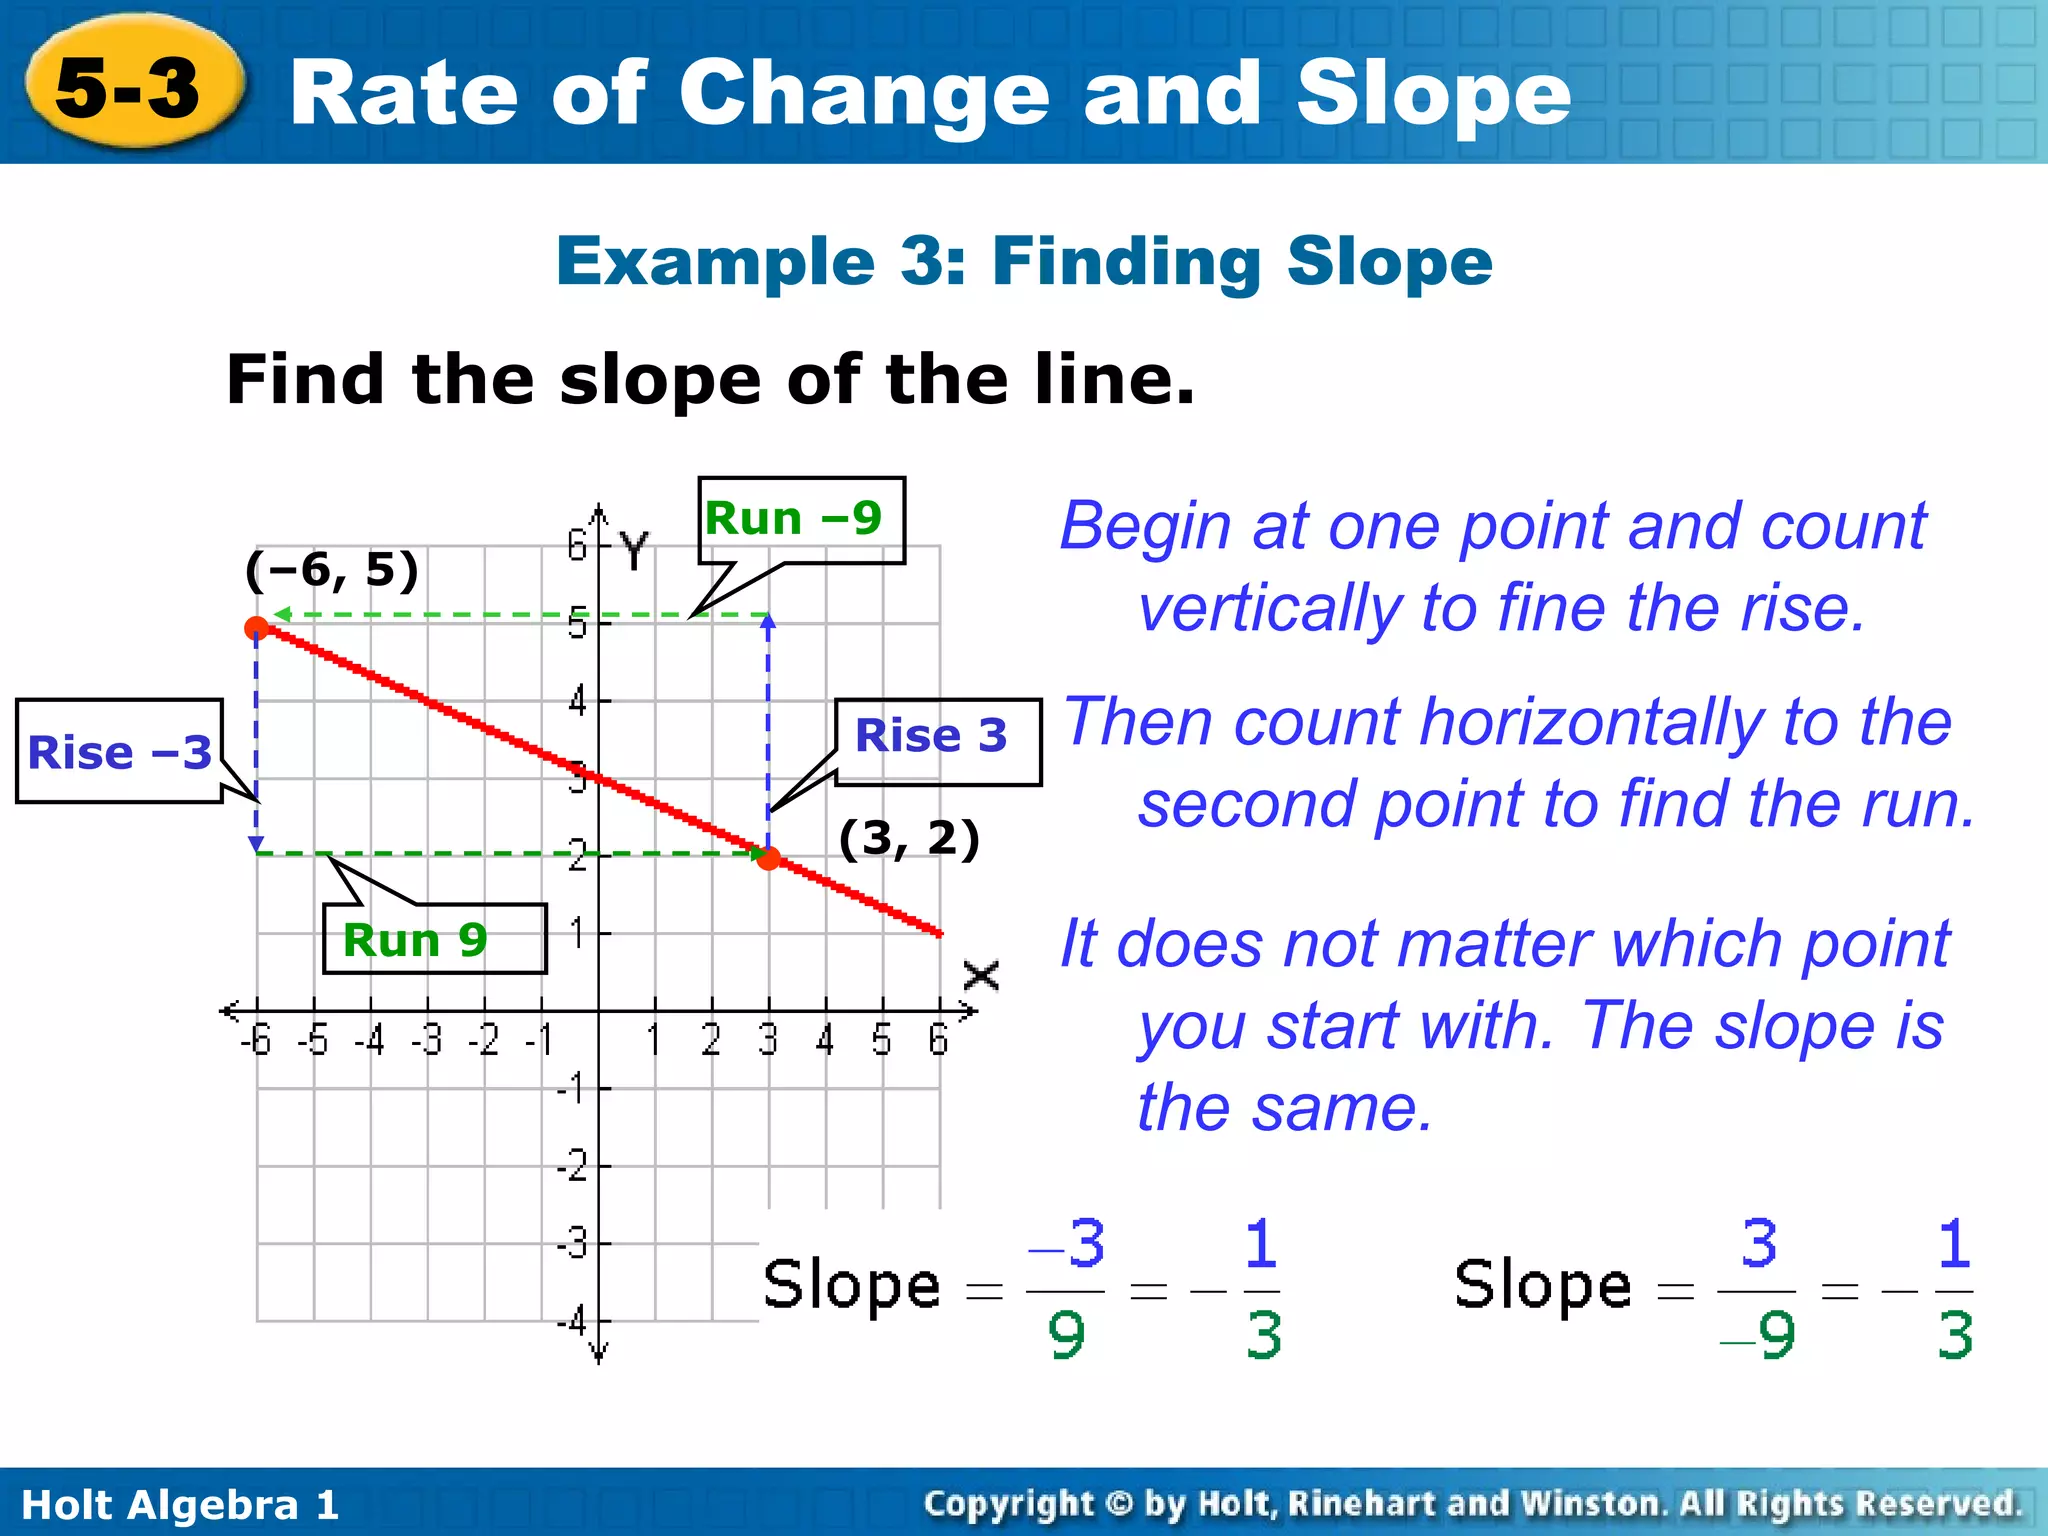
Example 3: FindingSlope Find the slope of the line. Begin at one point and count vertically to fine the rise. Then count horizontally to the second point to find the run. It does not matter which point you start with. The slope is the same. (3, 2) (–6, 5) • • Rise 3 Run –9 Rise –3 Run 9
17.
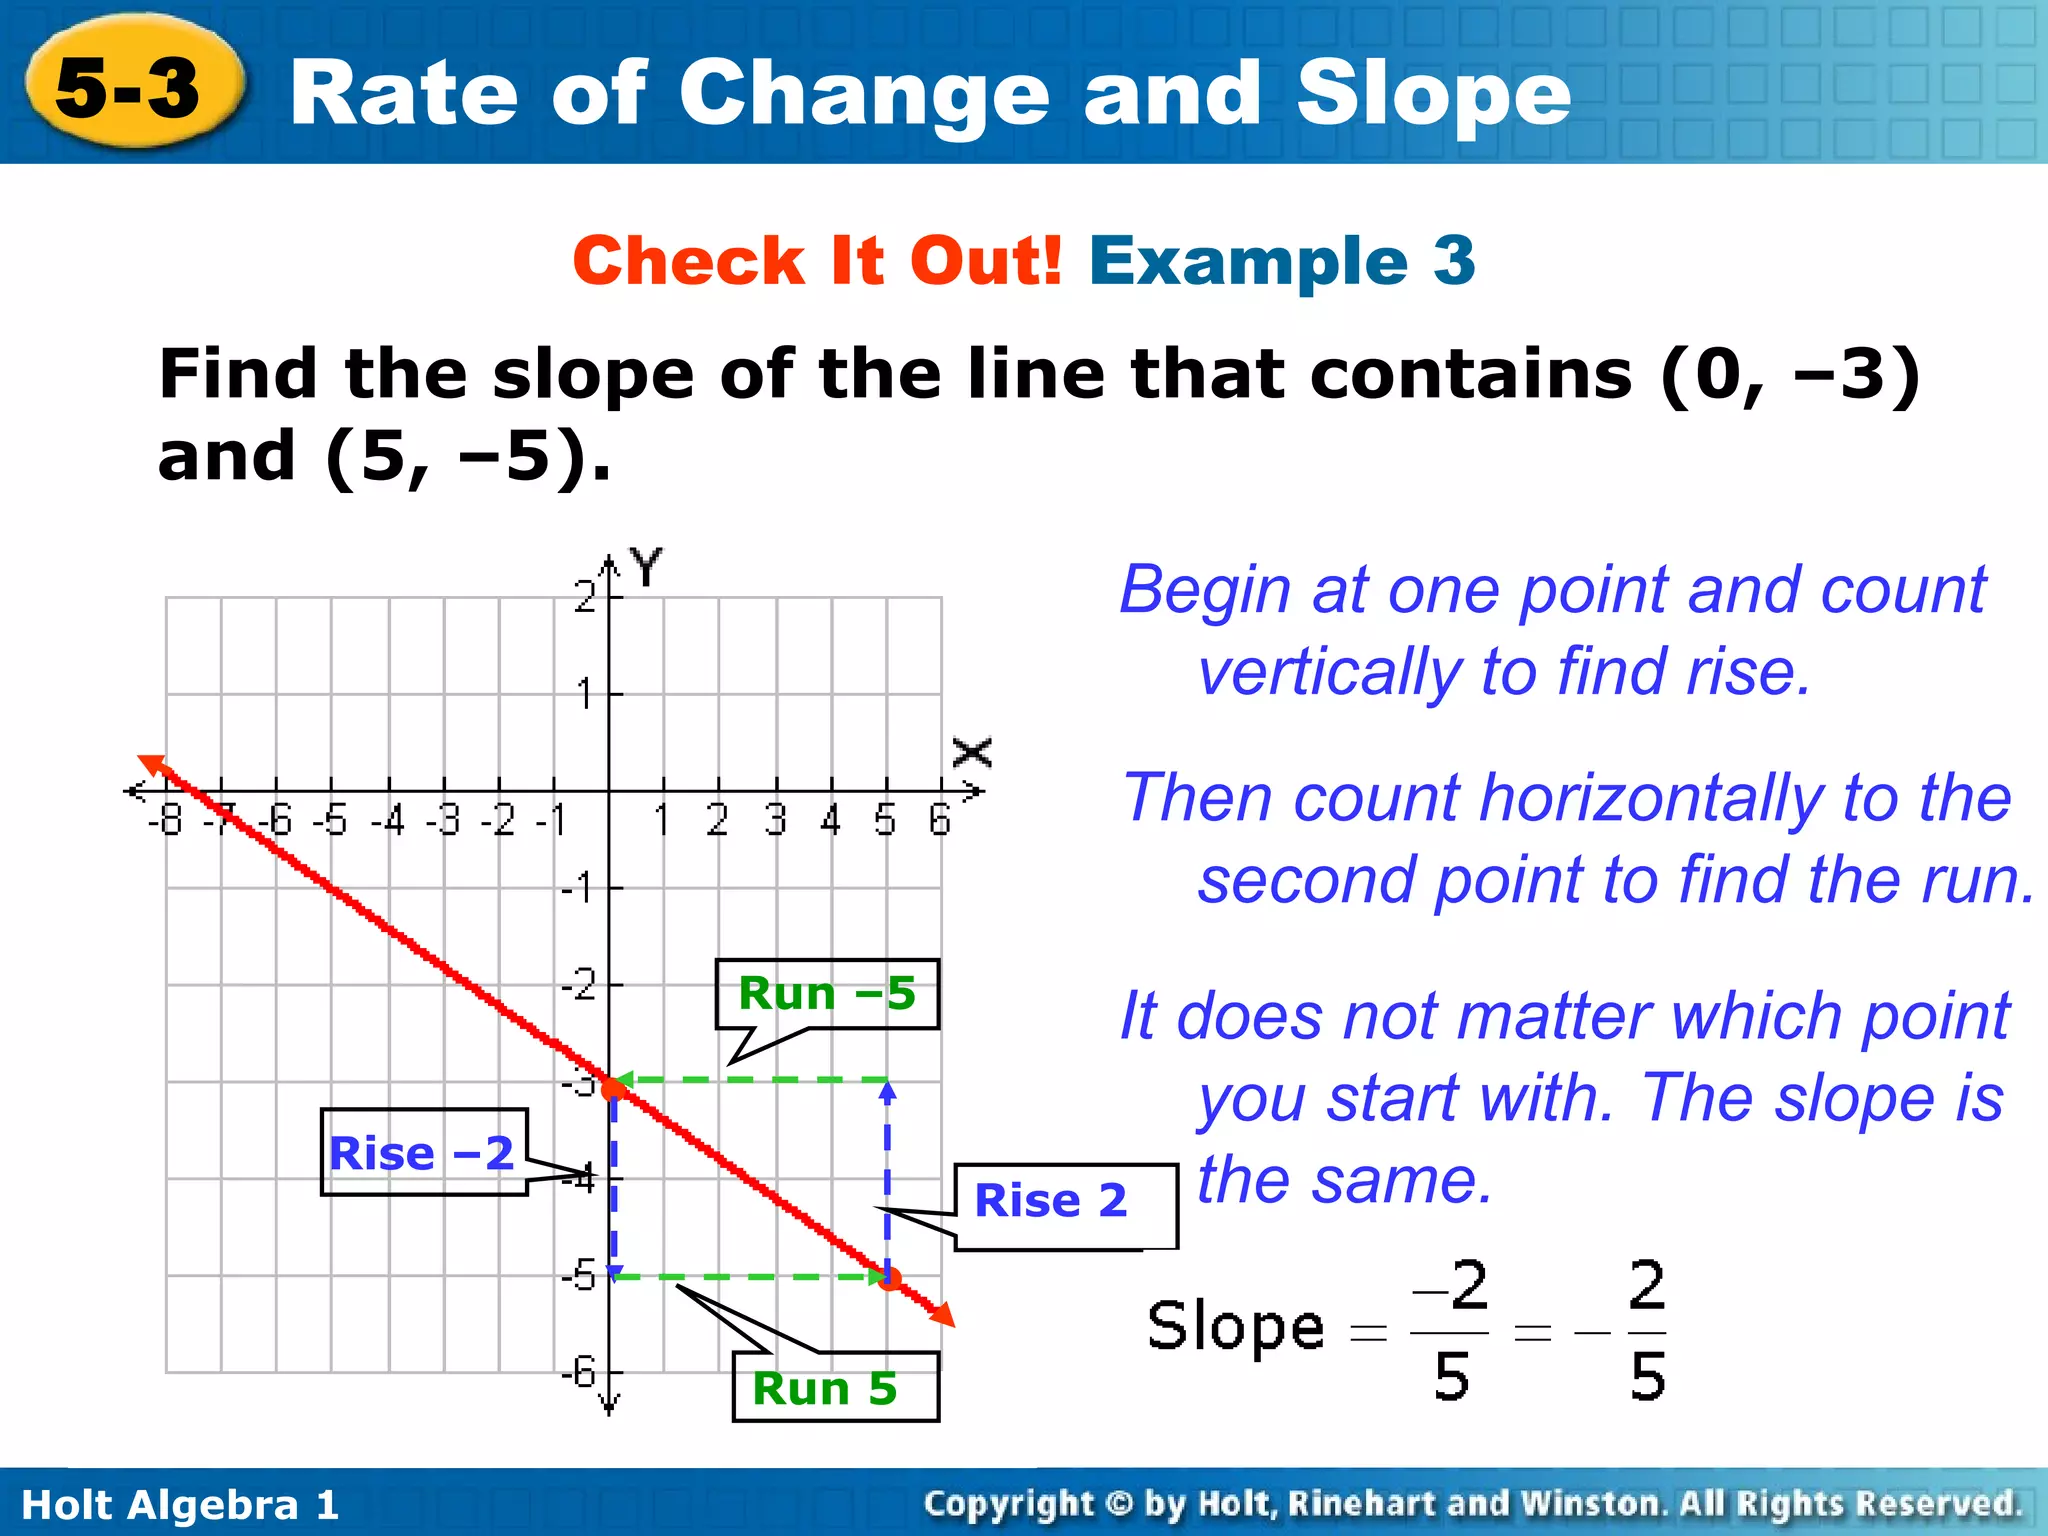
Check It Out! Example 3 Find the slope of the line that contains (0, –3) and (5, –5). Begin at one point and count vertically to find rise. • • Then count horizontally to the second point to find the run. It does not matter which point you start with. The slope is the same. Rise 2 Run –5 Rise –2 Run 5
18.
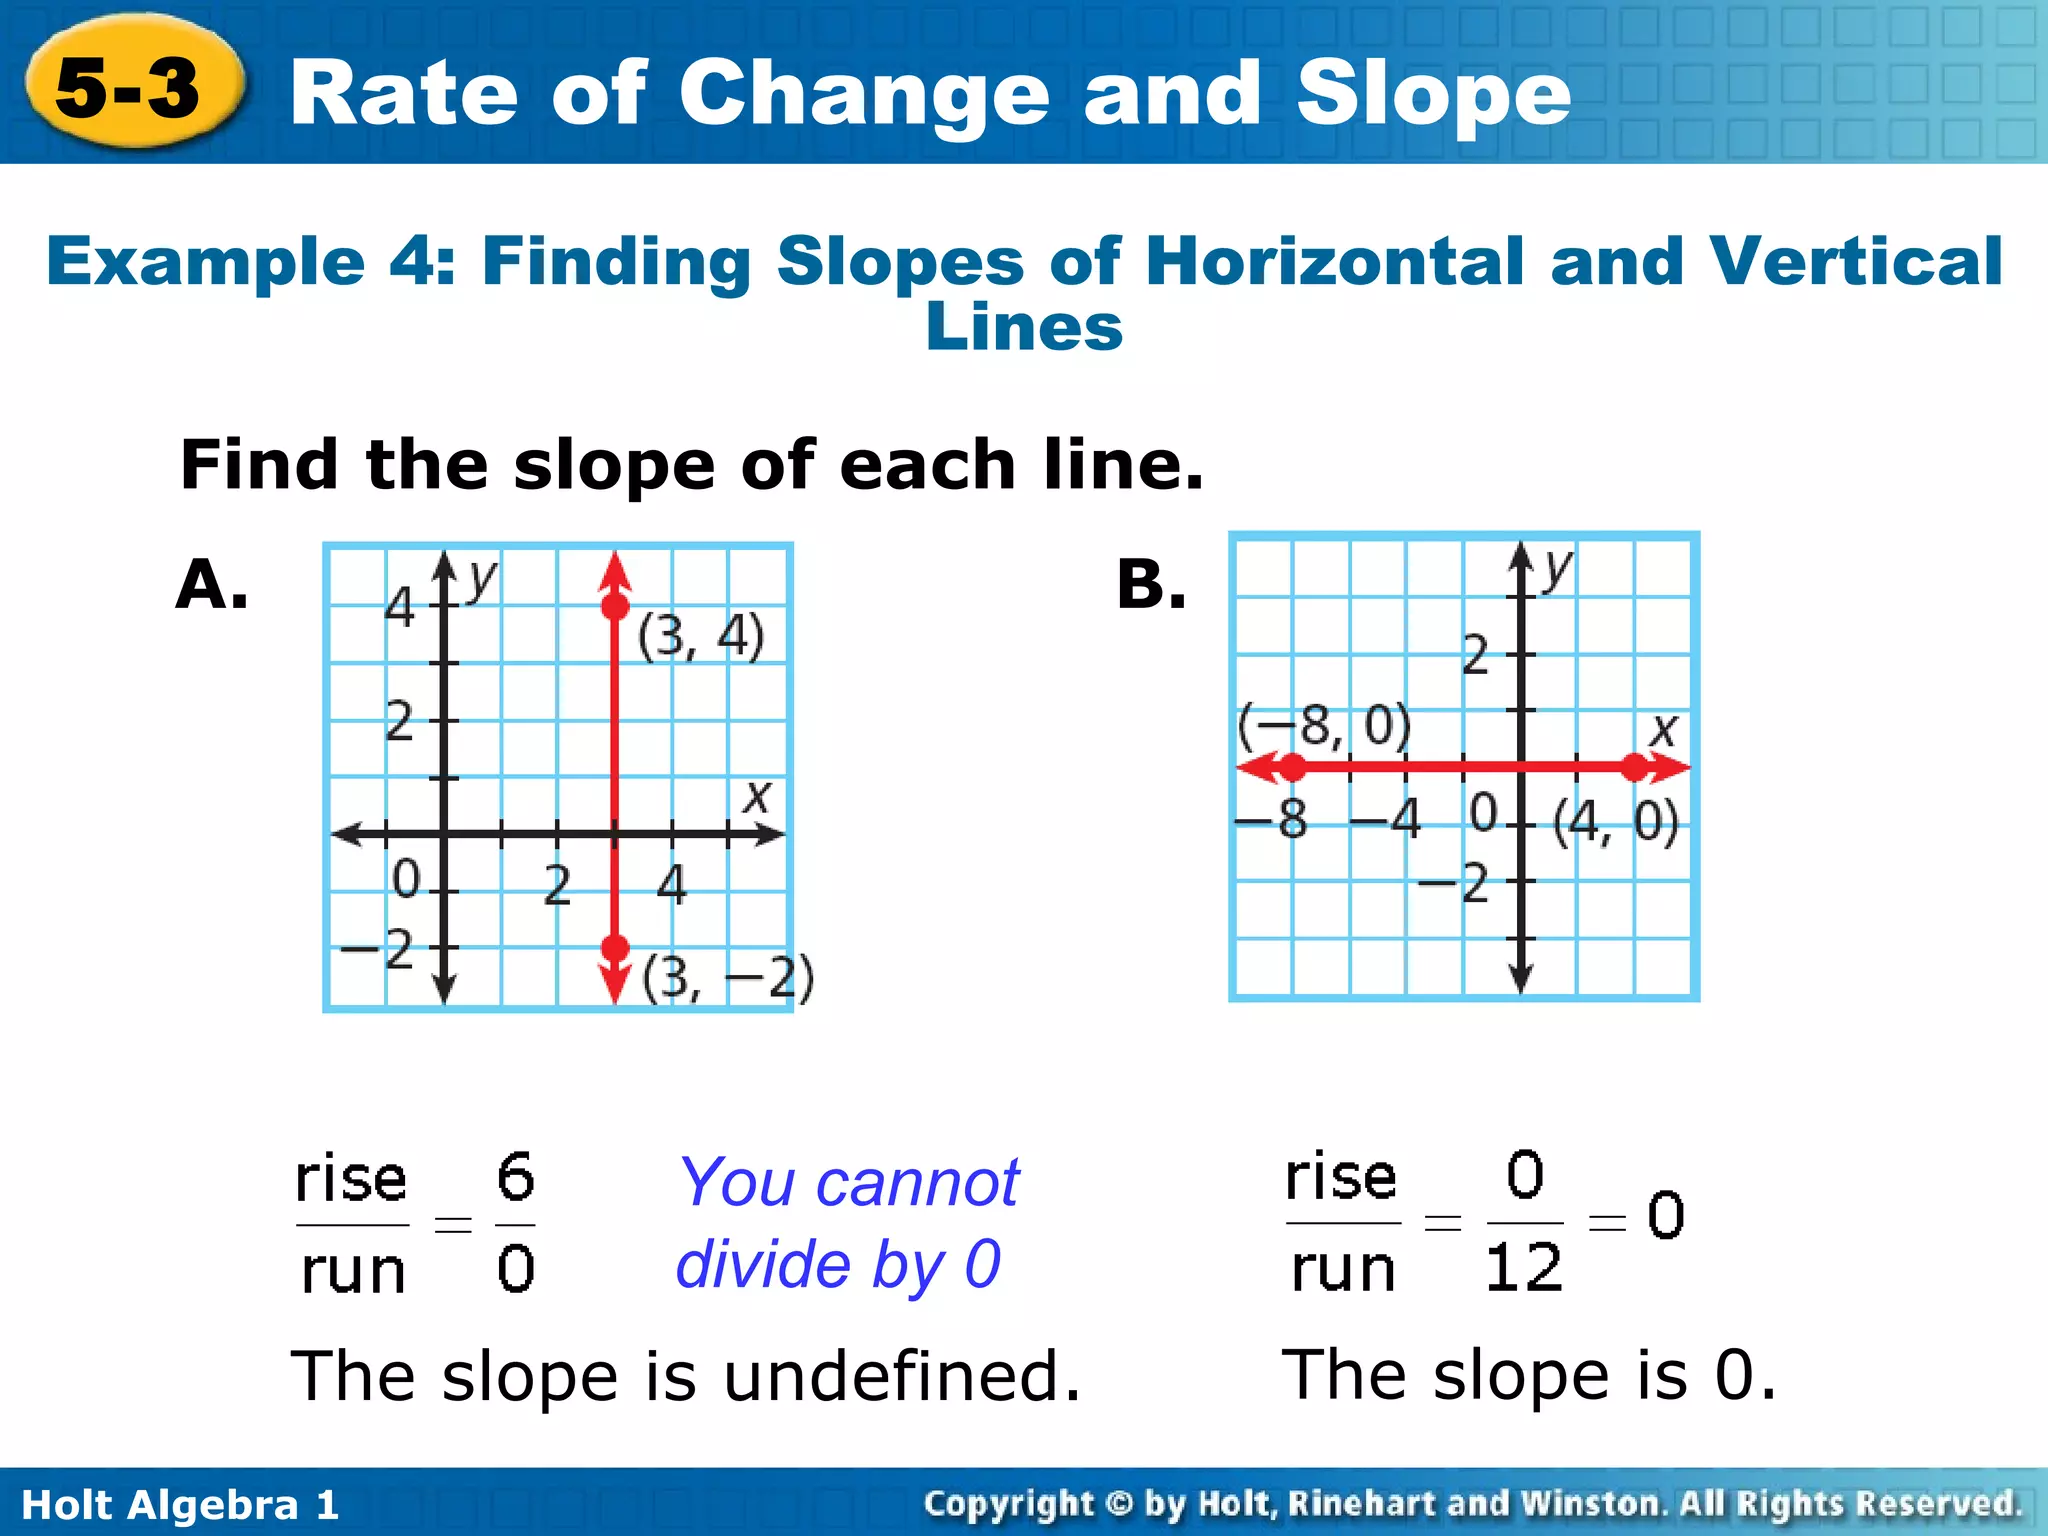
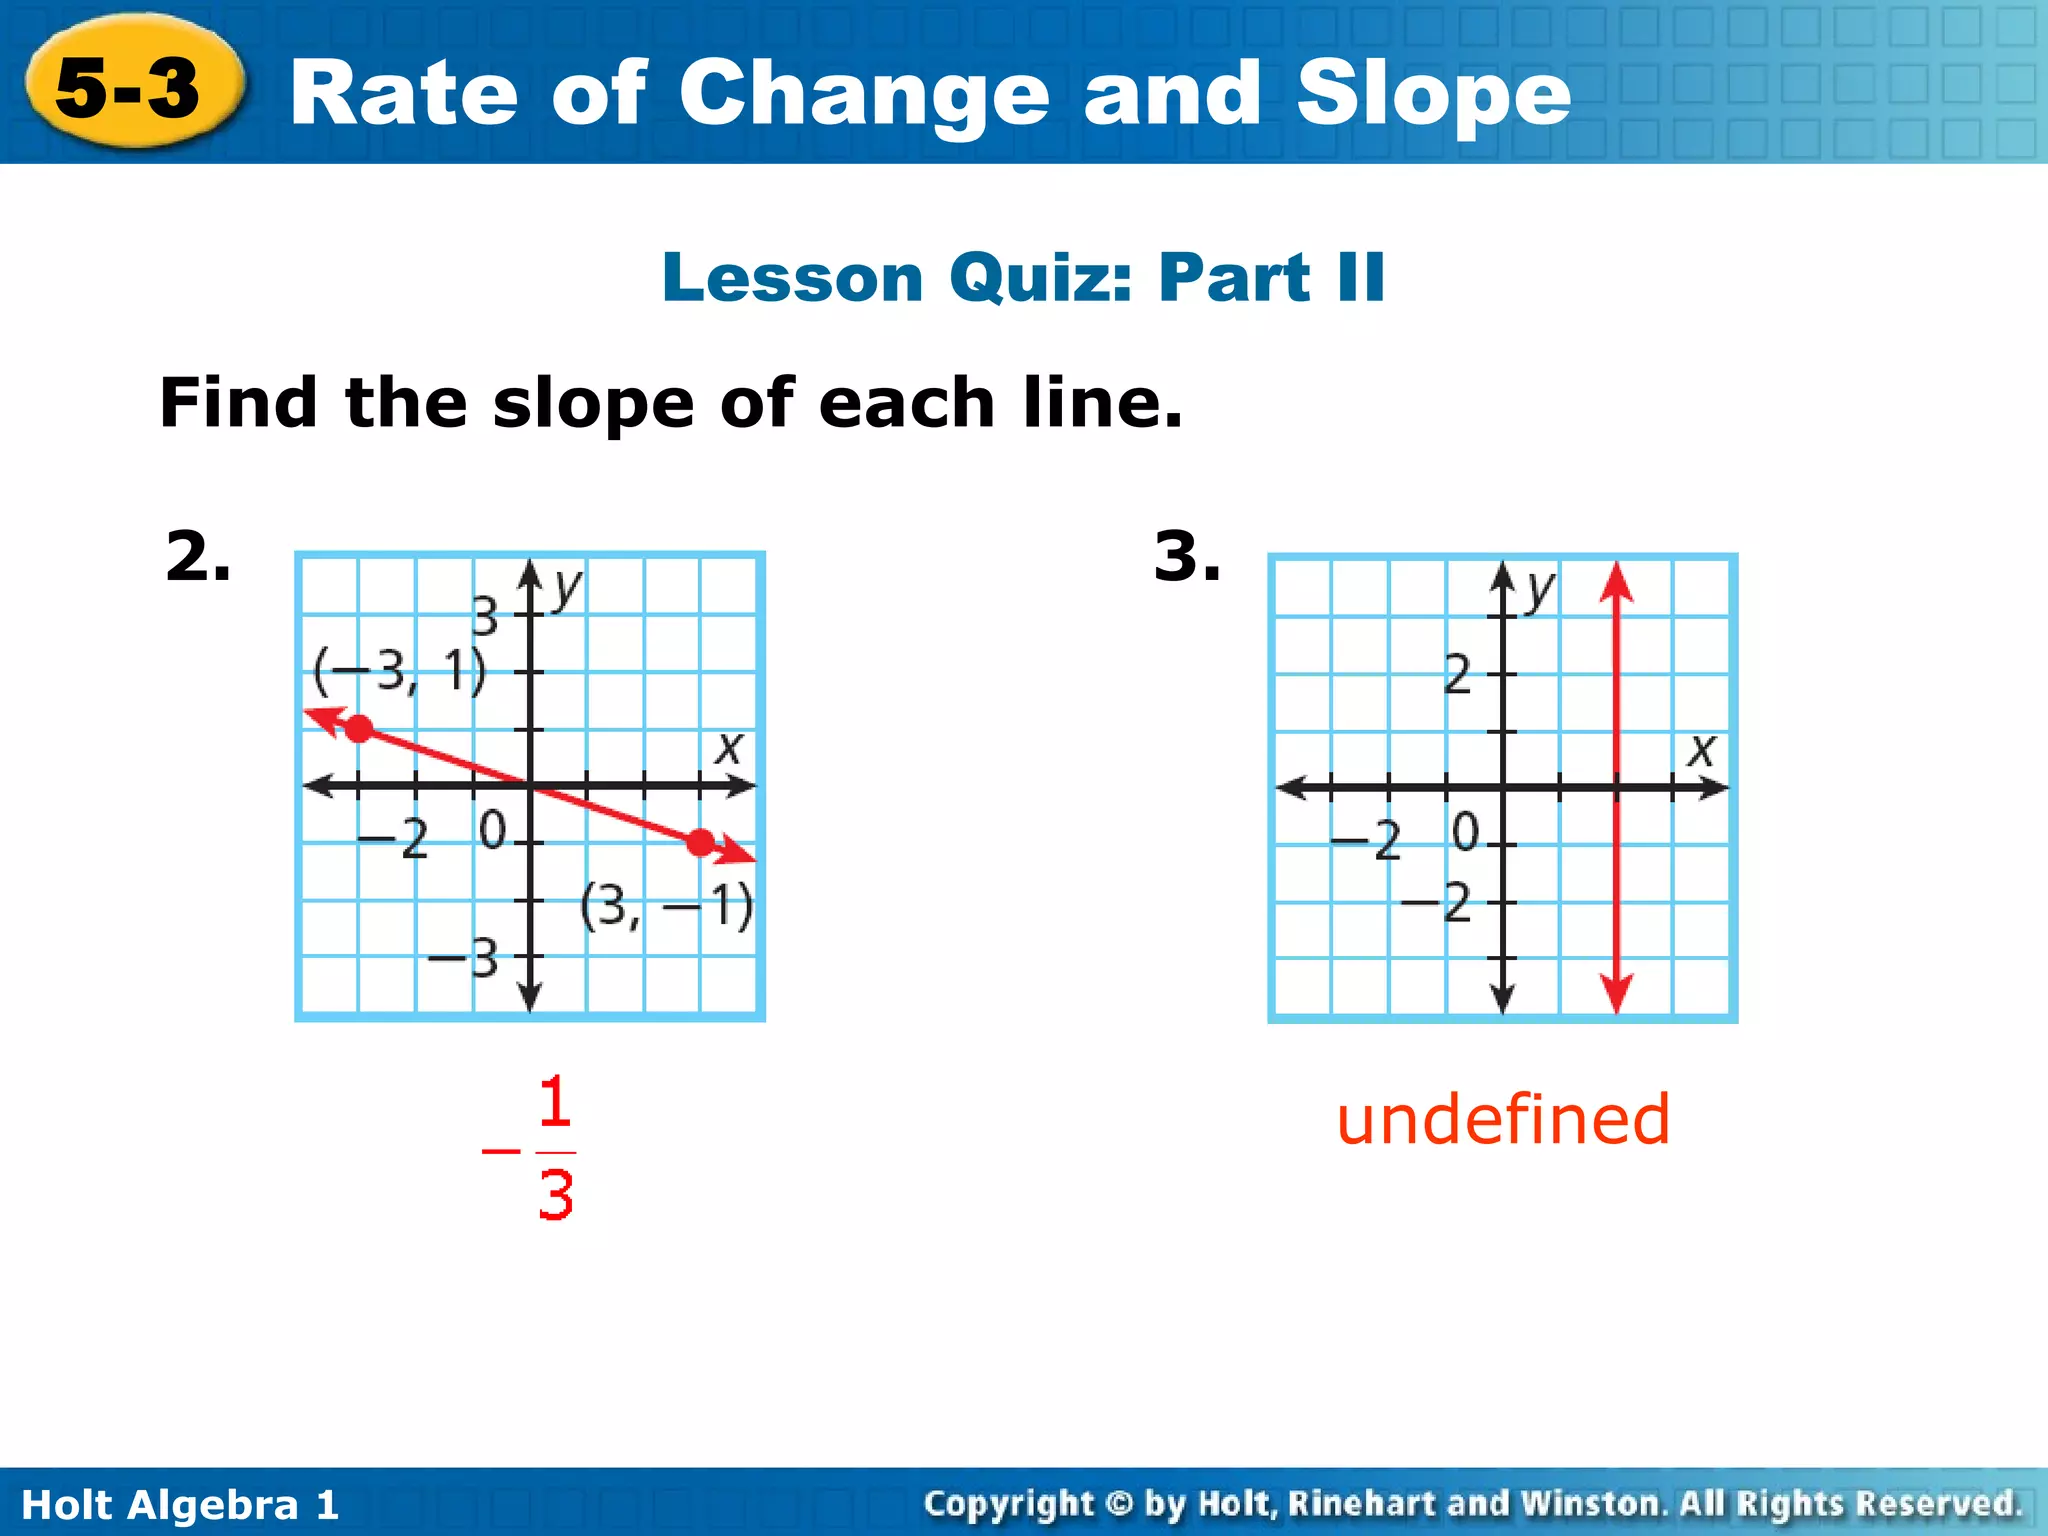
Example 4: FindingSlopes of Horizontal and Vertical Lines Find the slope of each line. You cannot divide by 0 The slope is undefined. The slope is 0. A. B.
19.
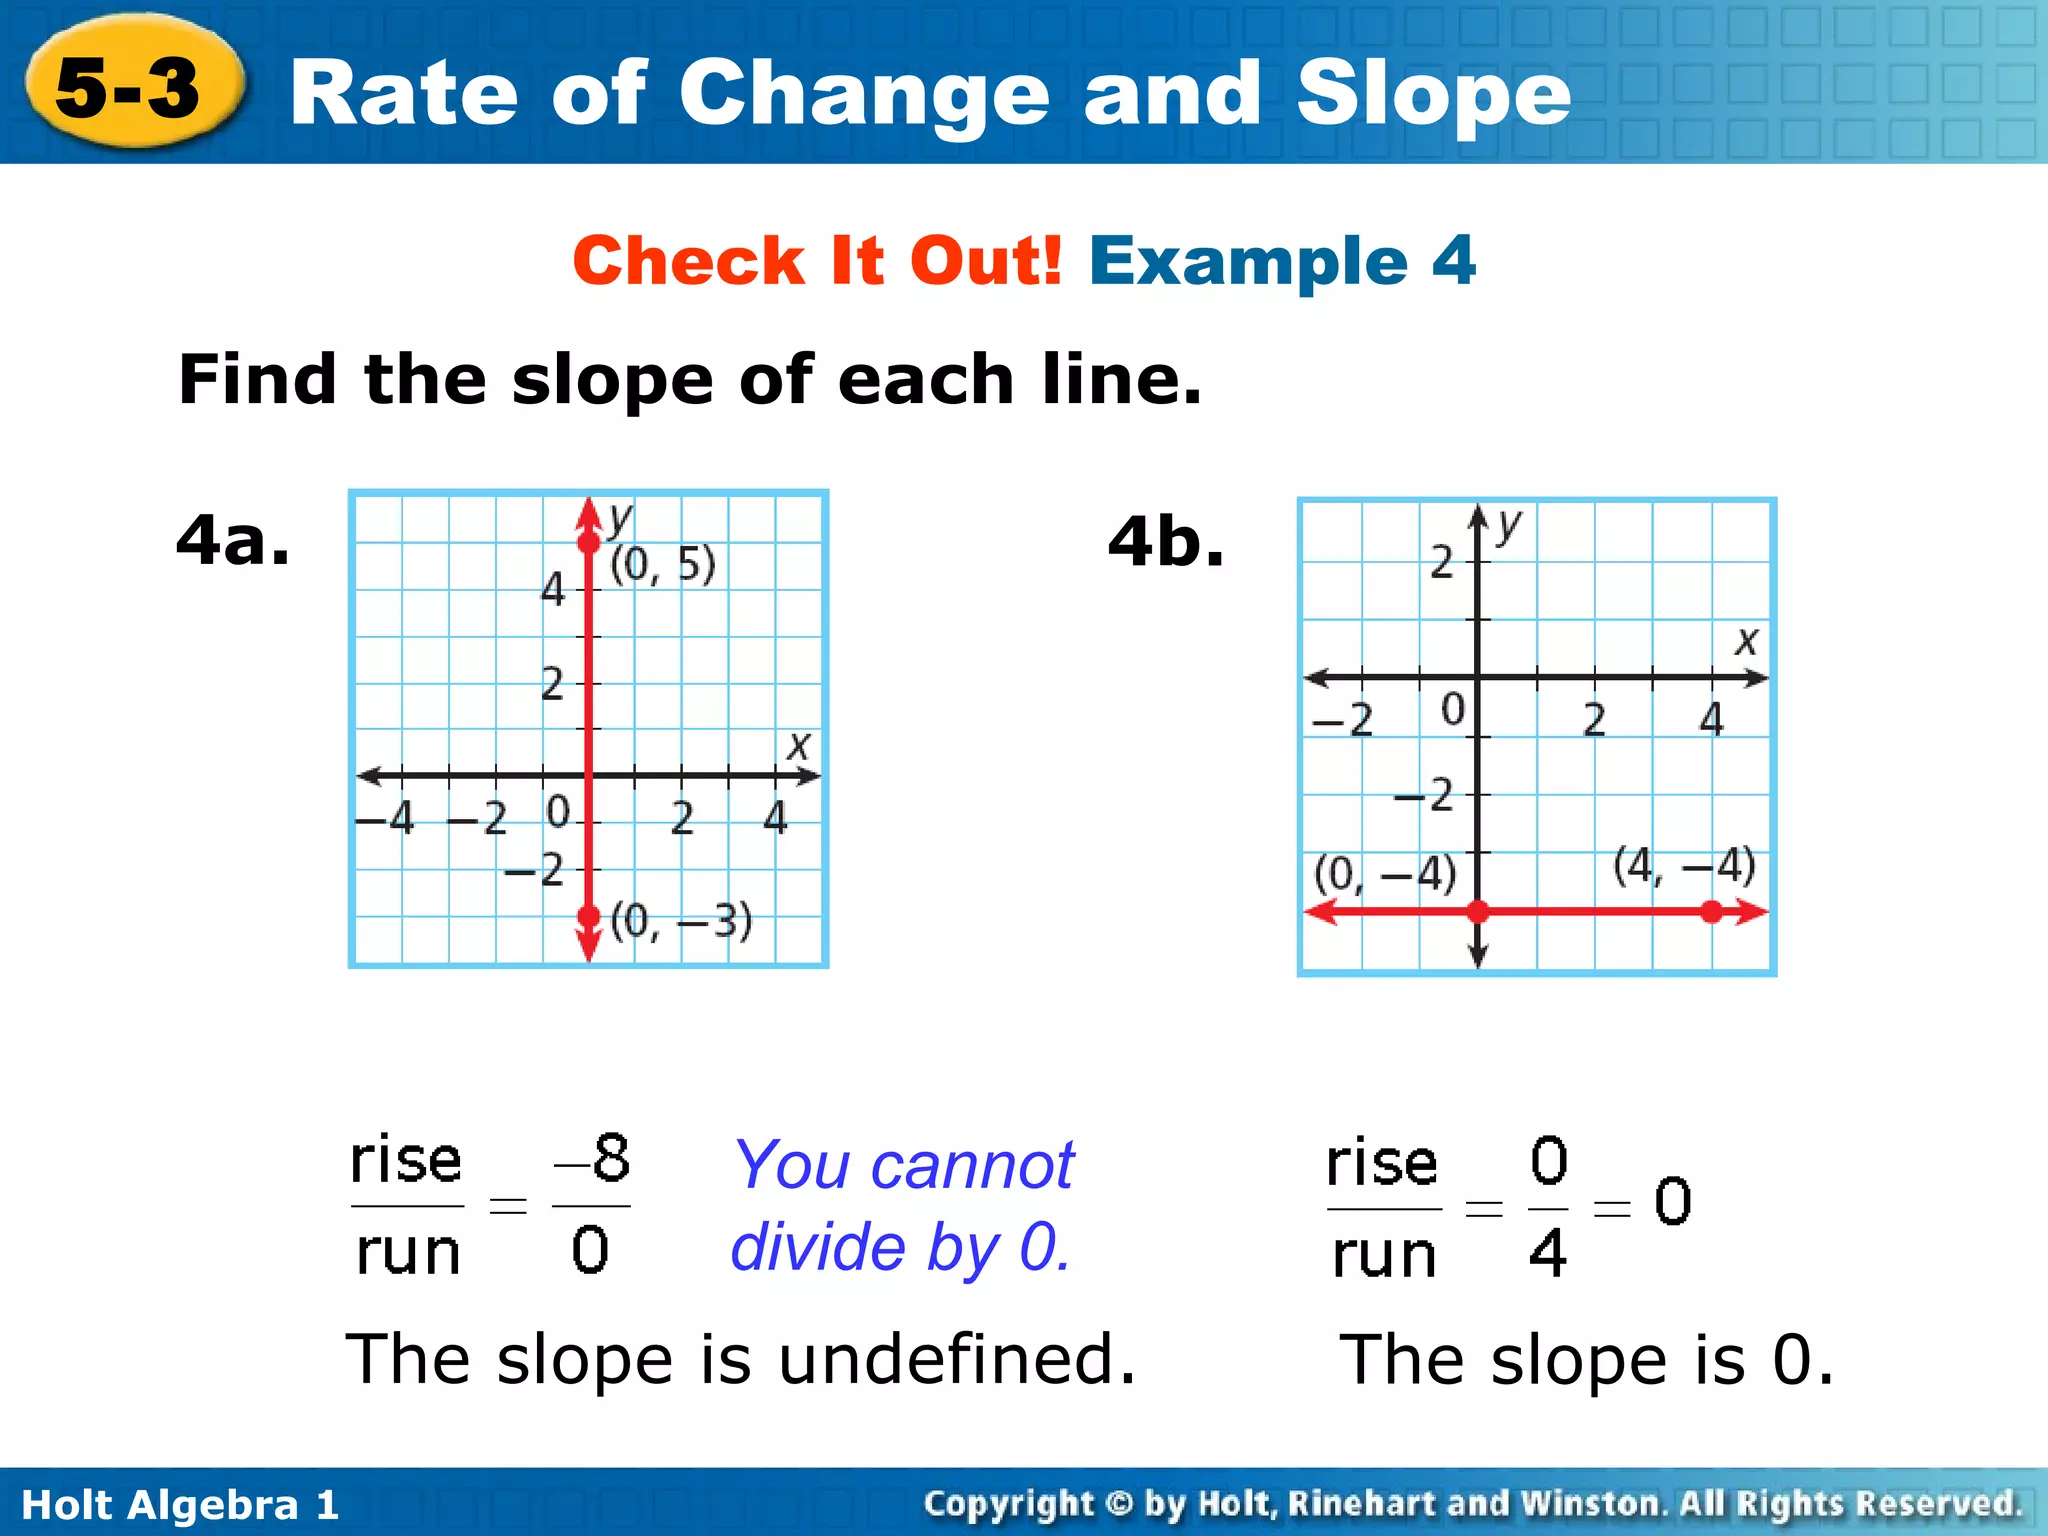
Check It Out! Example 4 Find the slope of each line. 4a. 4b. You cannot divide by 0. The slope is undefined. The slope is 0.
20.
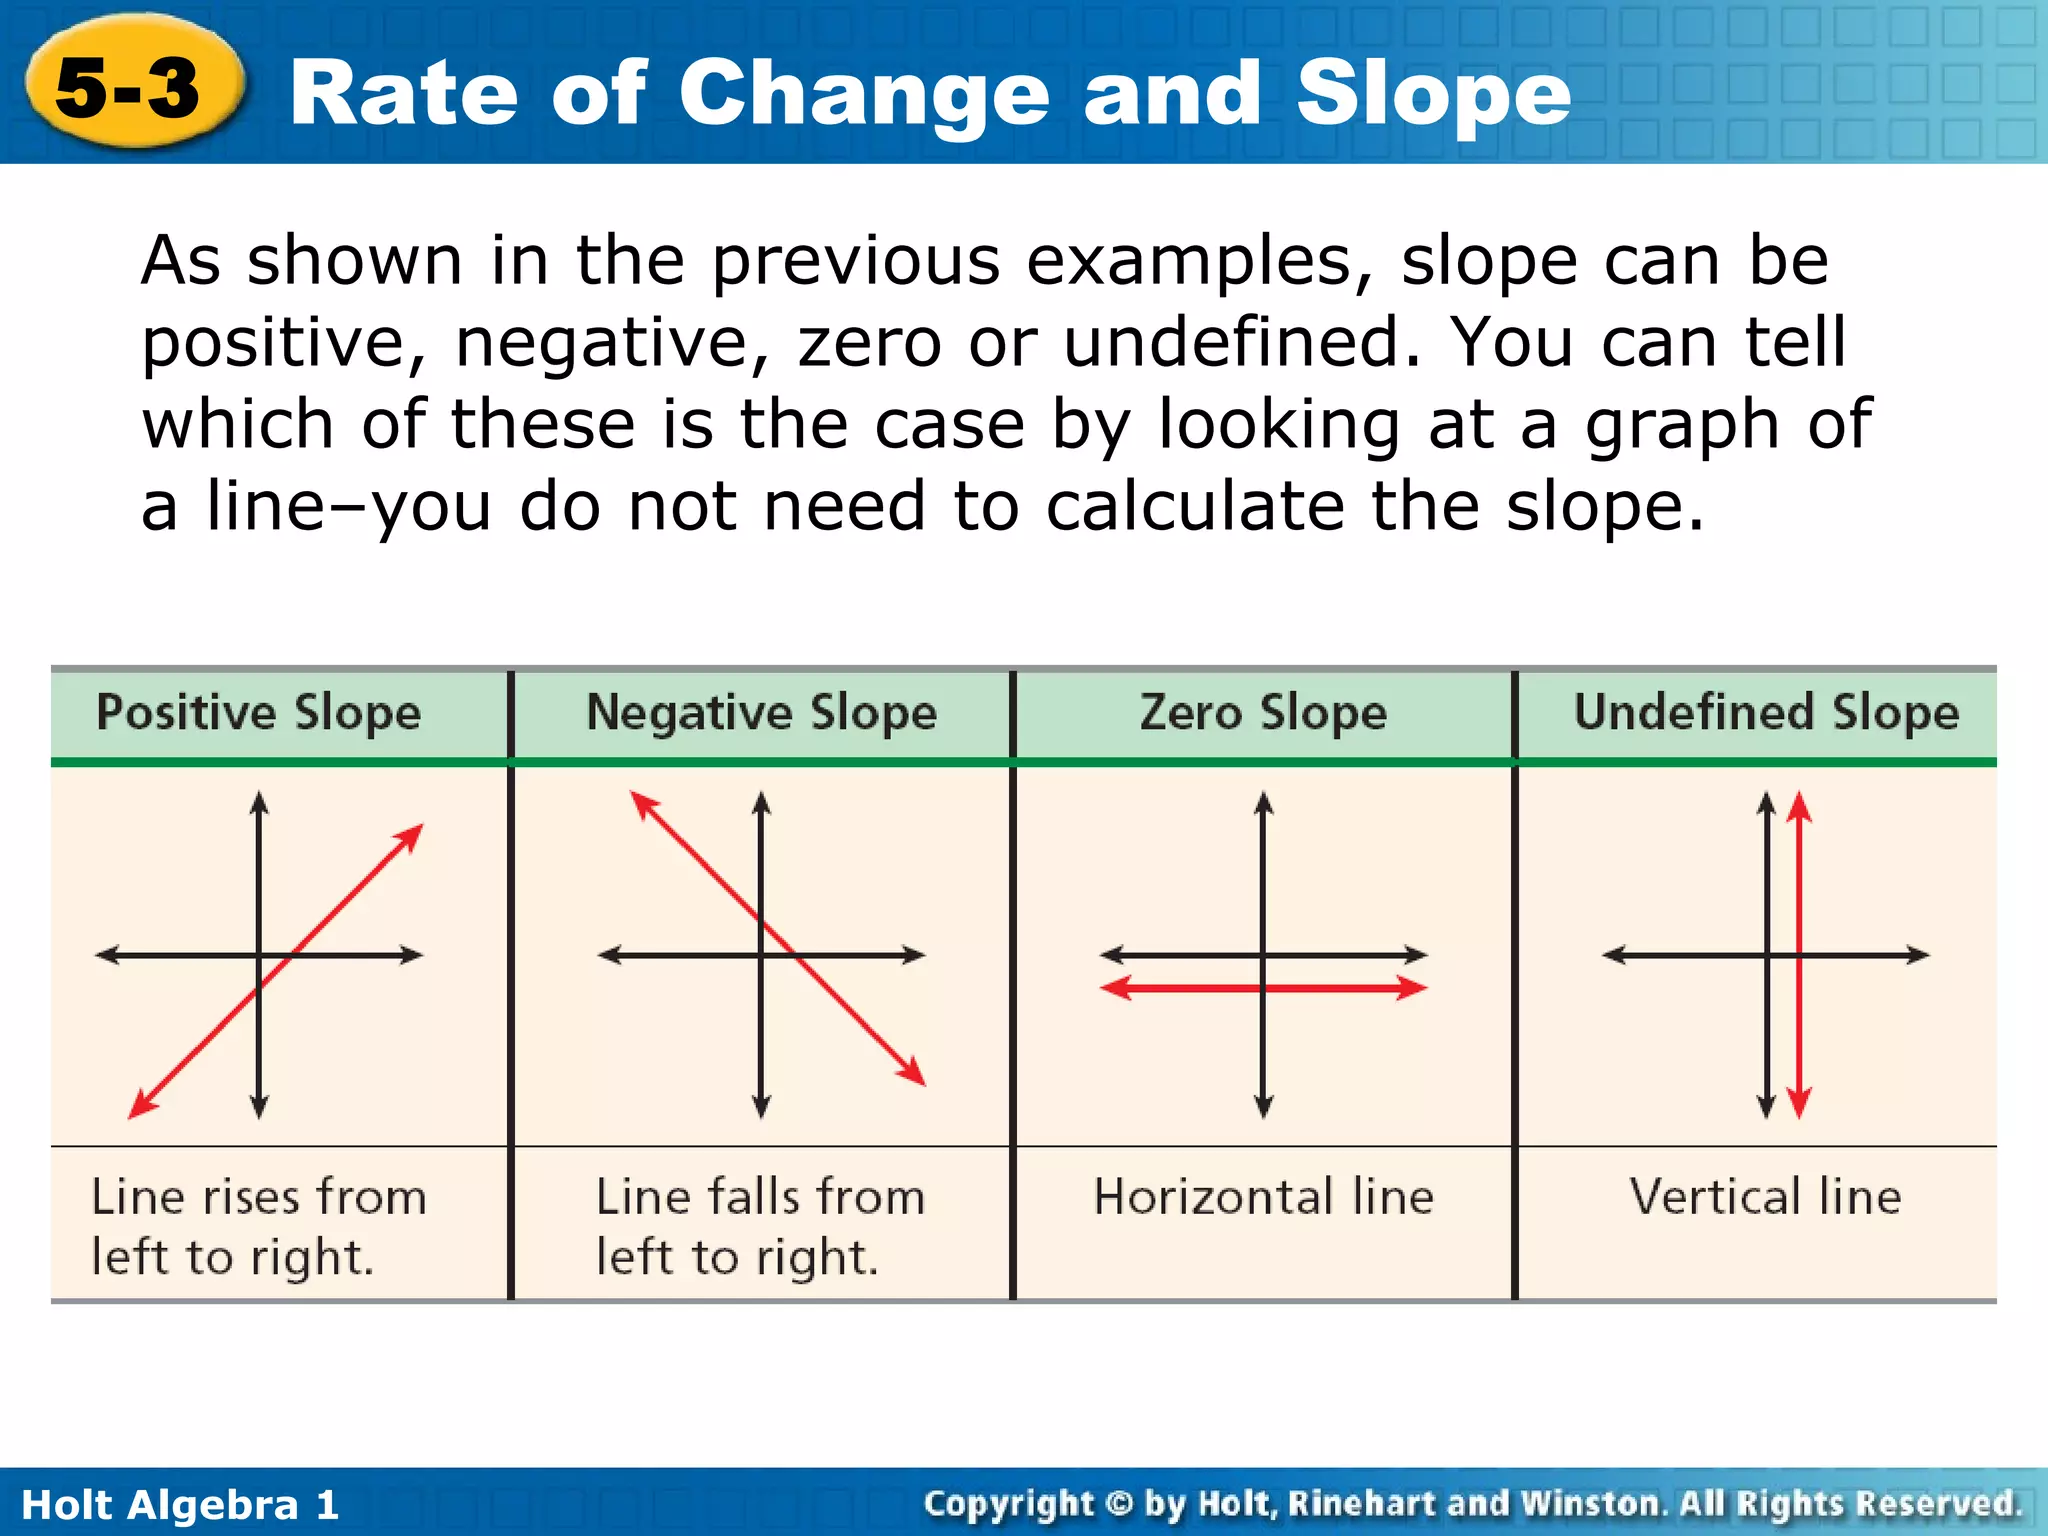
As shown inthe previous examples, slope can be positive, negative, zero or undefined. You can tell which of these is the case by looking at a graph of a line–you do not need to calculate the slope.
21.
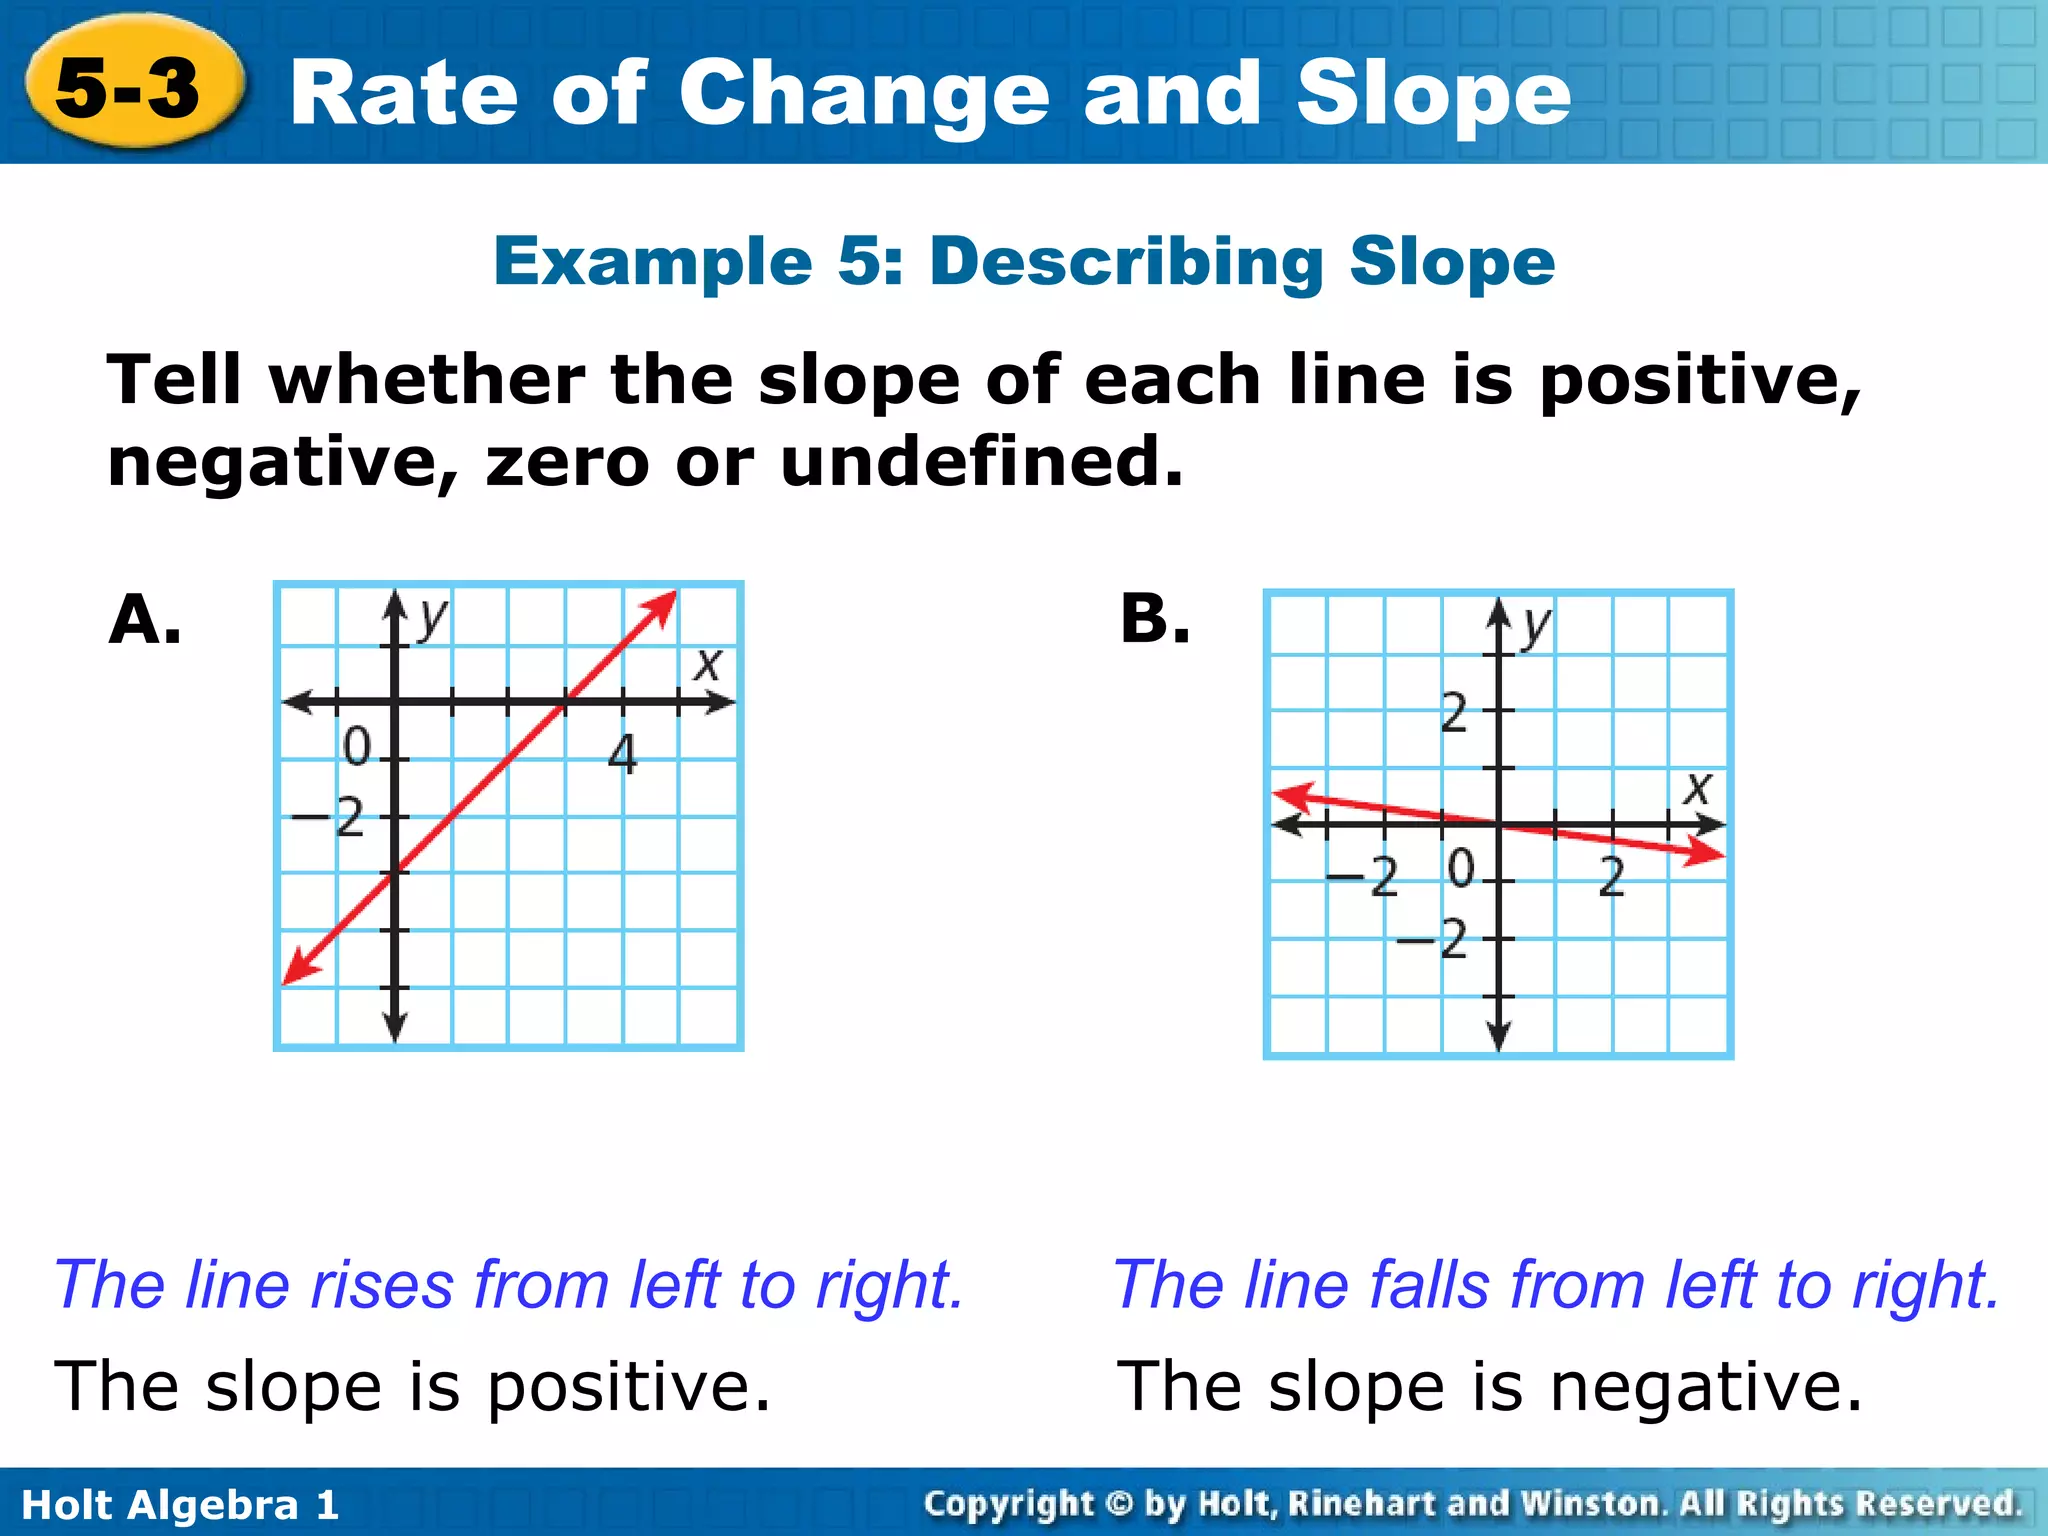
Example 5: DescribingSlope Tell whether the slope of each line is positive, negative, zero or undefined. The line rises from left to right. The line falls from left to right. The slope is positive. The slope is negative. A. B.
22.
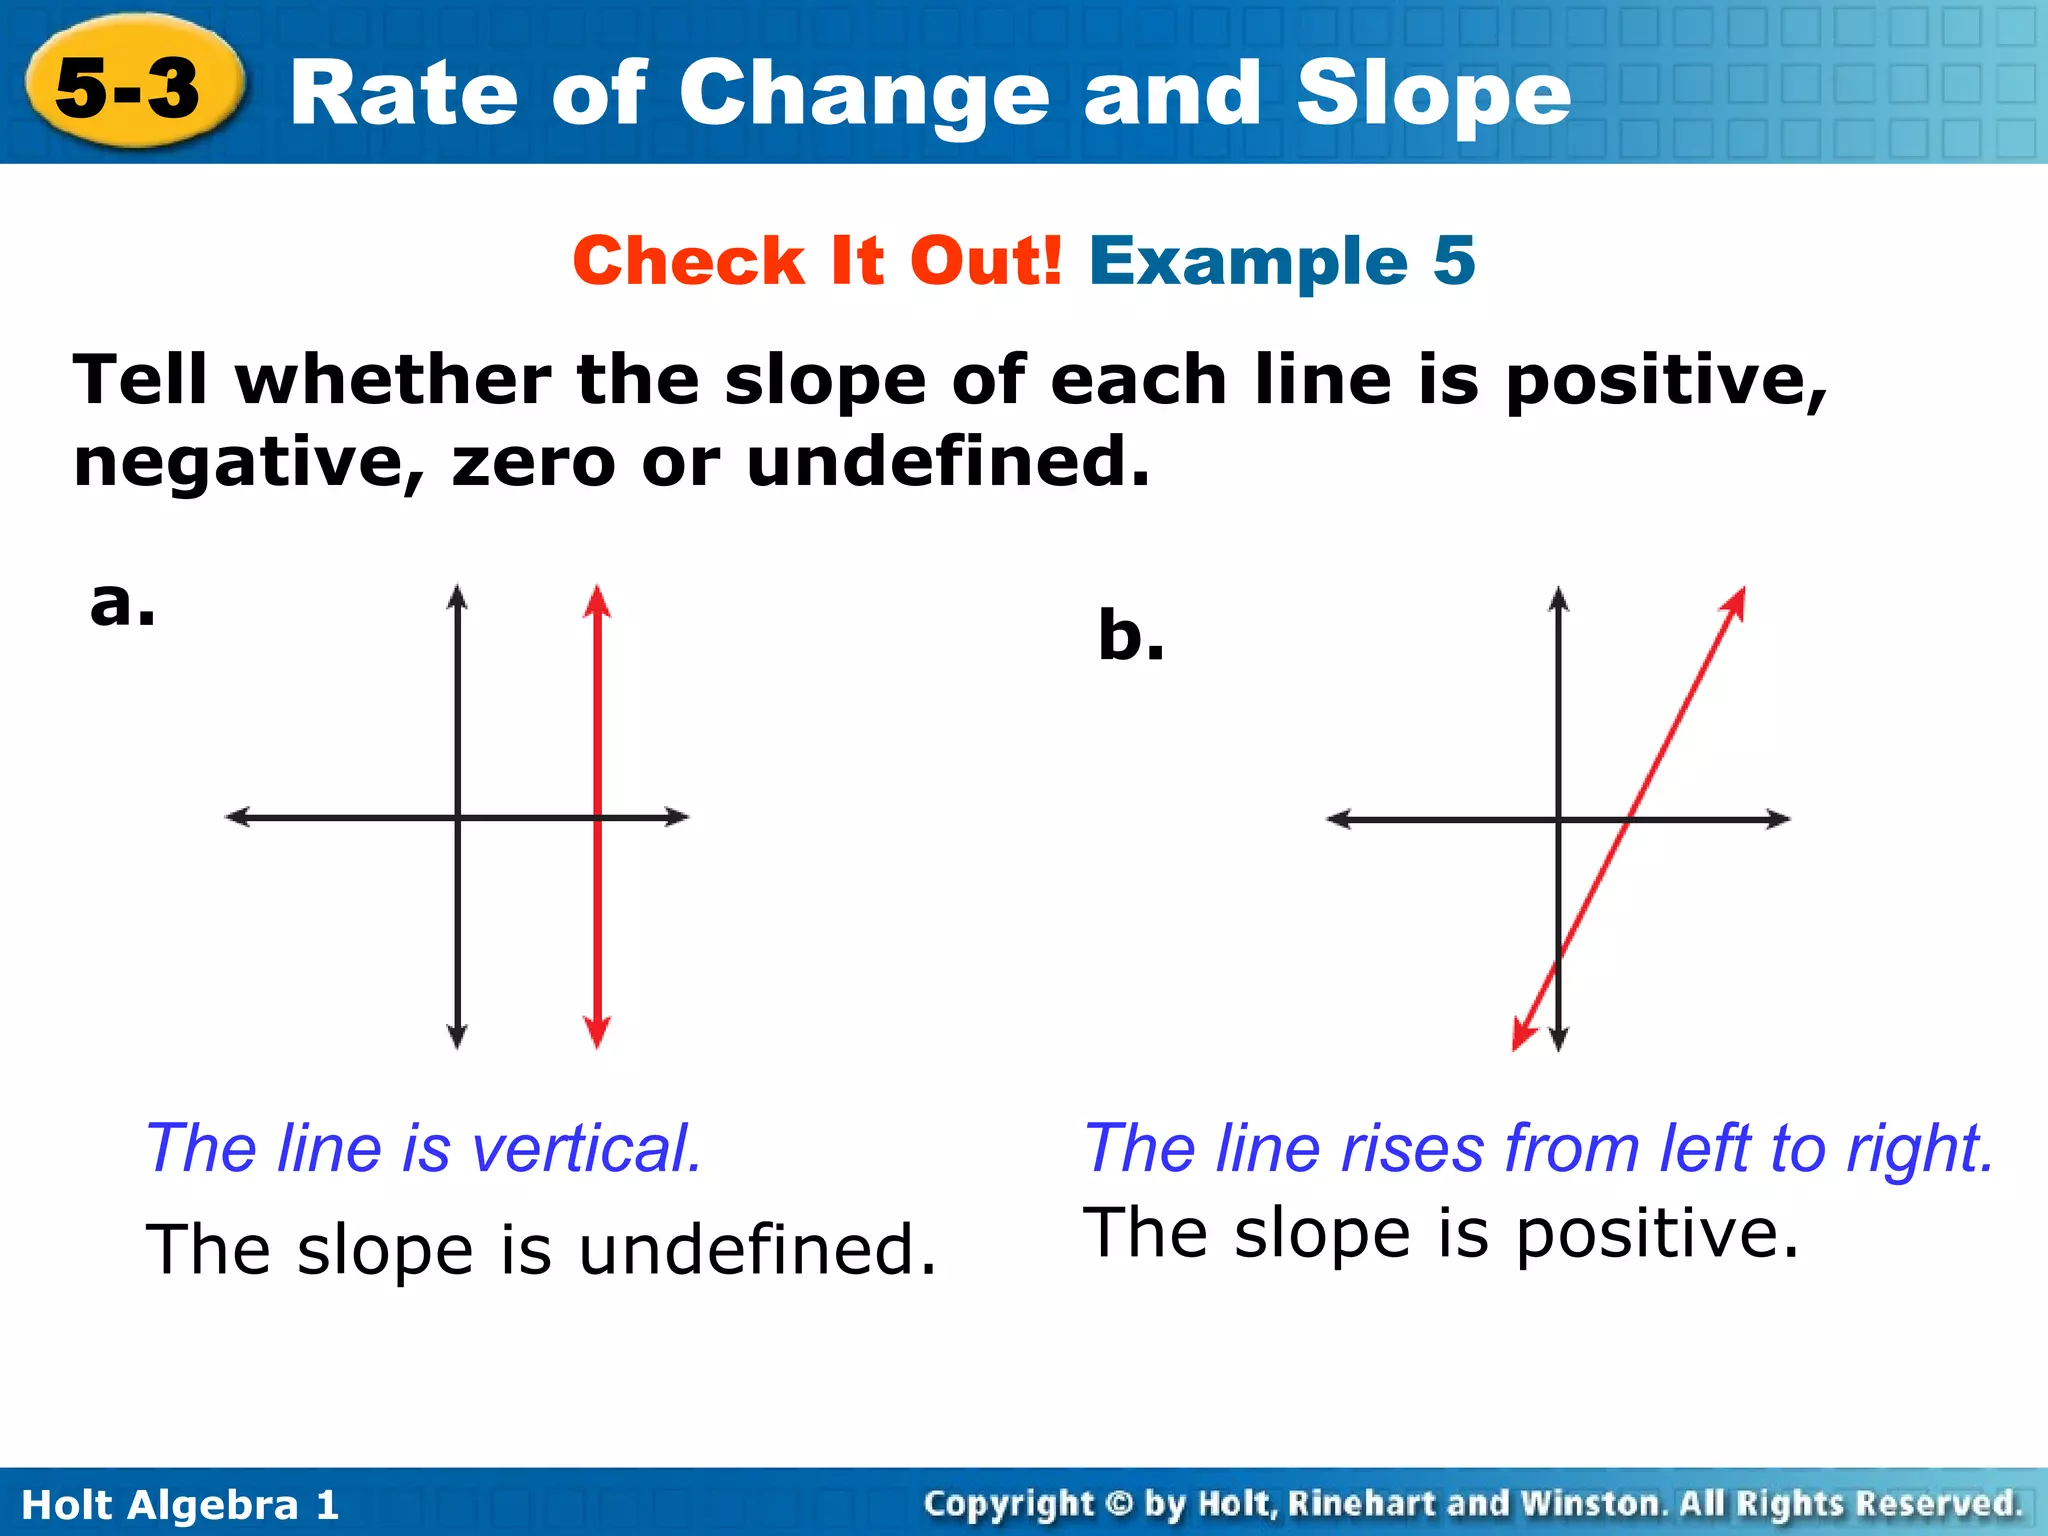
Check It Out! Example 5 Tell whether the slope of each line is positive, negative, zero or undefined. a. b. The line rises from left to right. The slope is positive. The line is vertical. The slope is undefined.
23.
24.
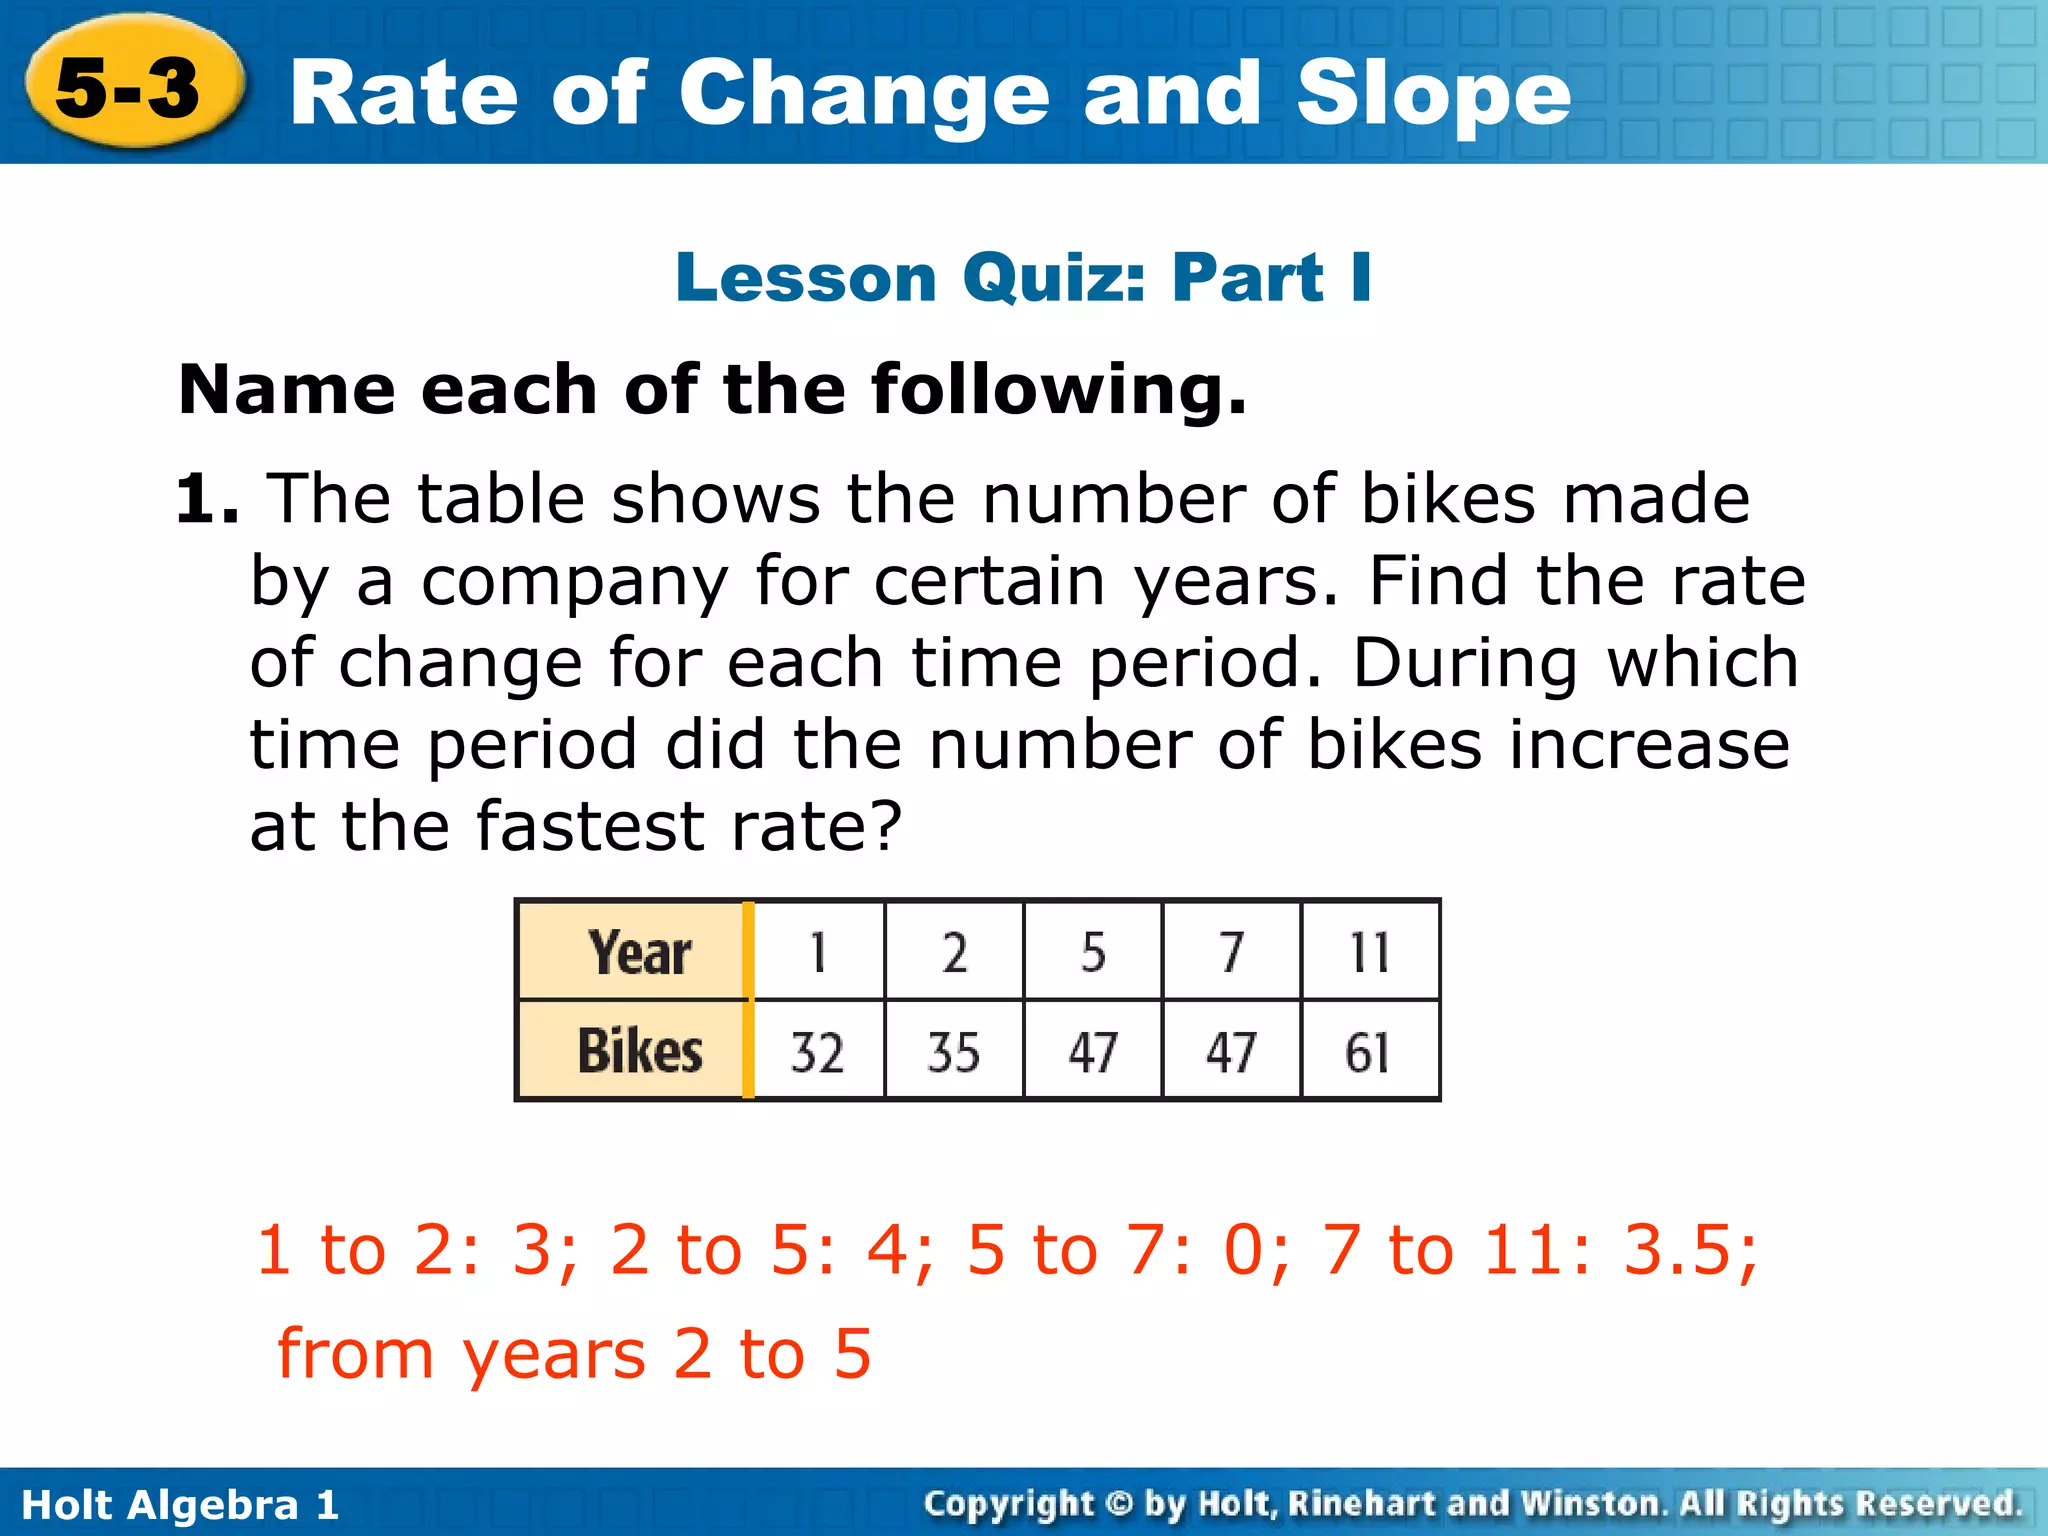
Lesson Quiz: PartI Name each of the following. 1. The table shows the number of bikes made by a company for certain years. Find the rate of change for each time period. During which time period did the number of bikes increase at the fastest rate? 1 to 2: 3; 2 to 5: 4; 5 to 7: 0; 7 to 11: 3.5; from years 2 to 5