Downloaded 3,893 times
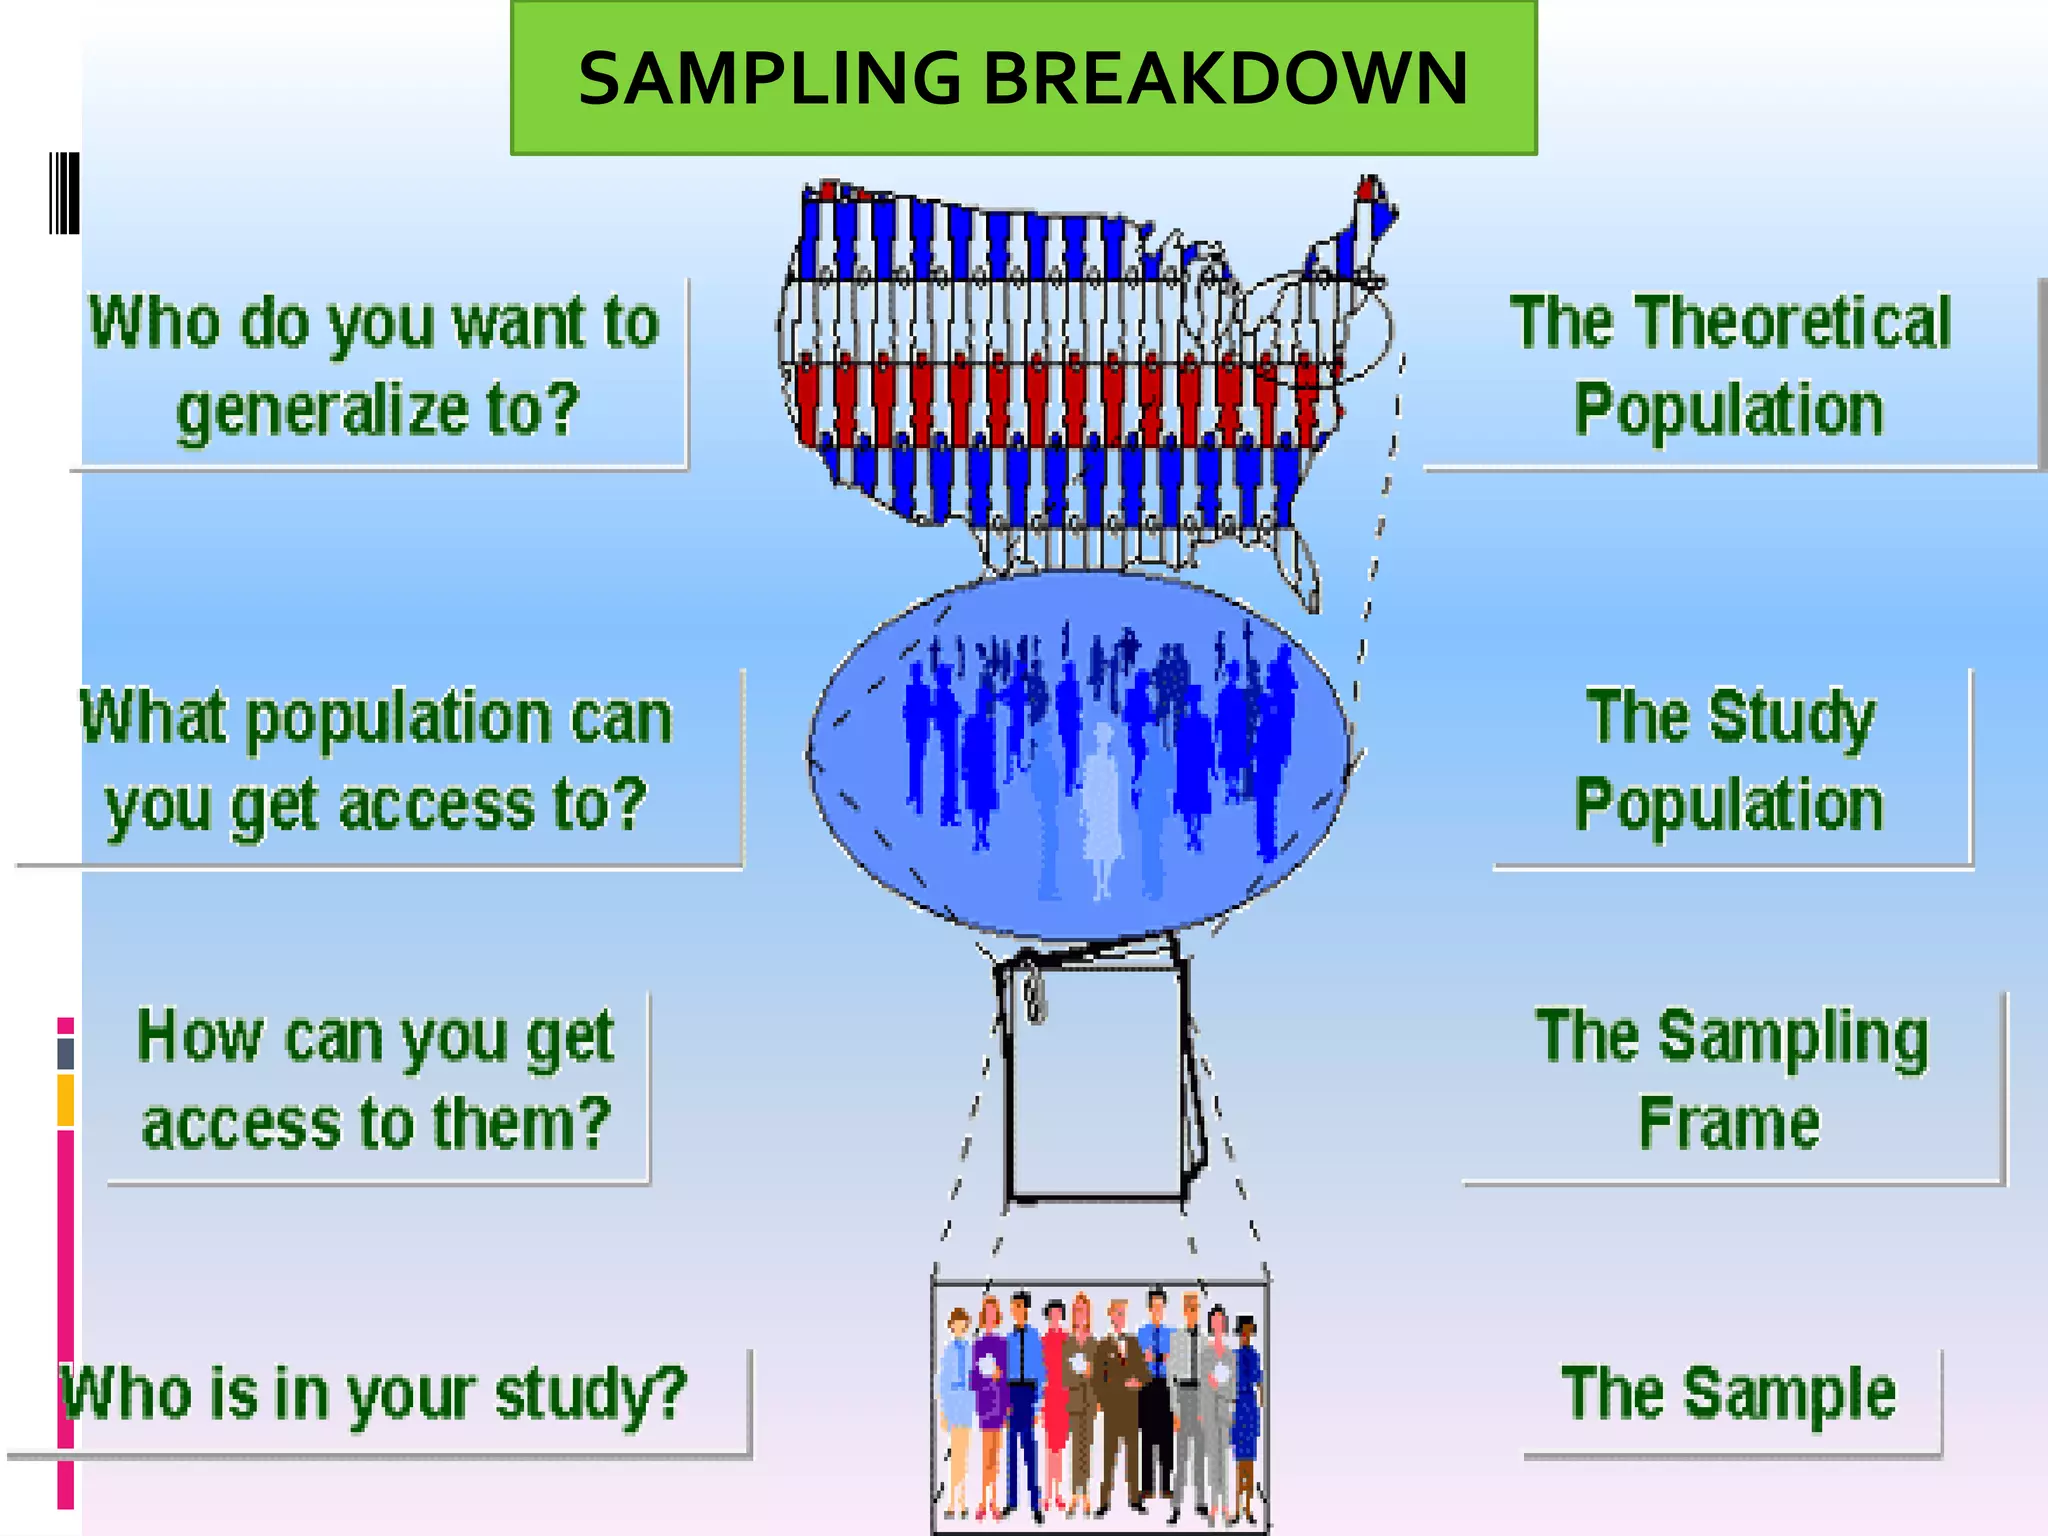
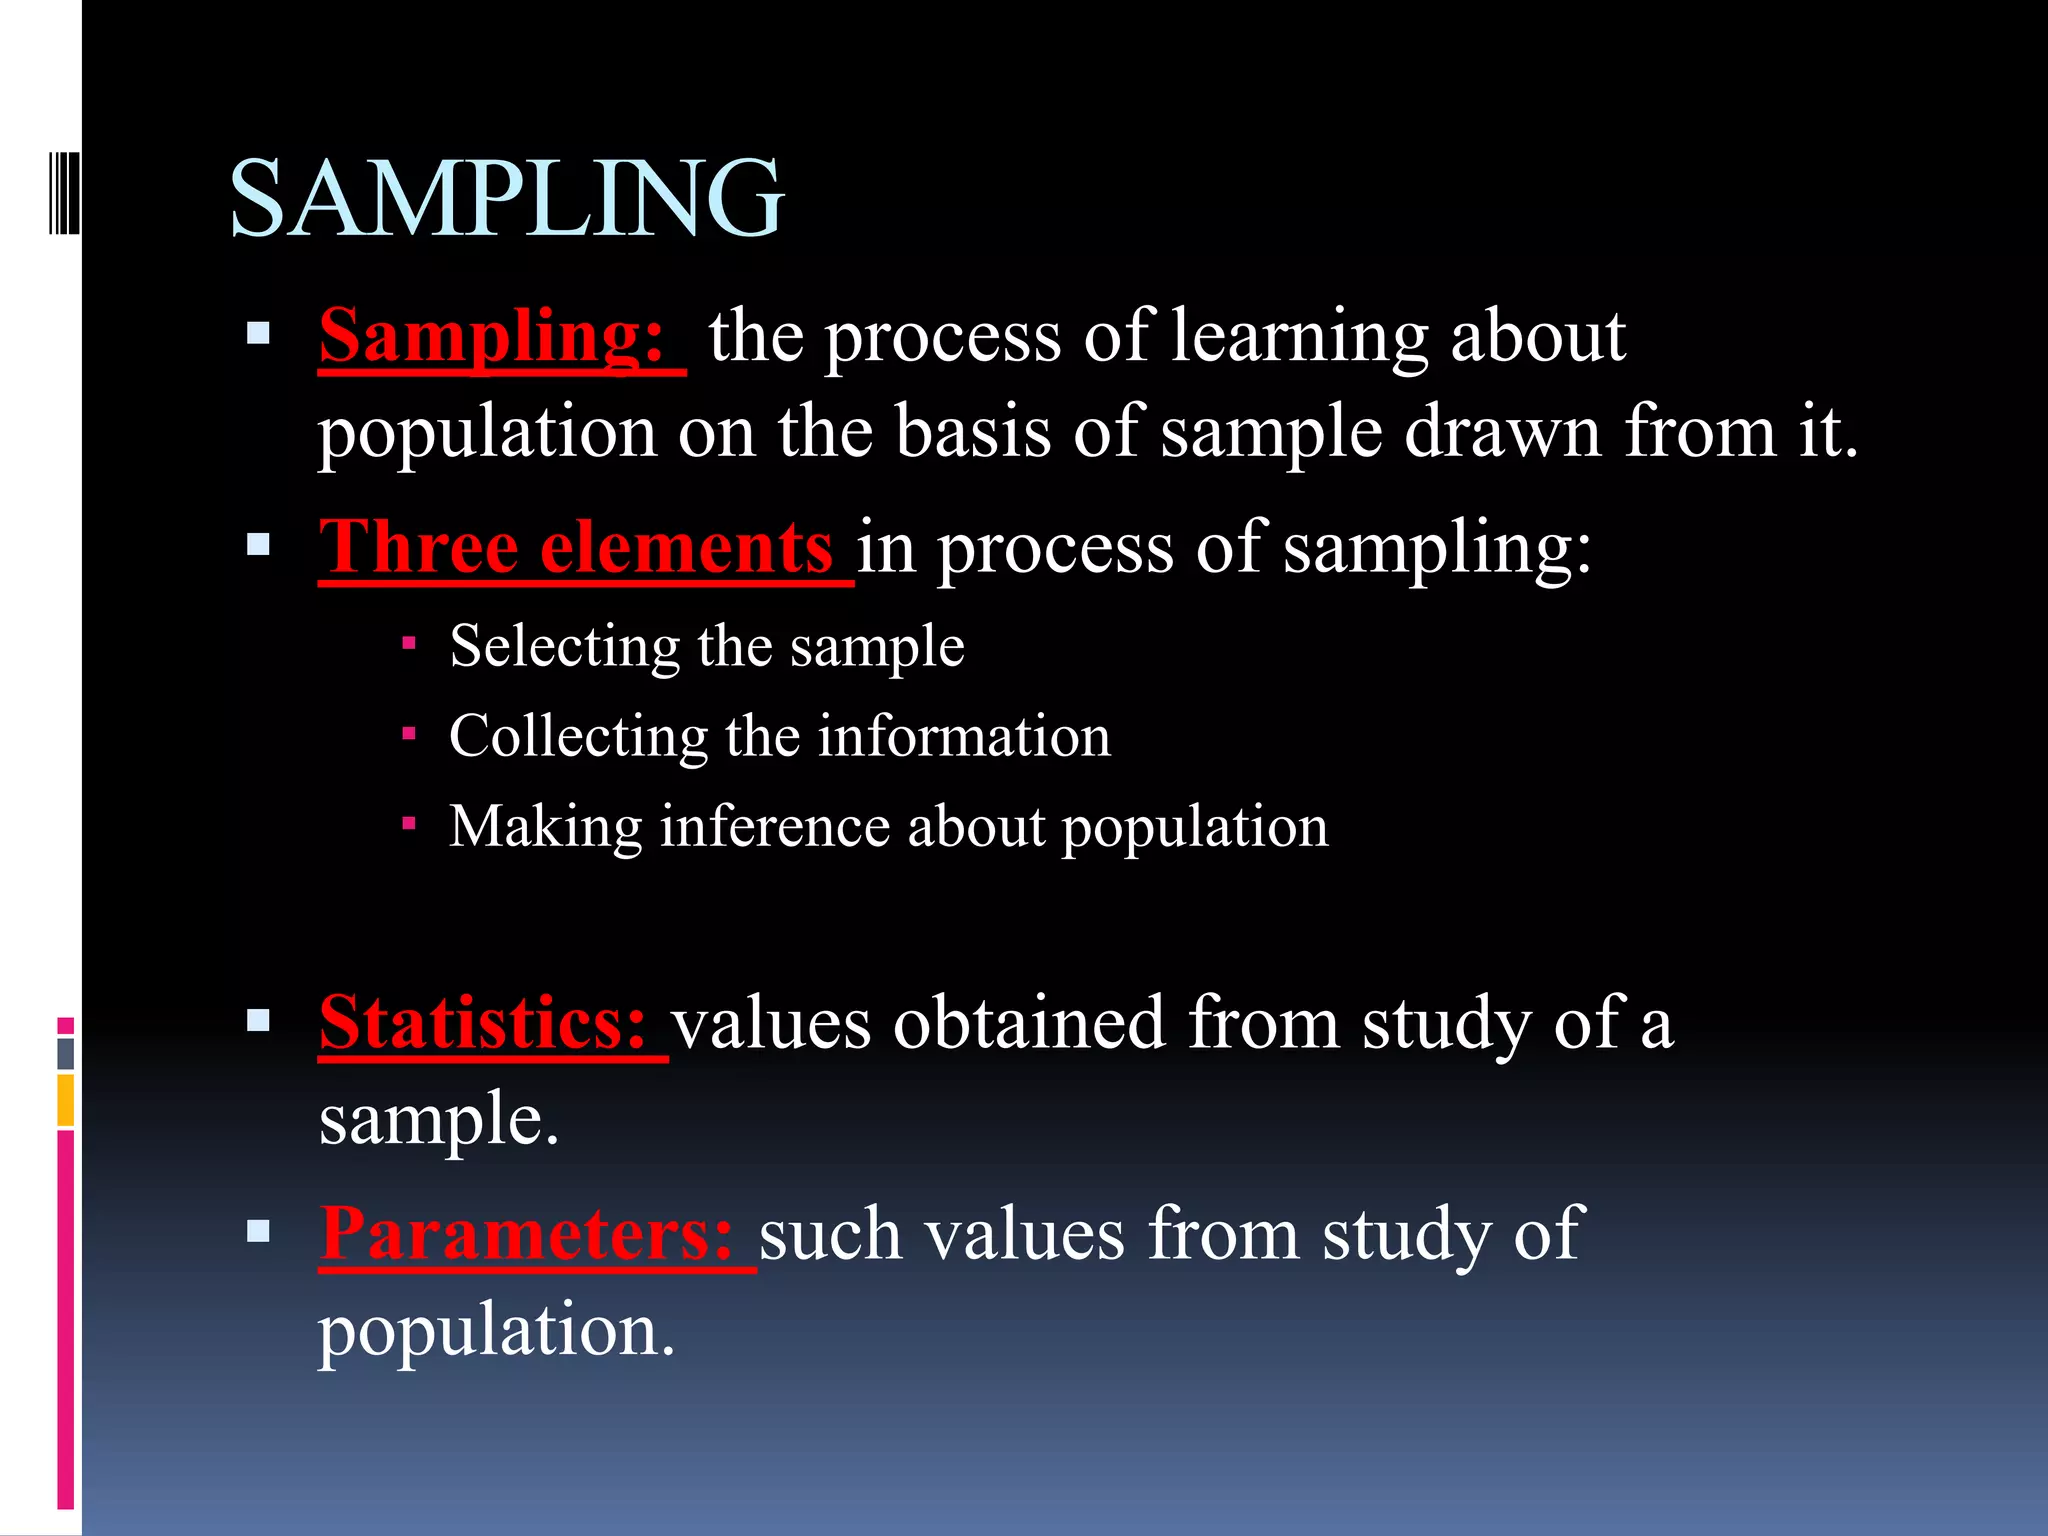
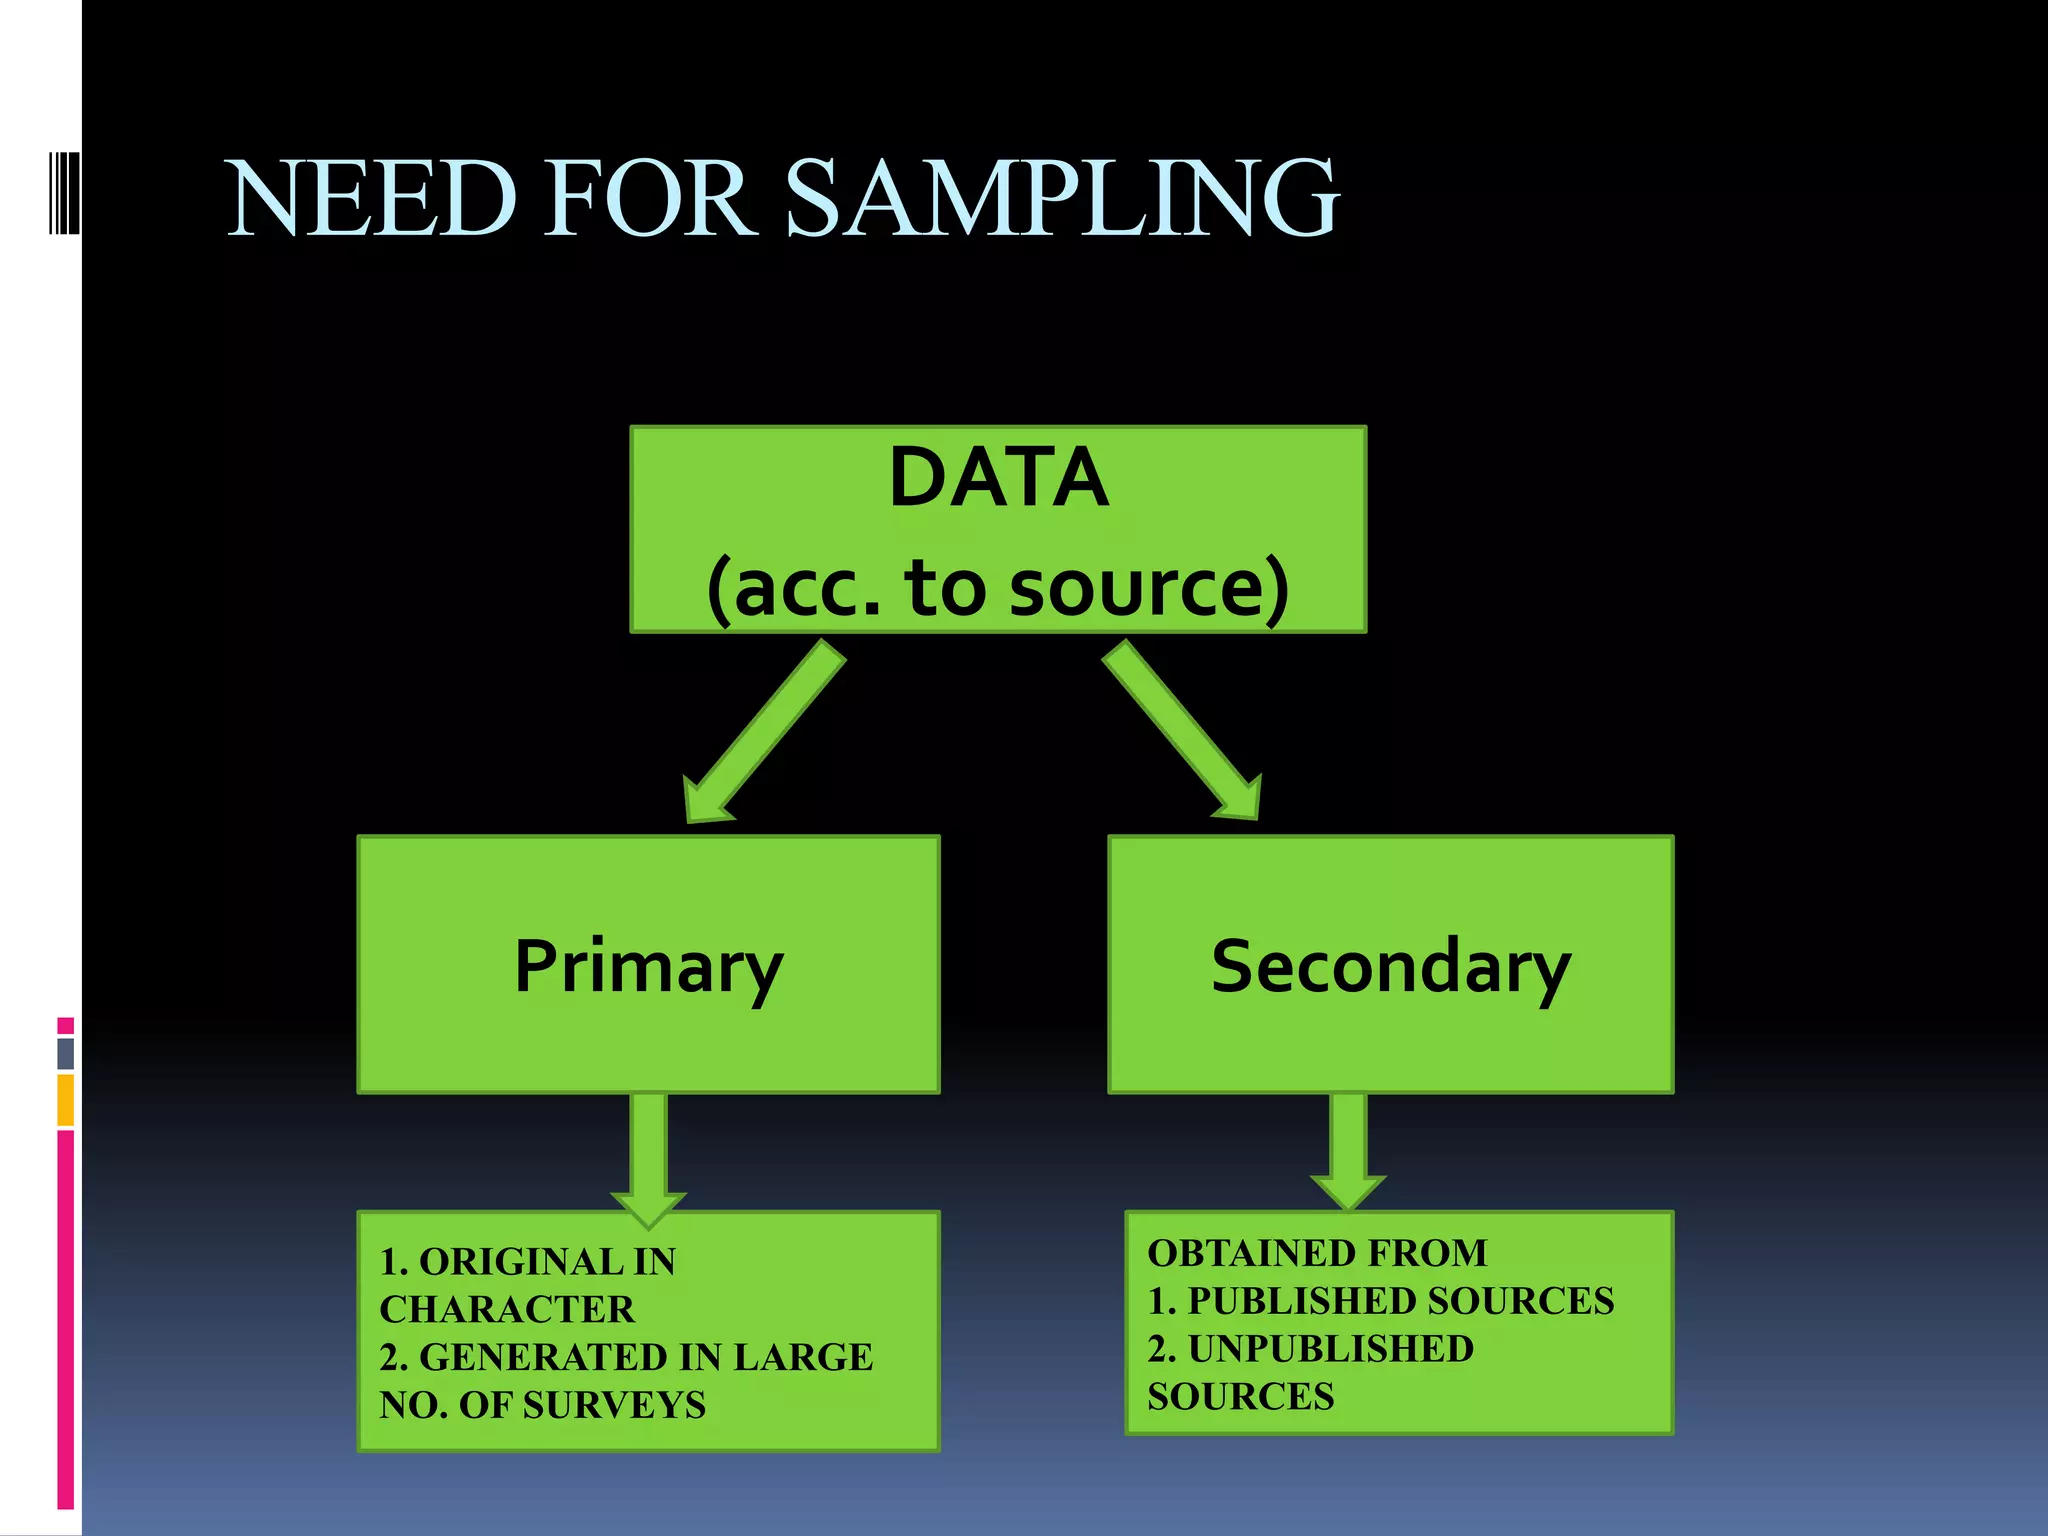
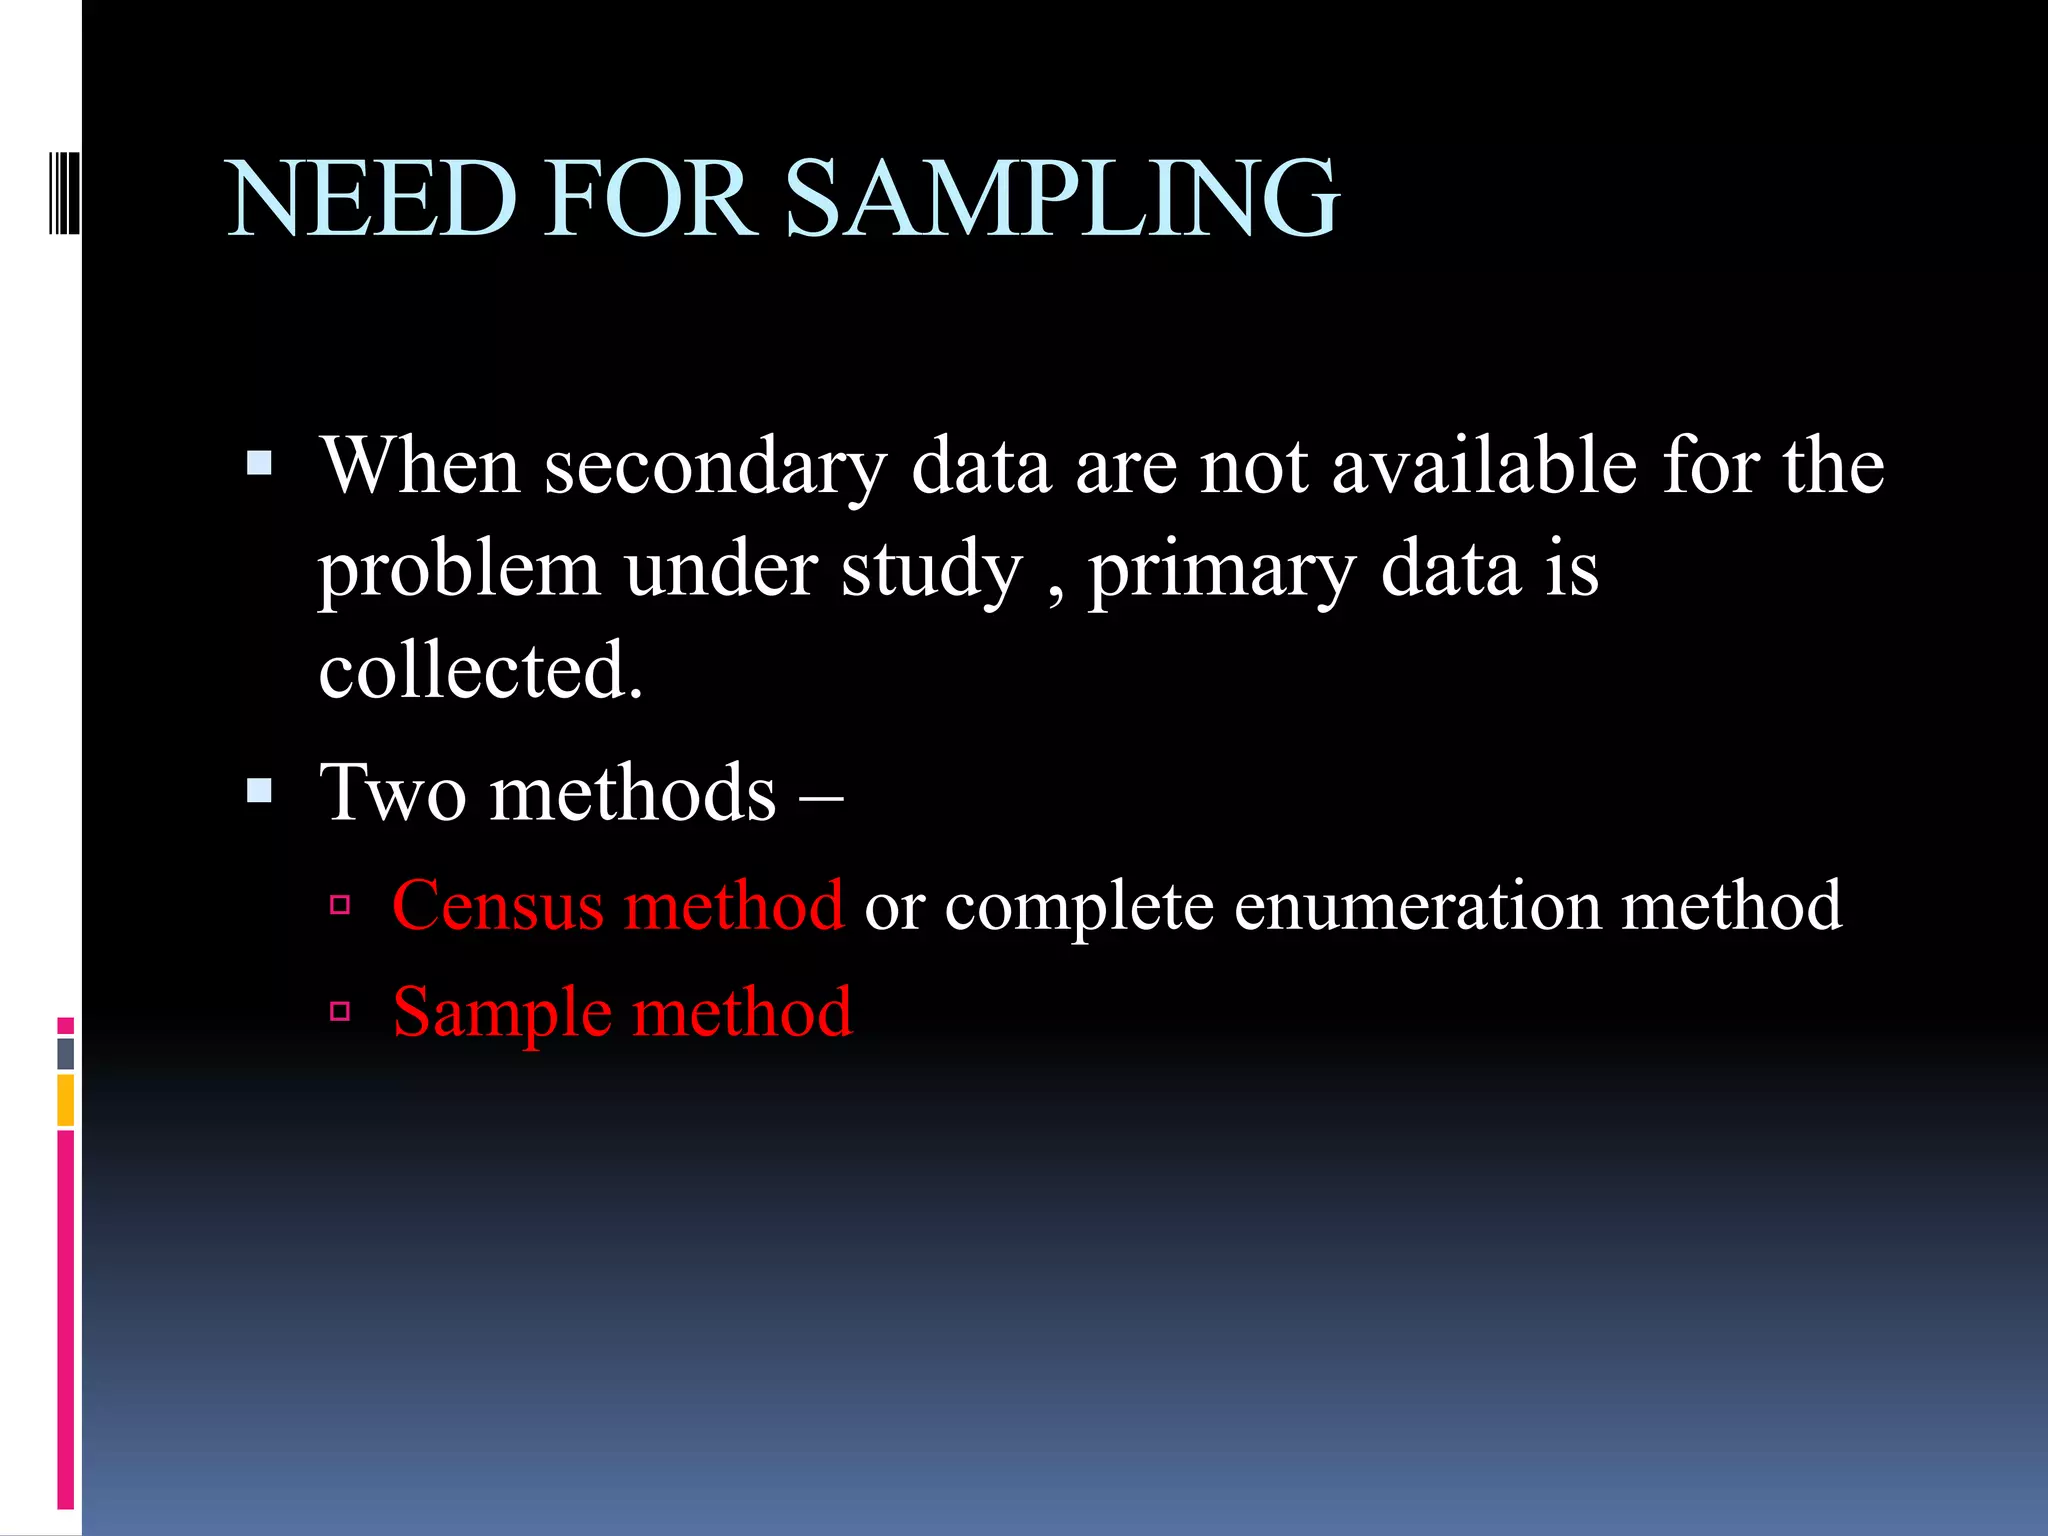

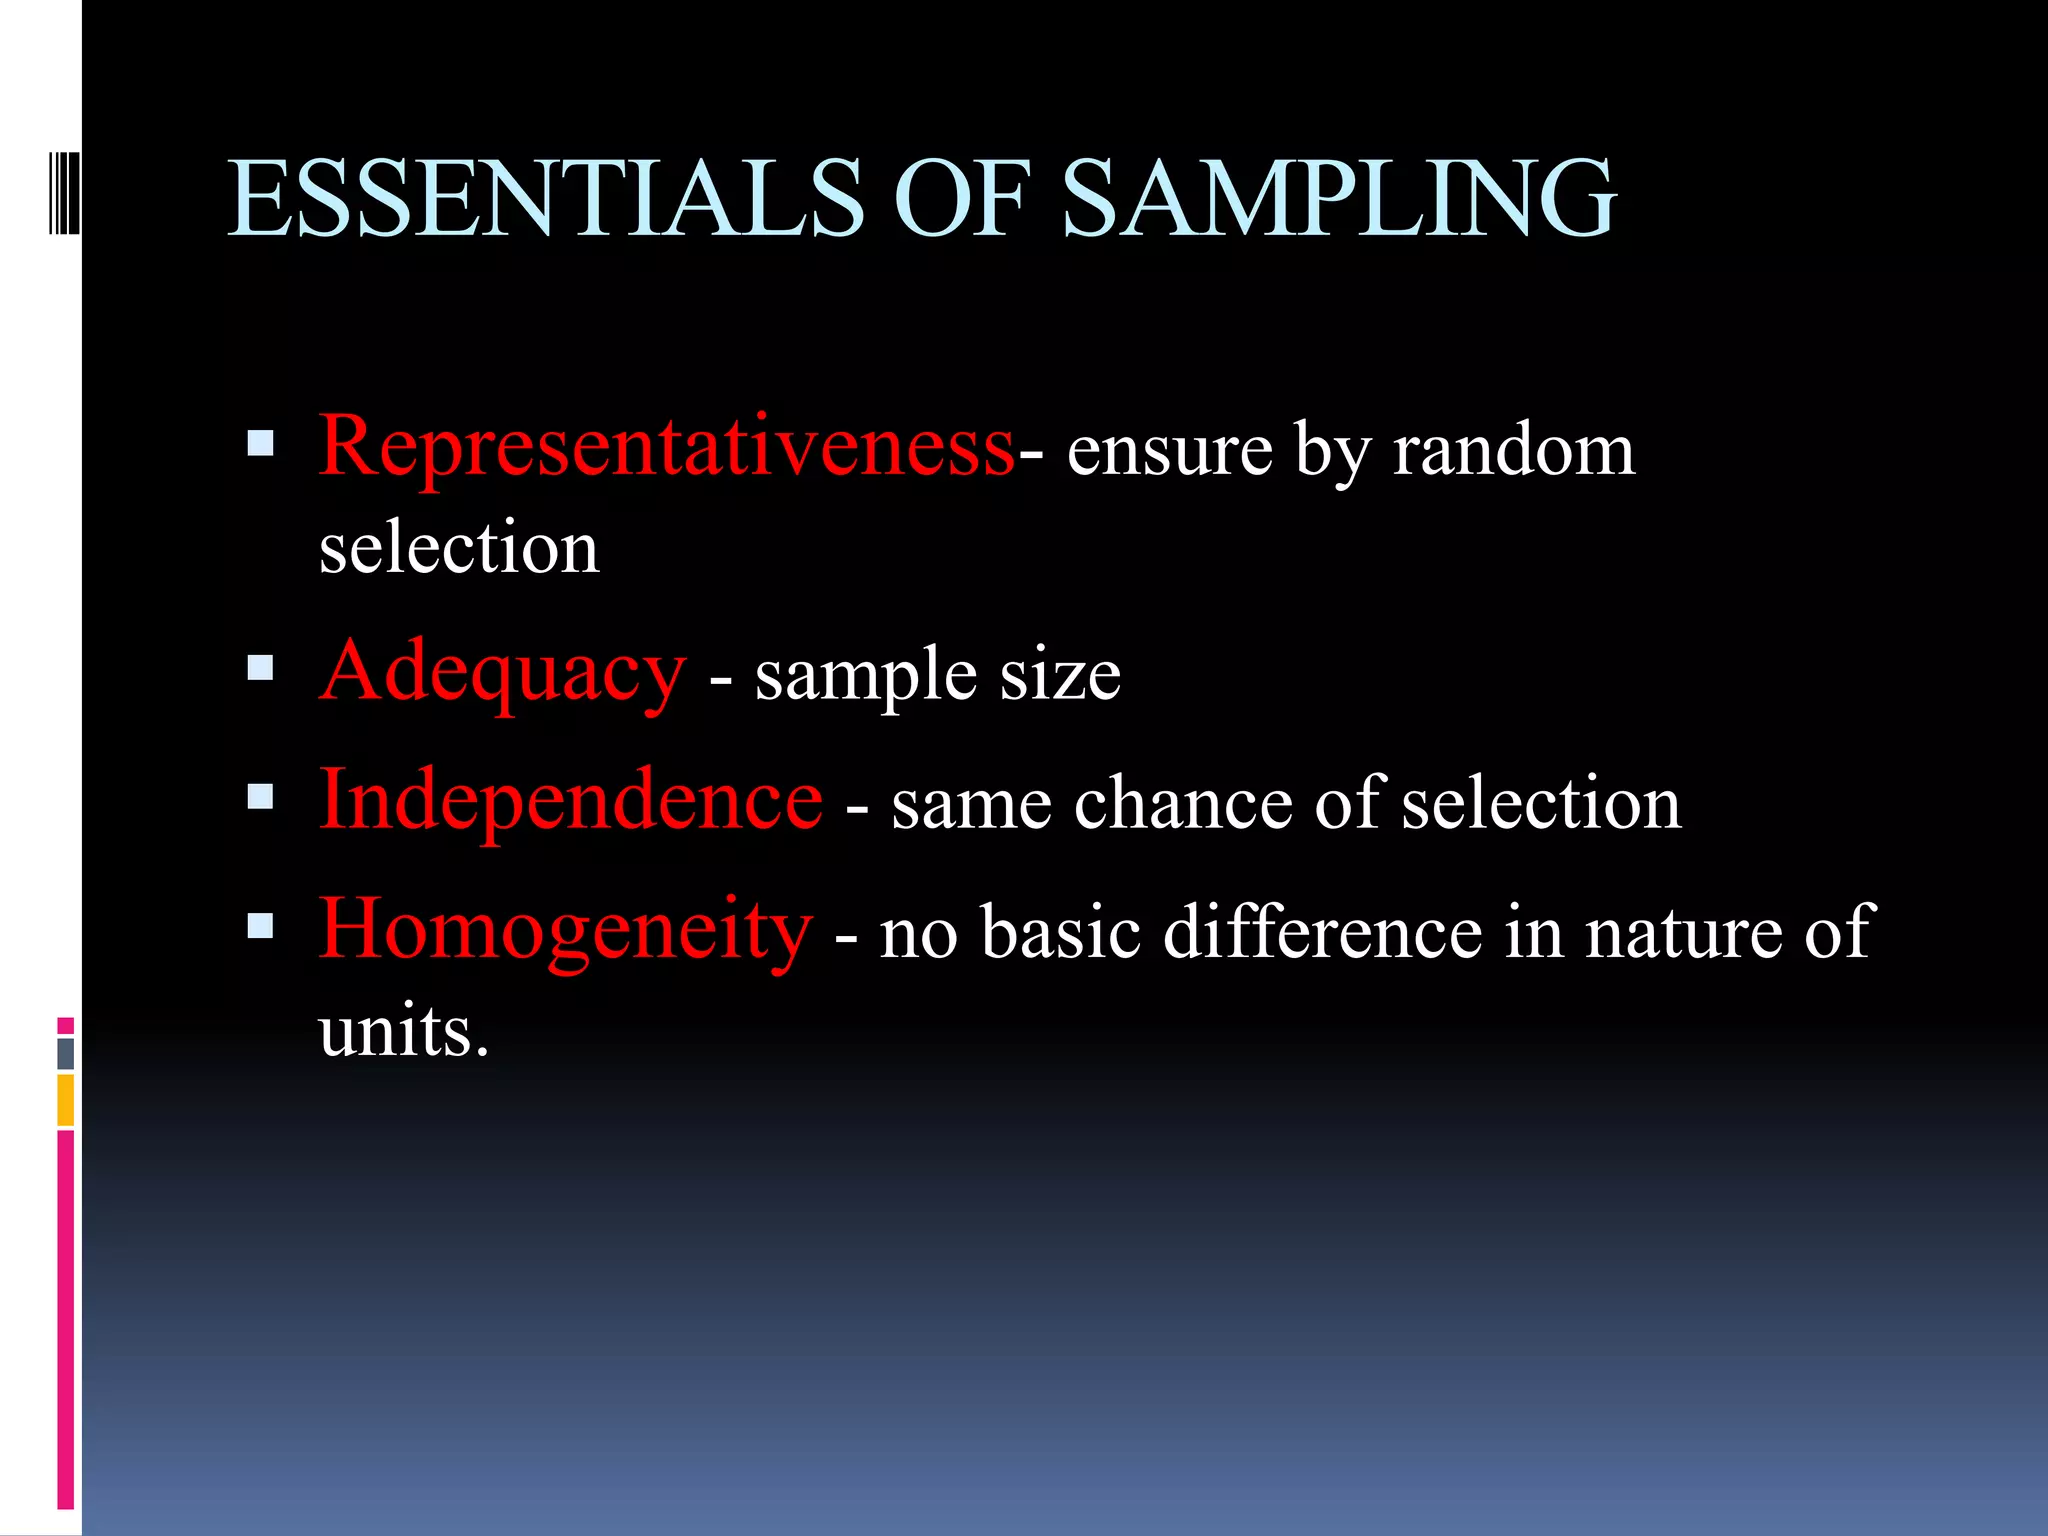
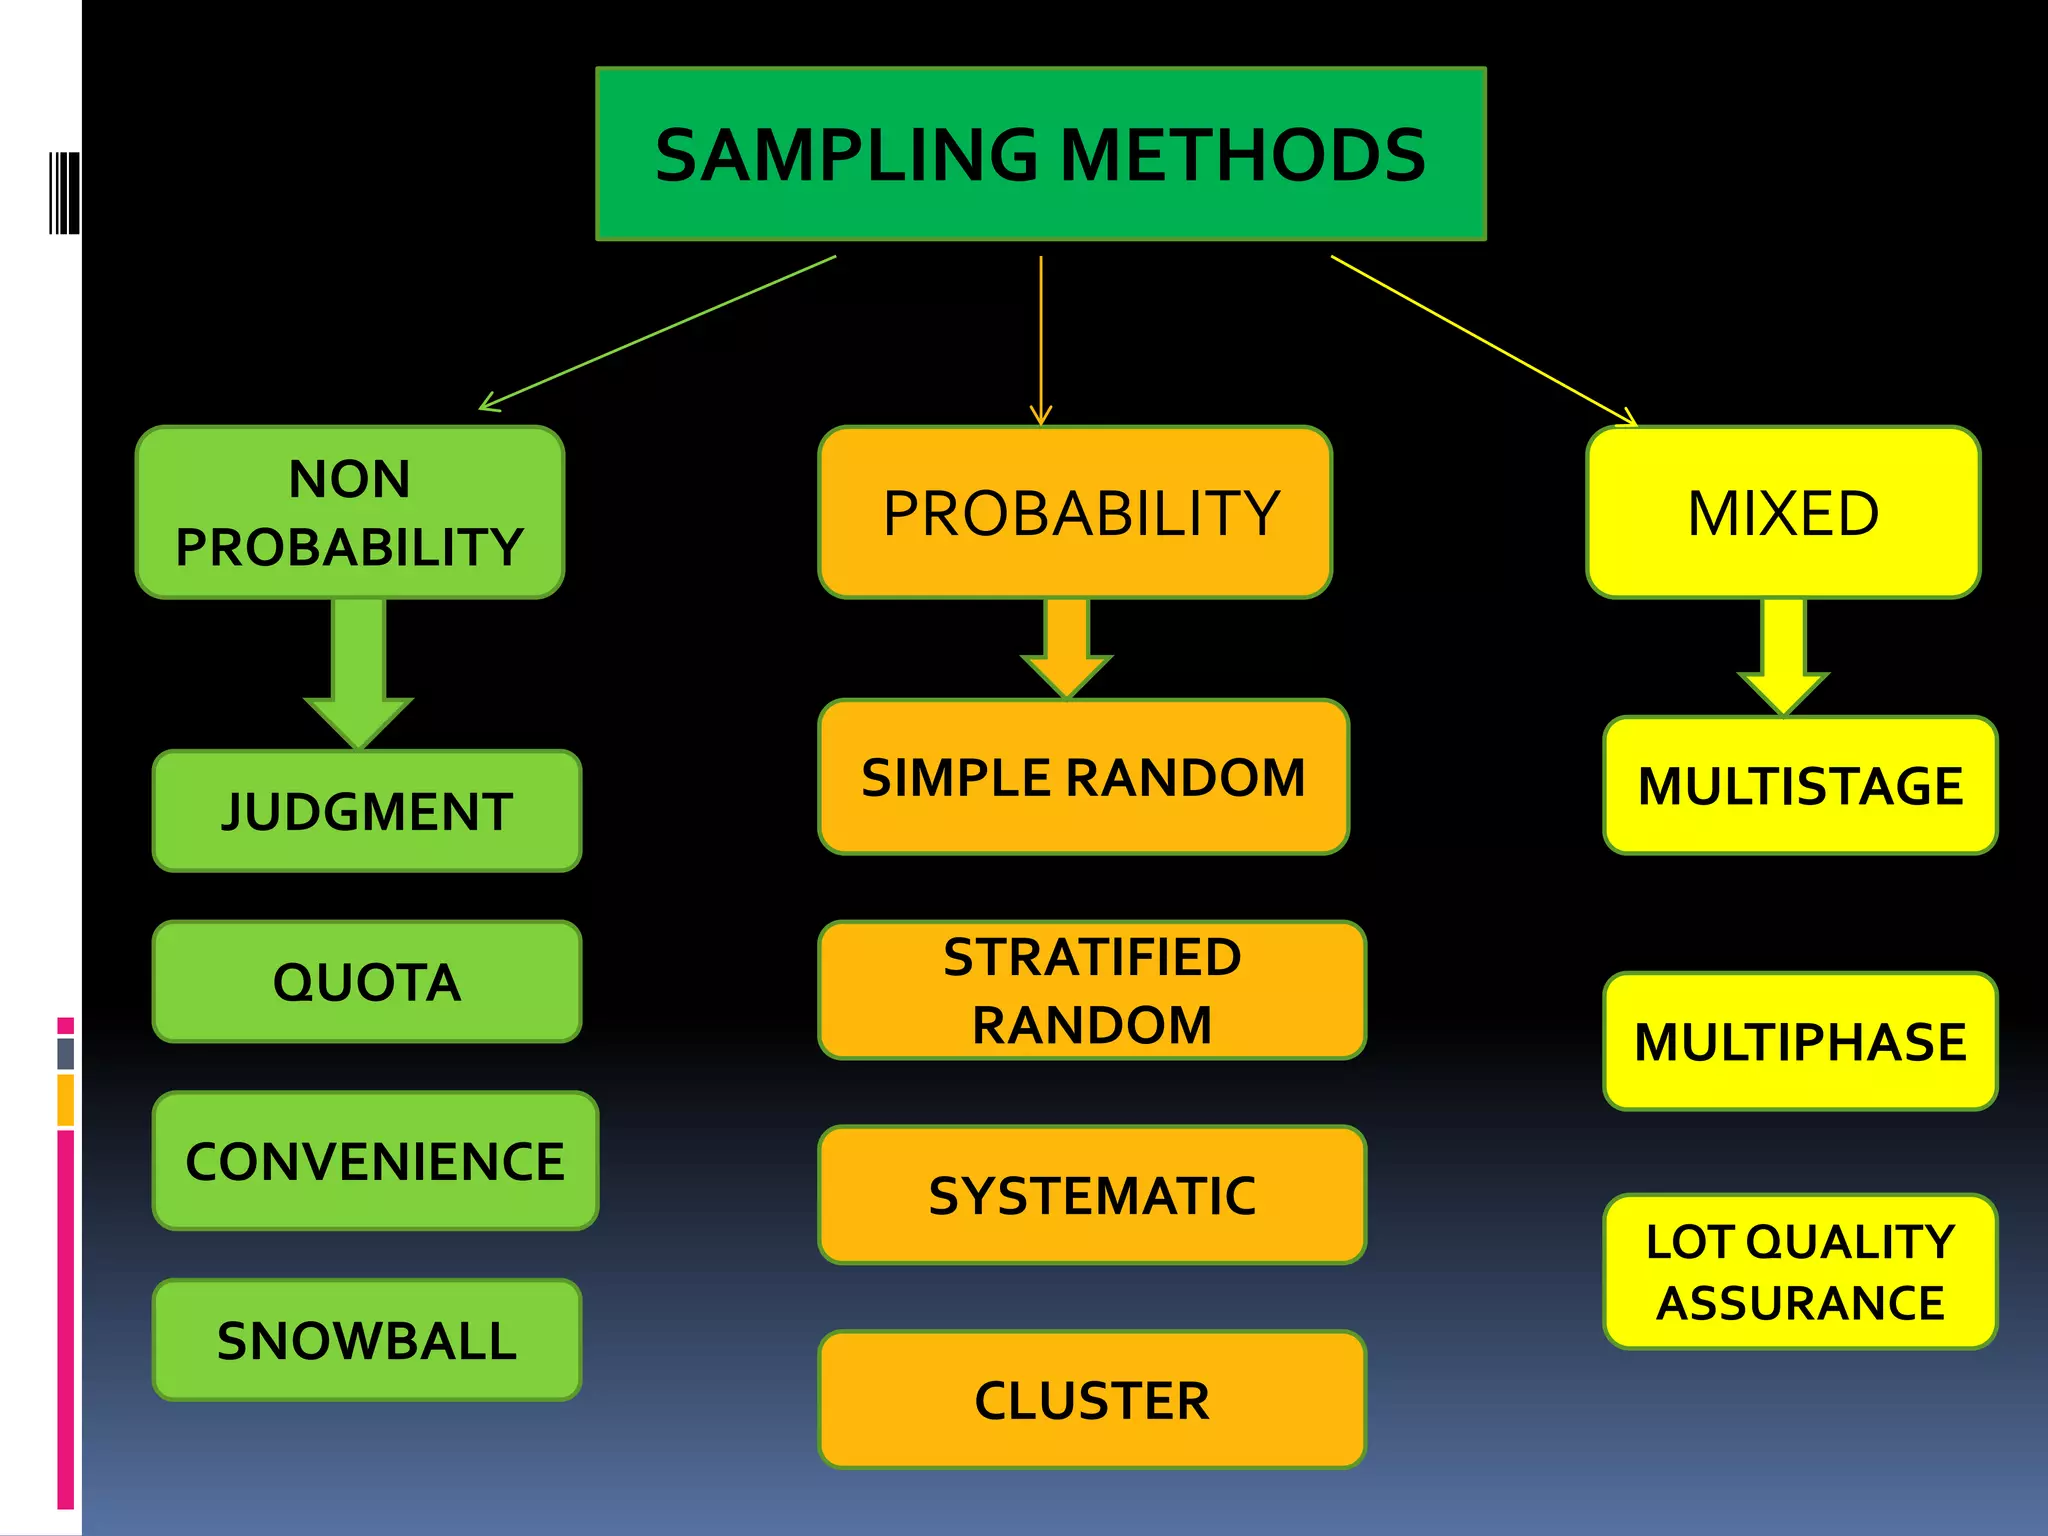

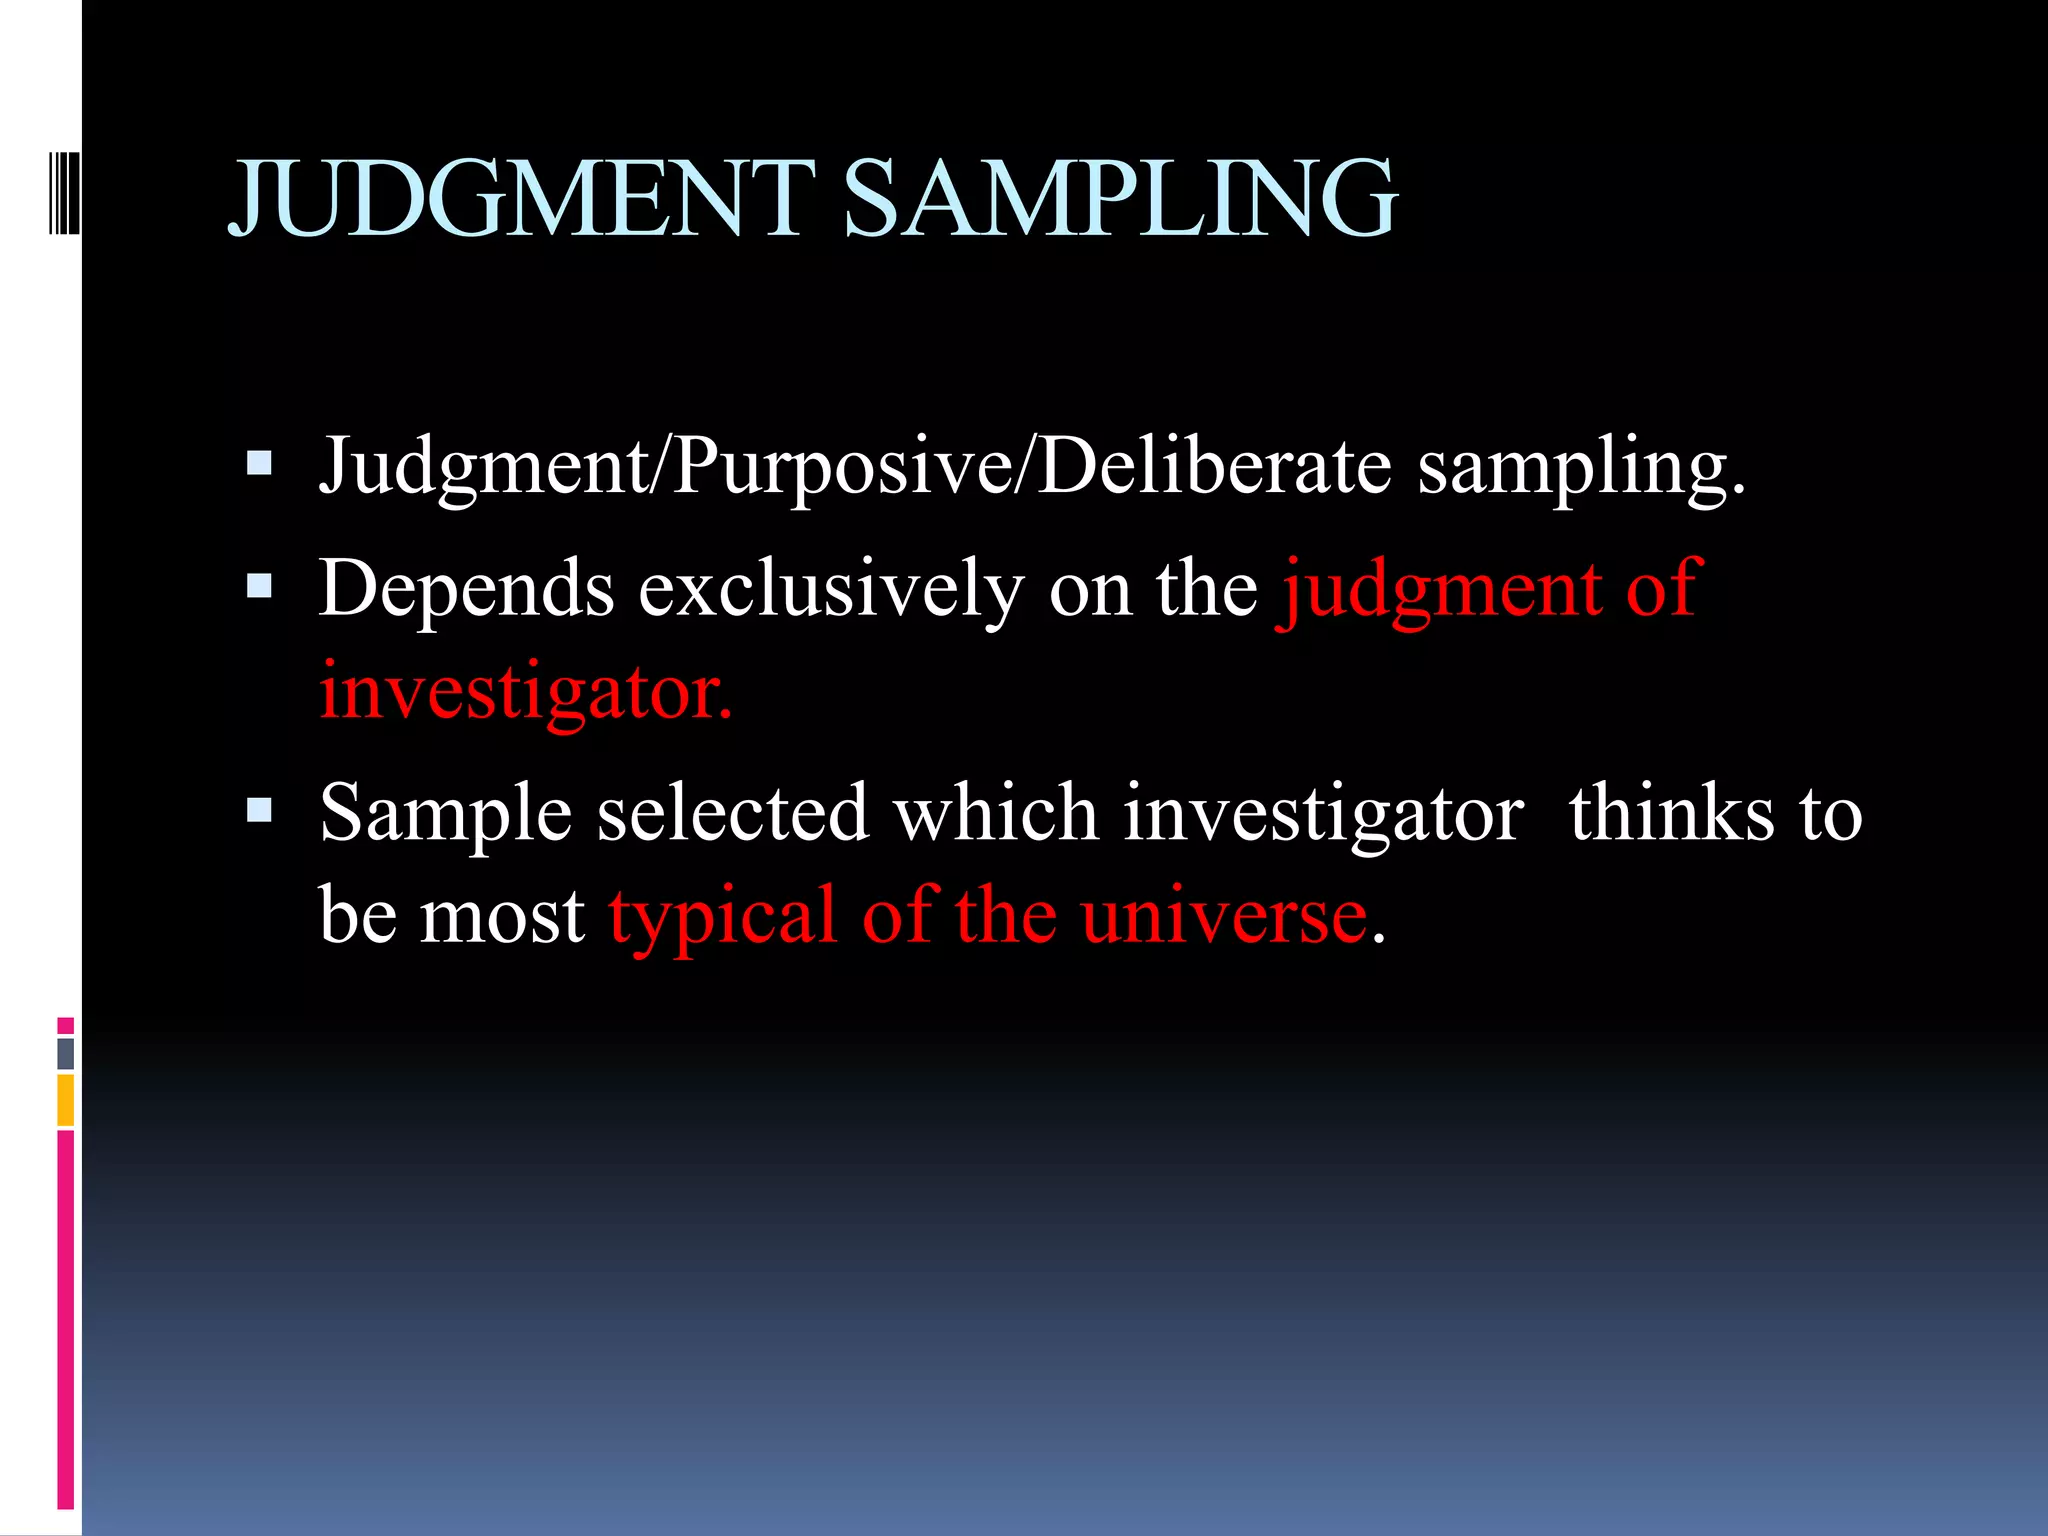
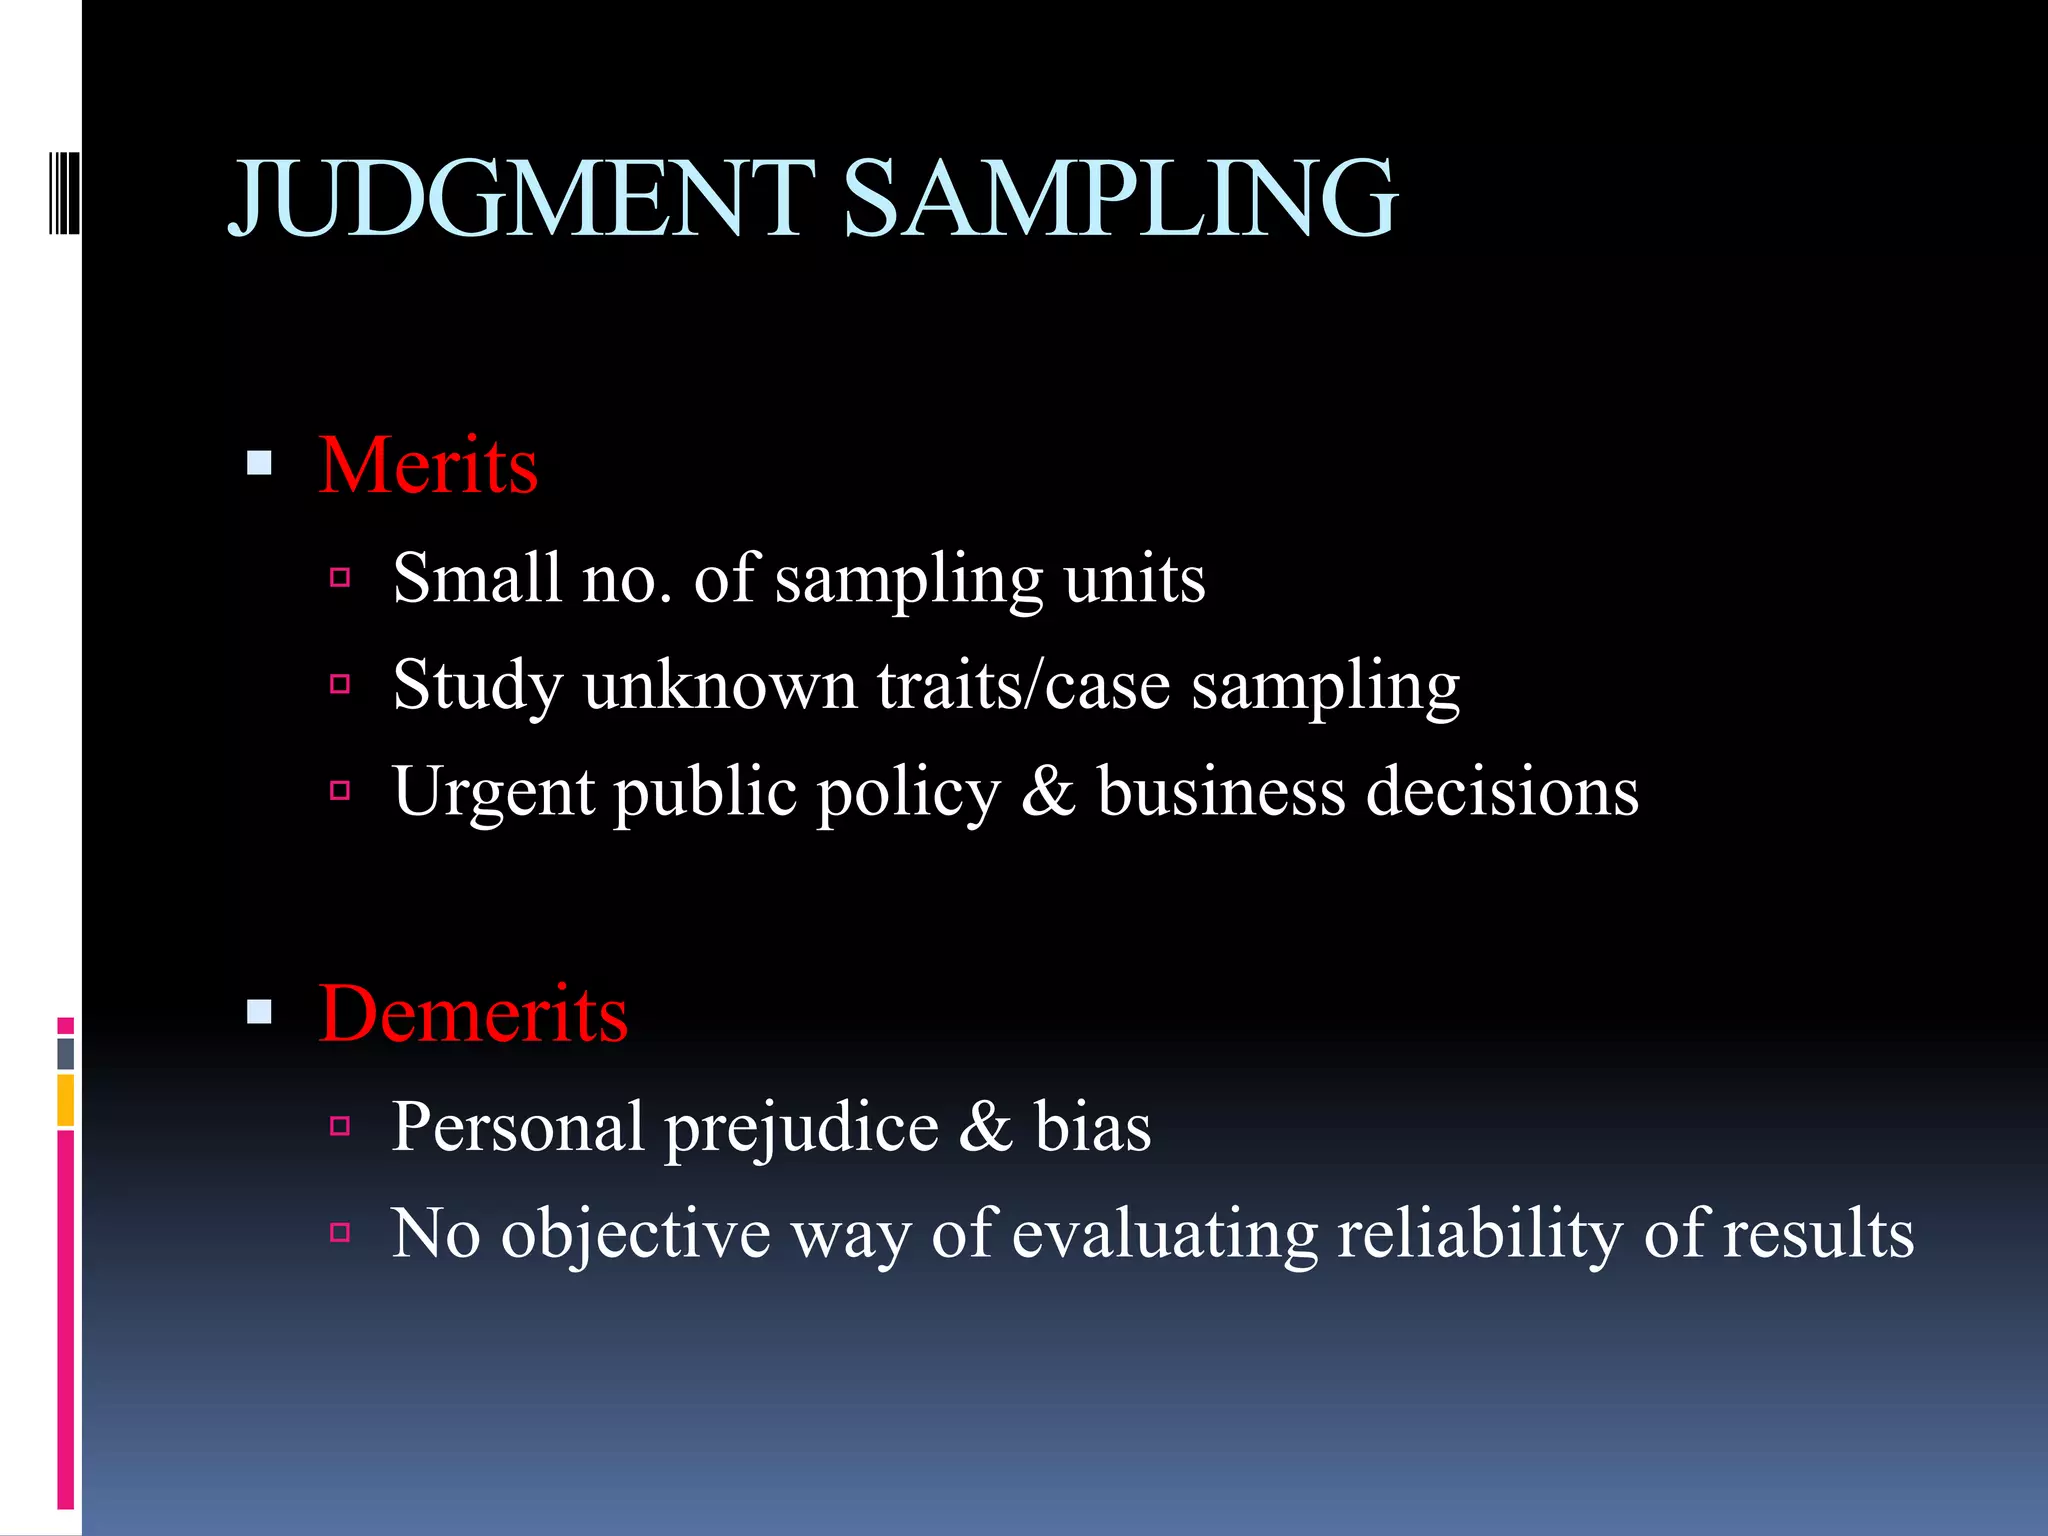
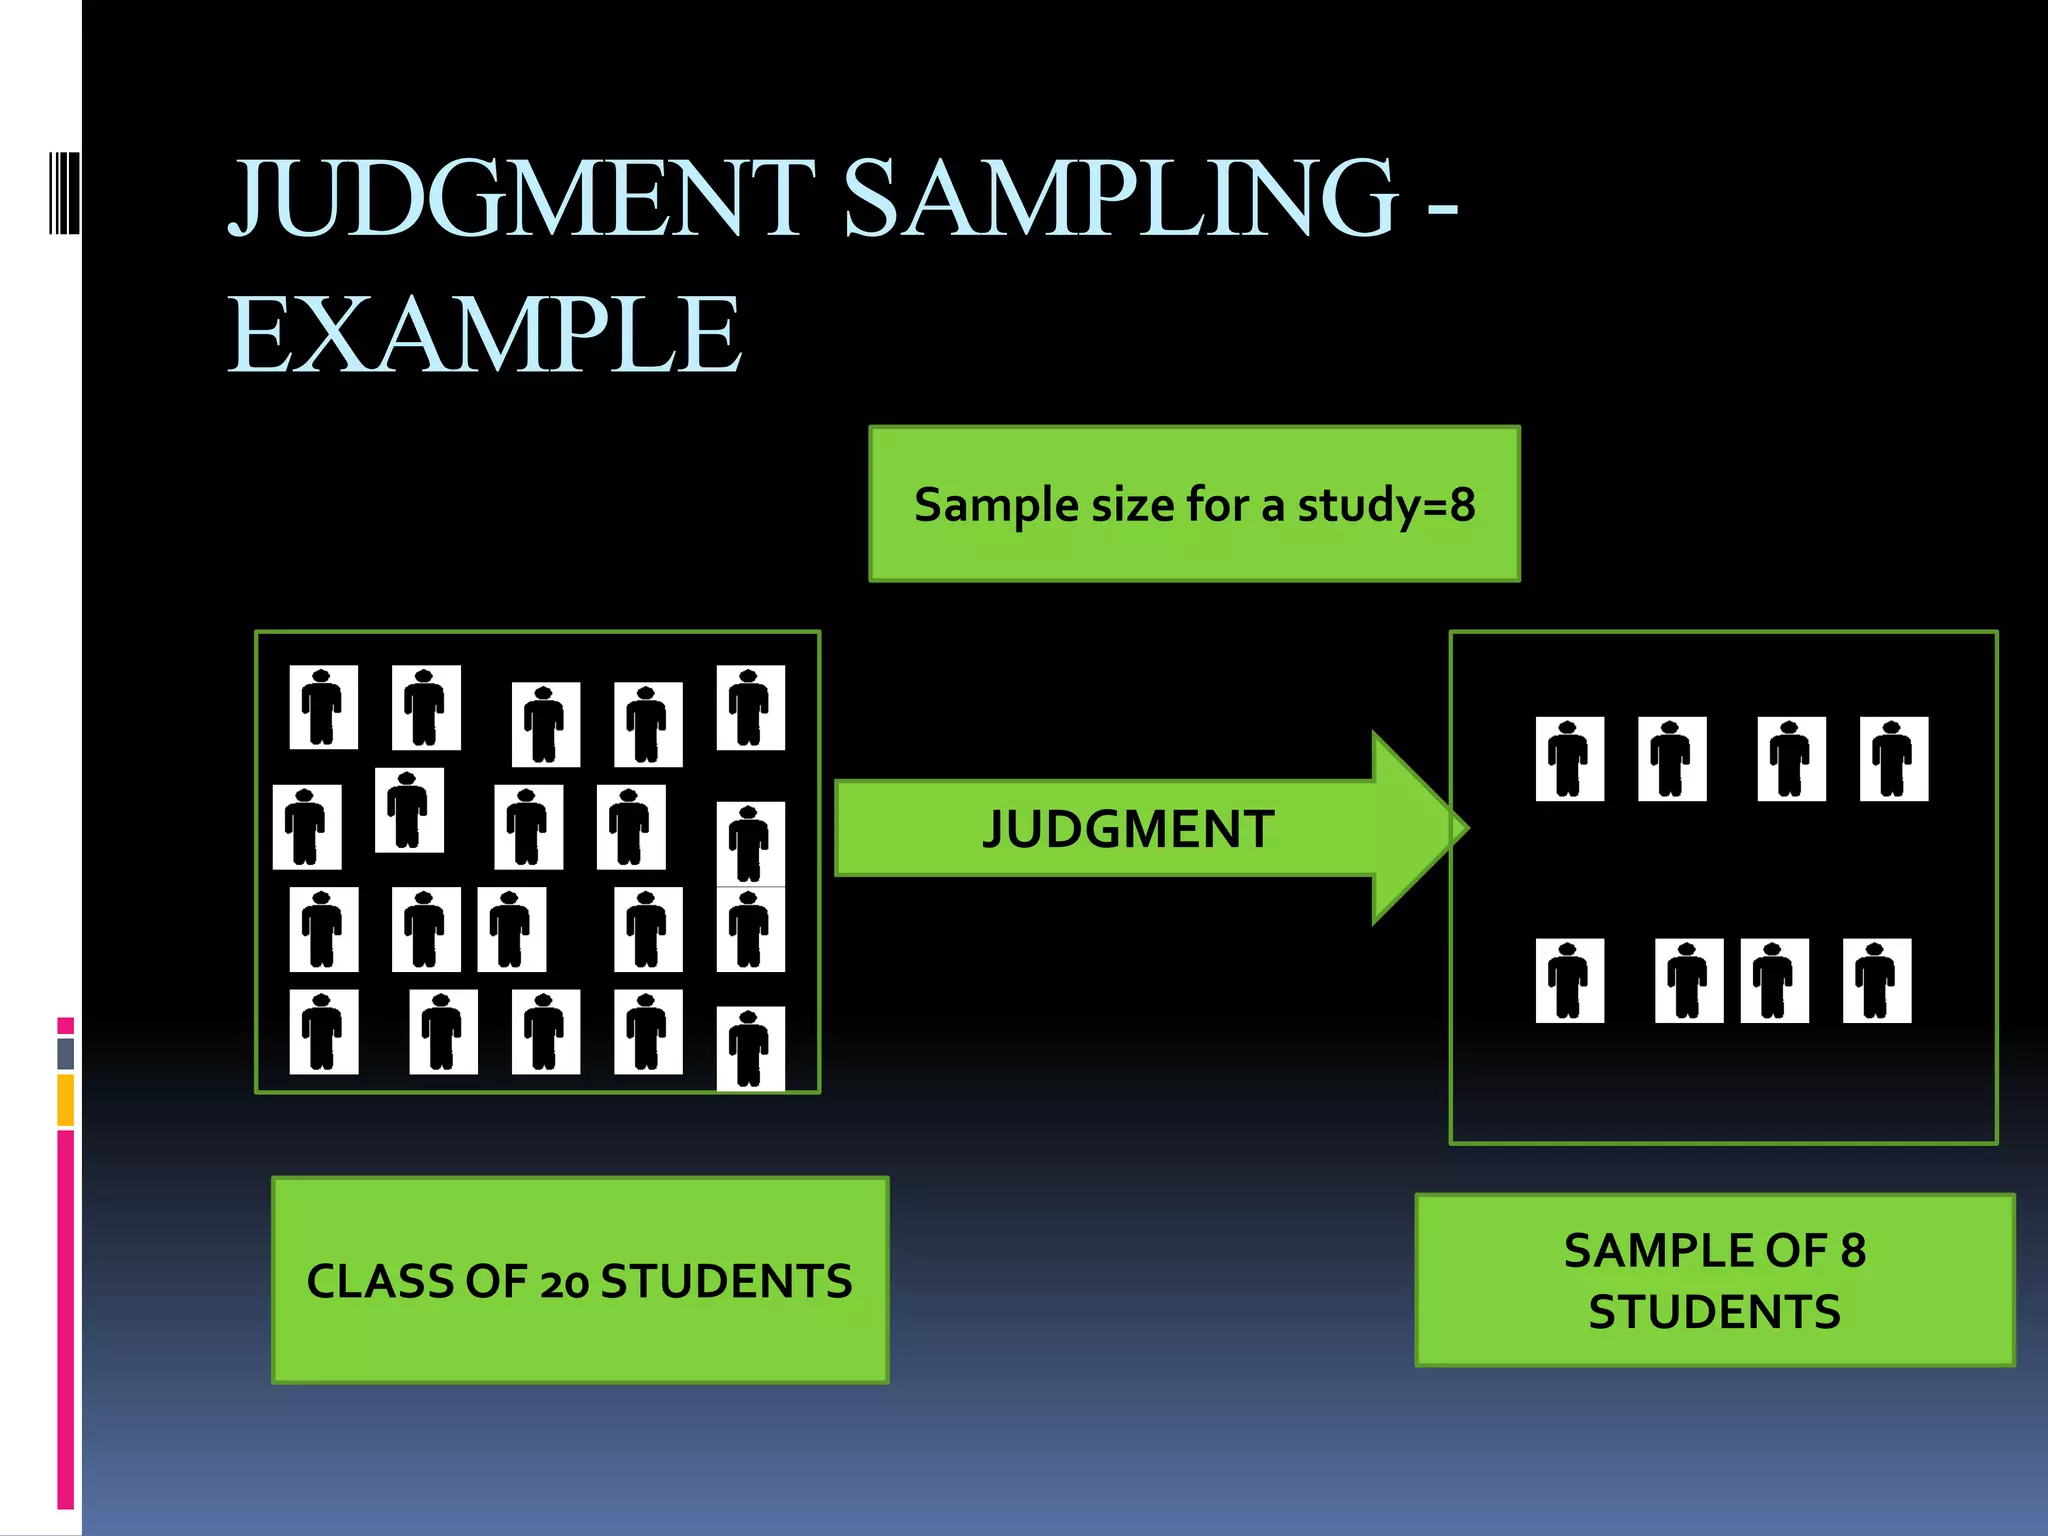
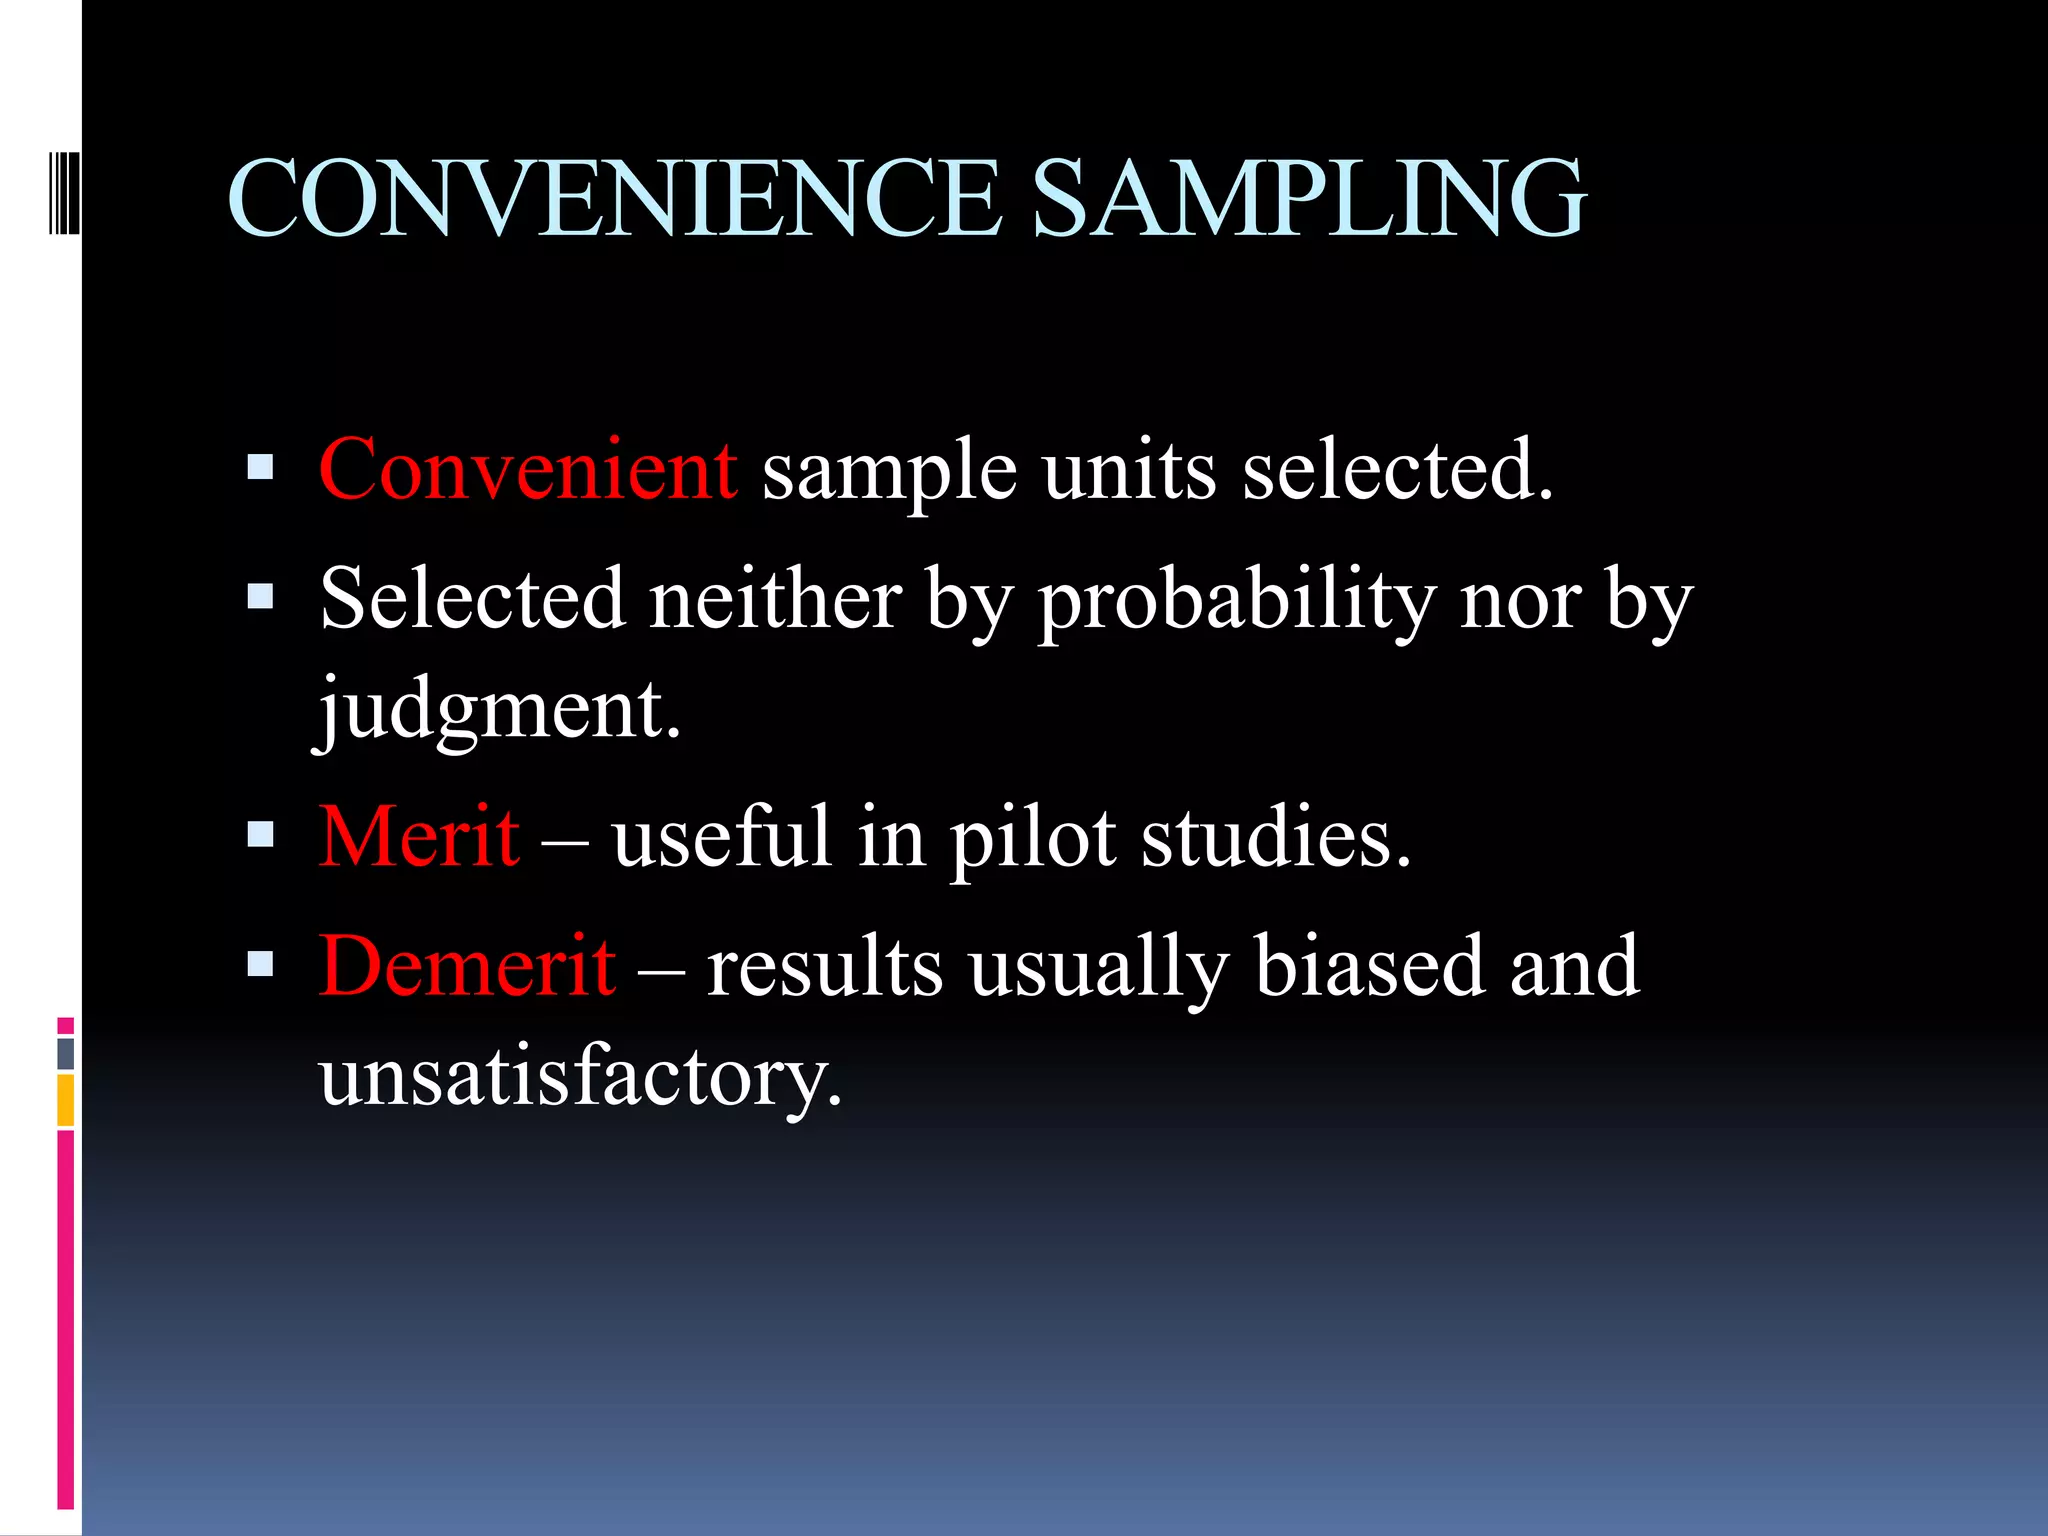
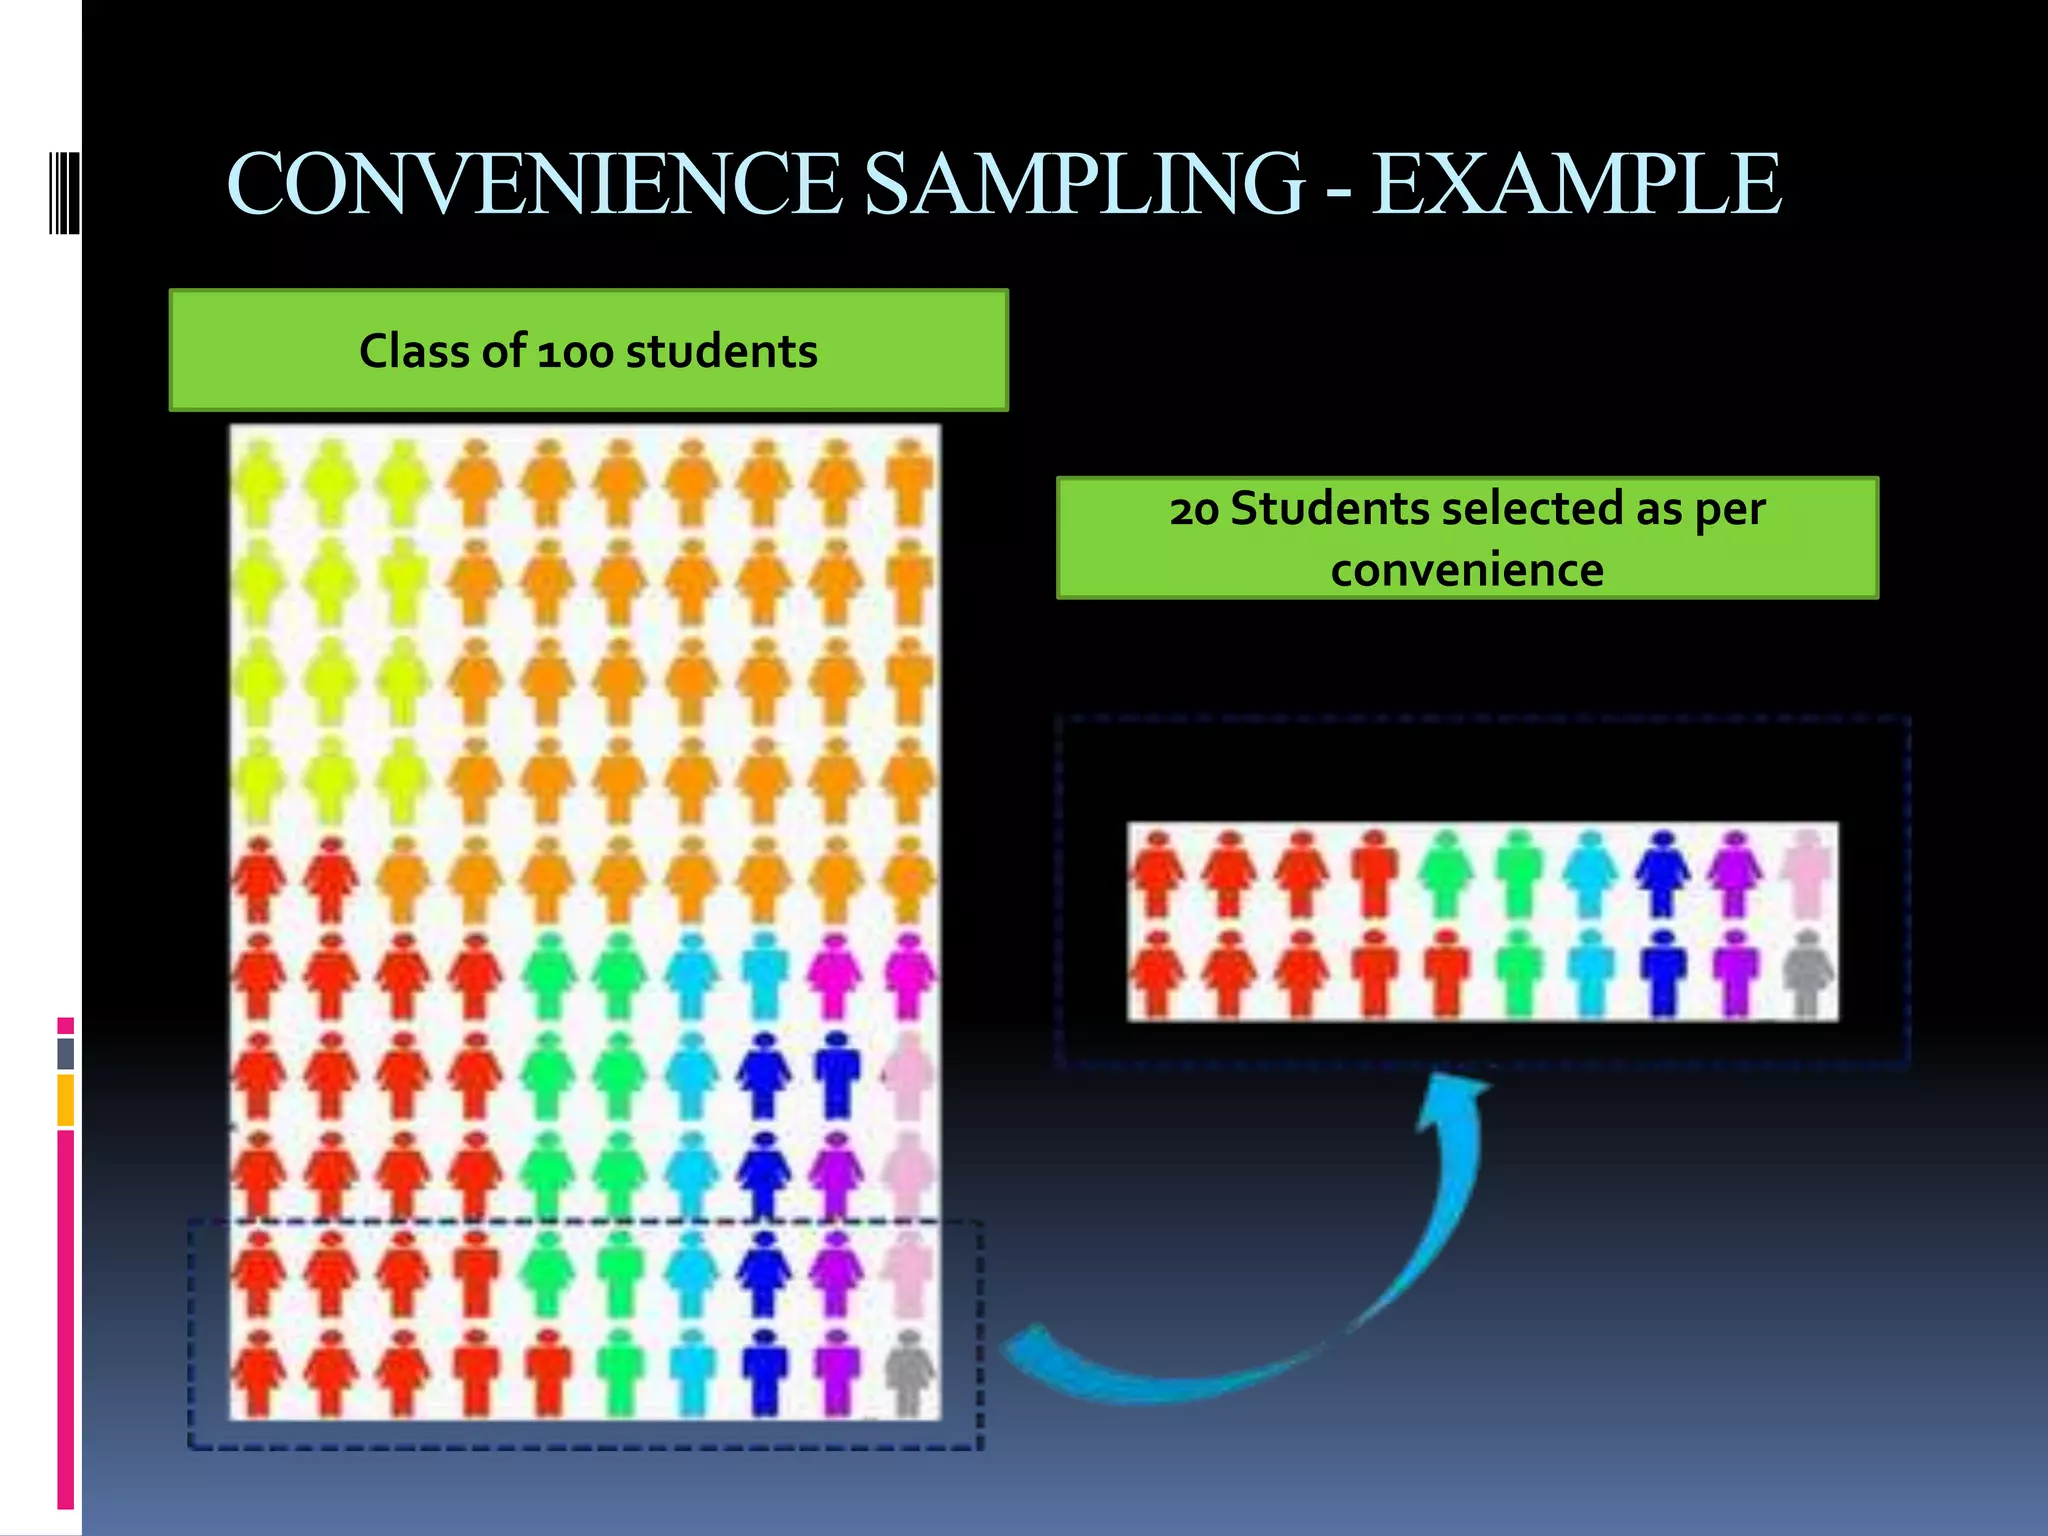
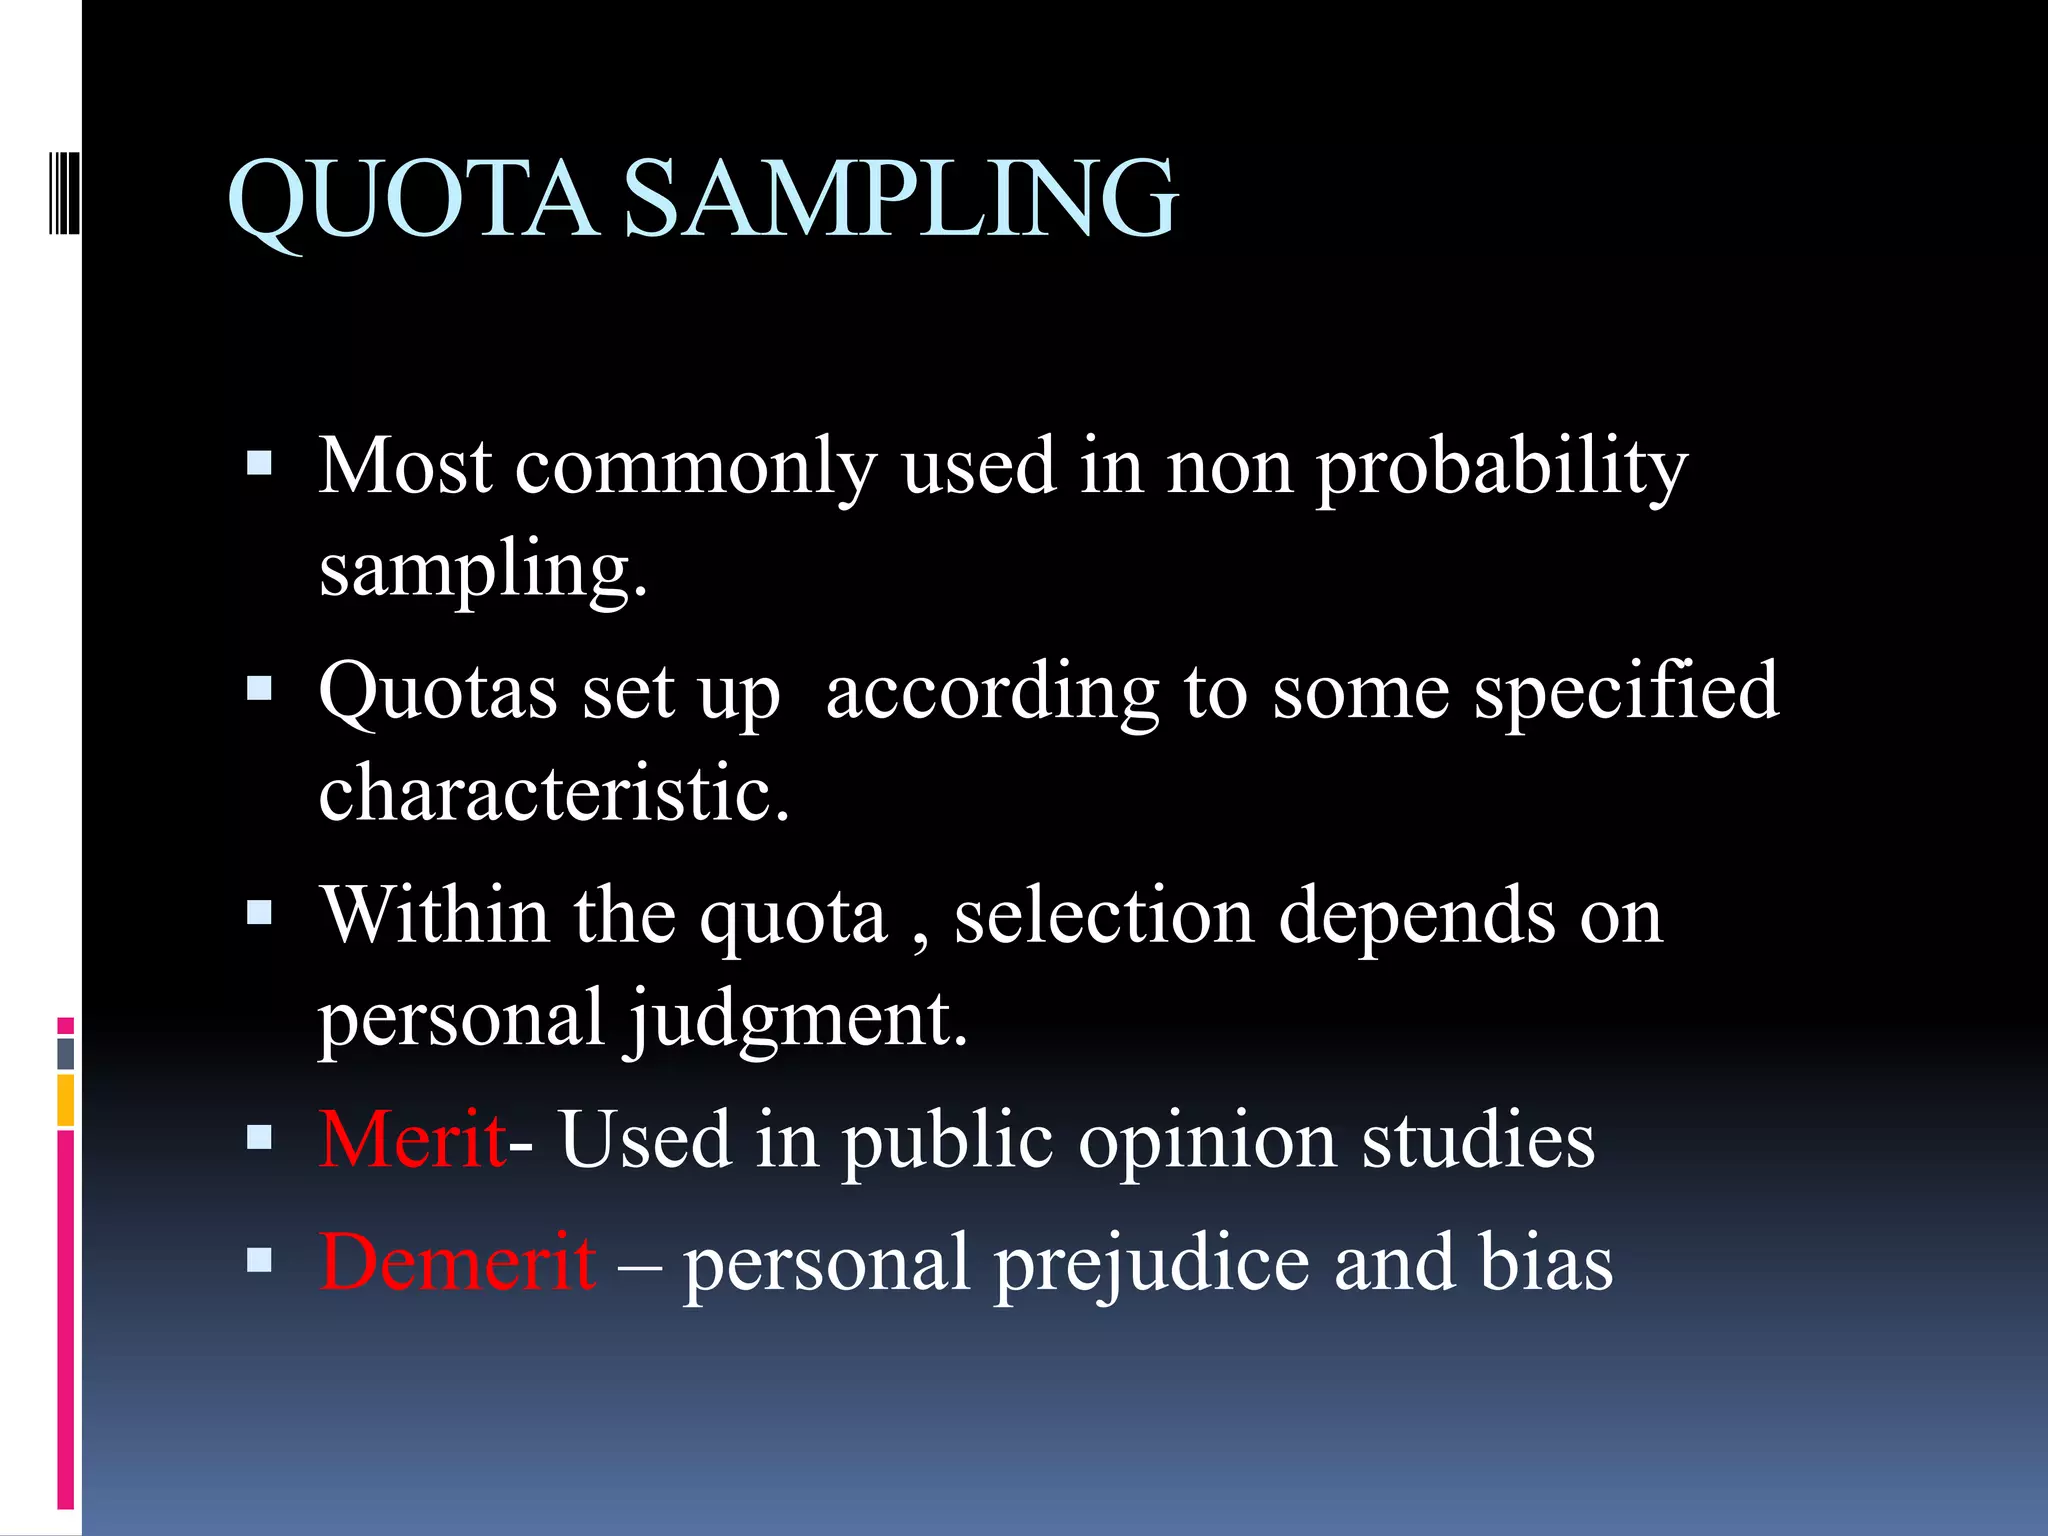
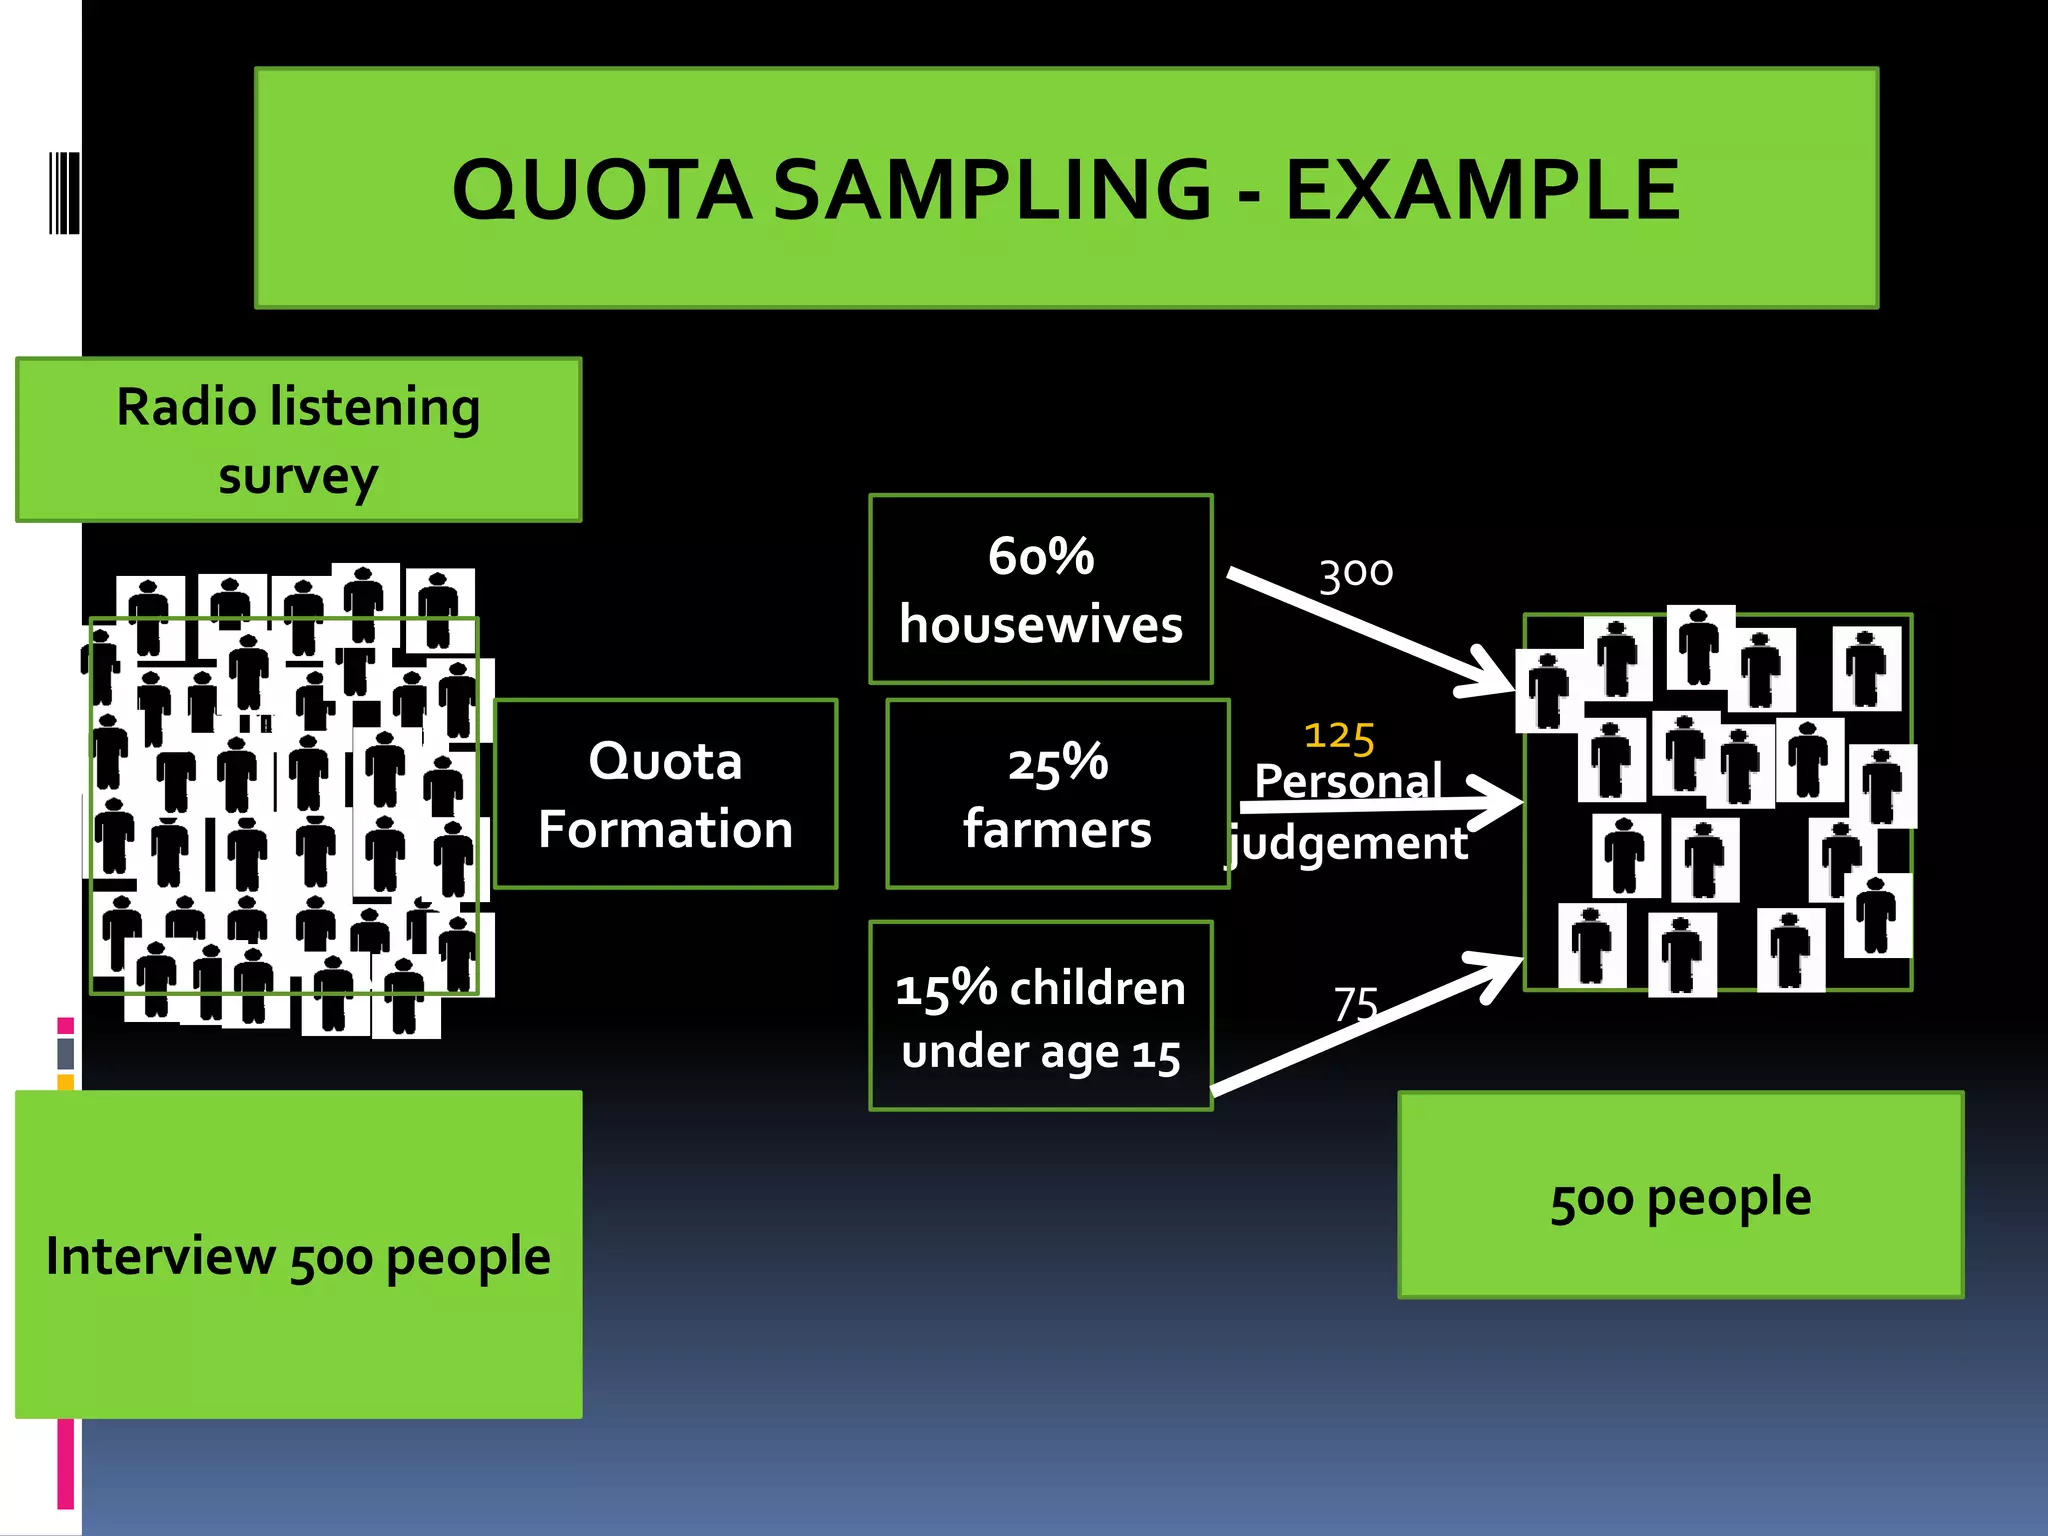
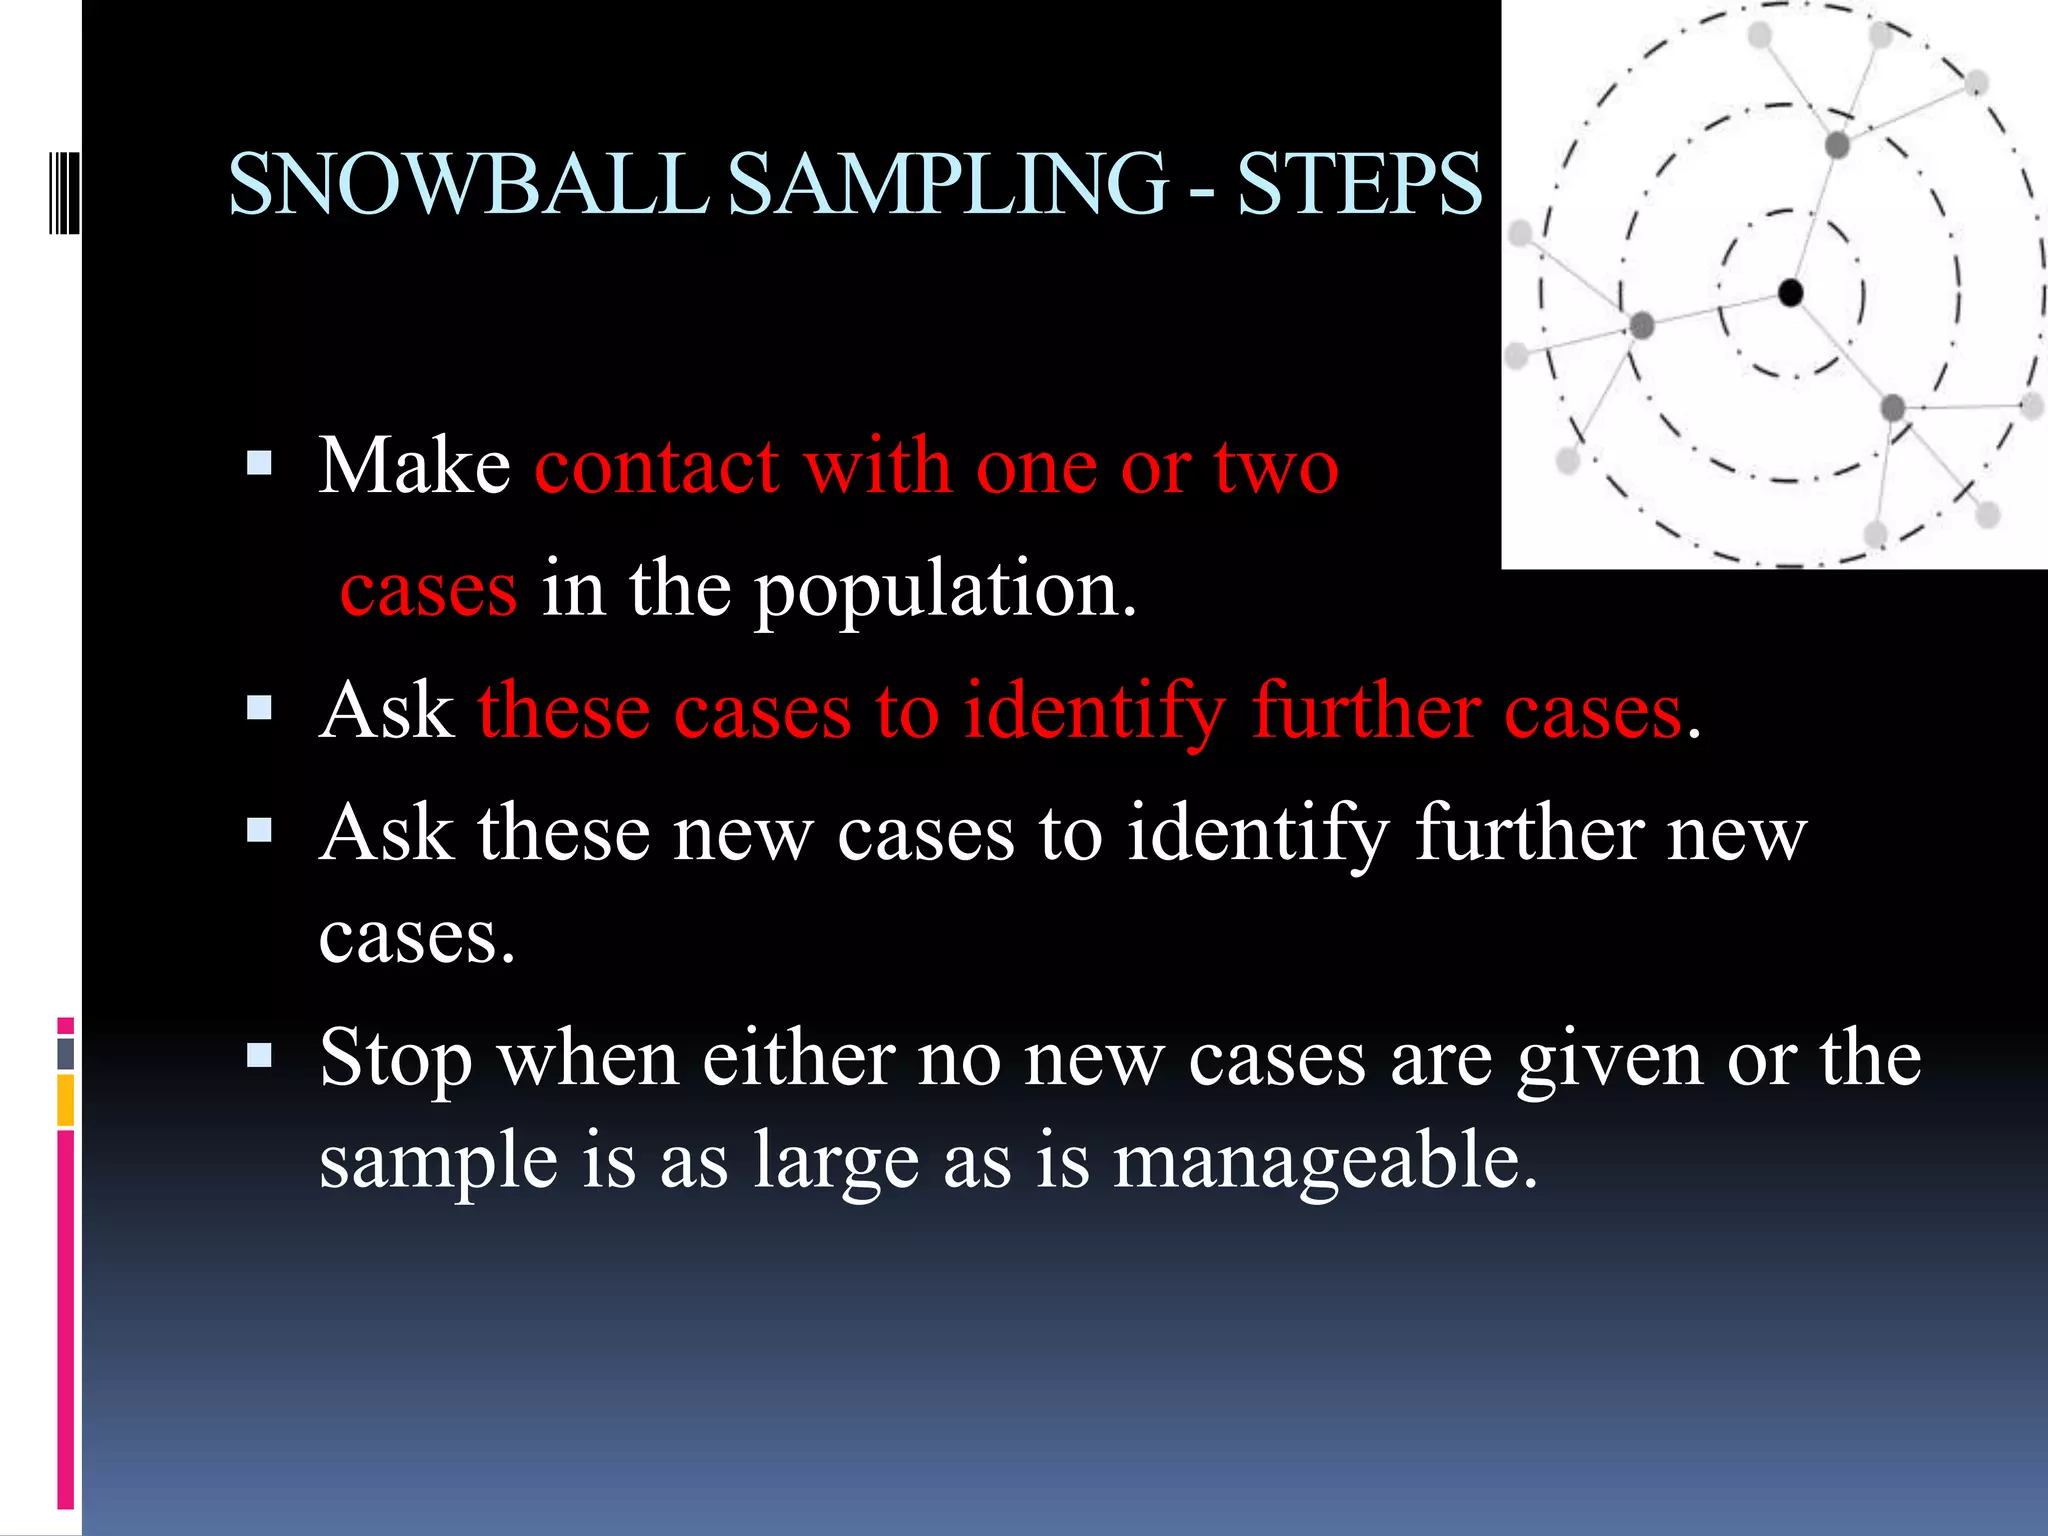

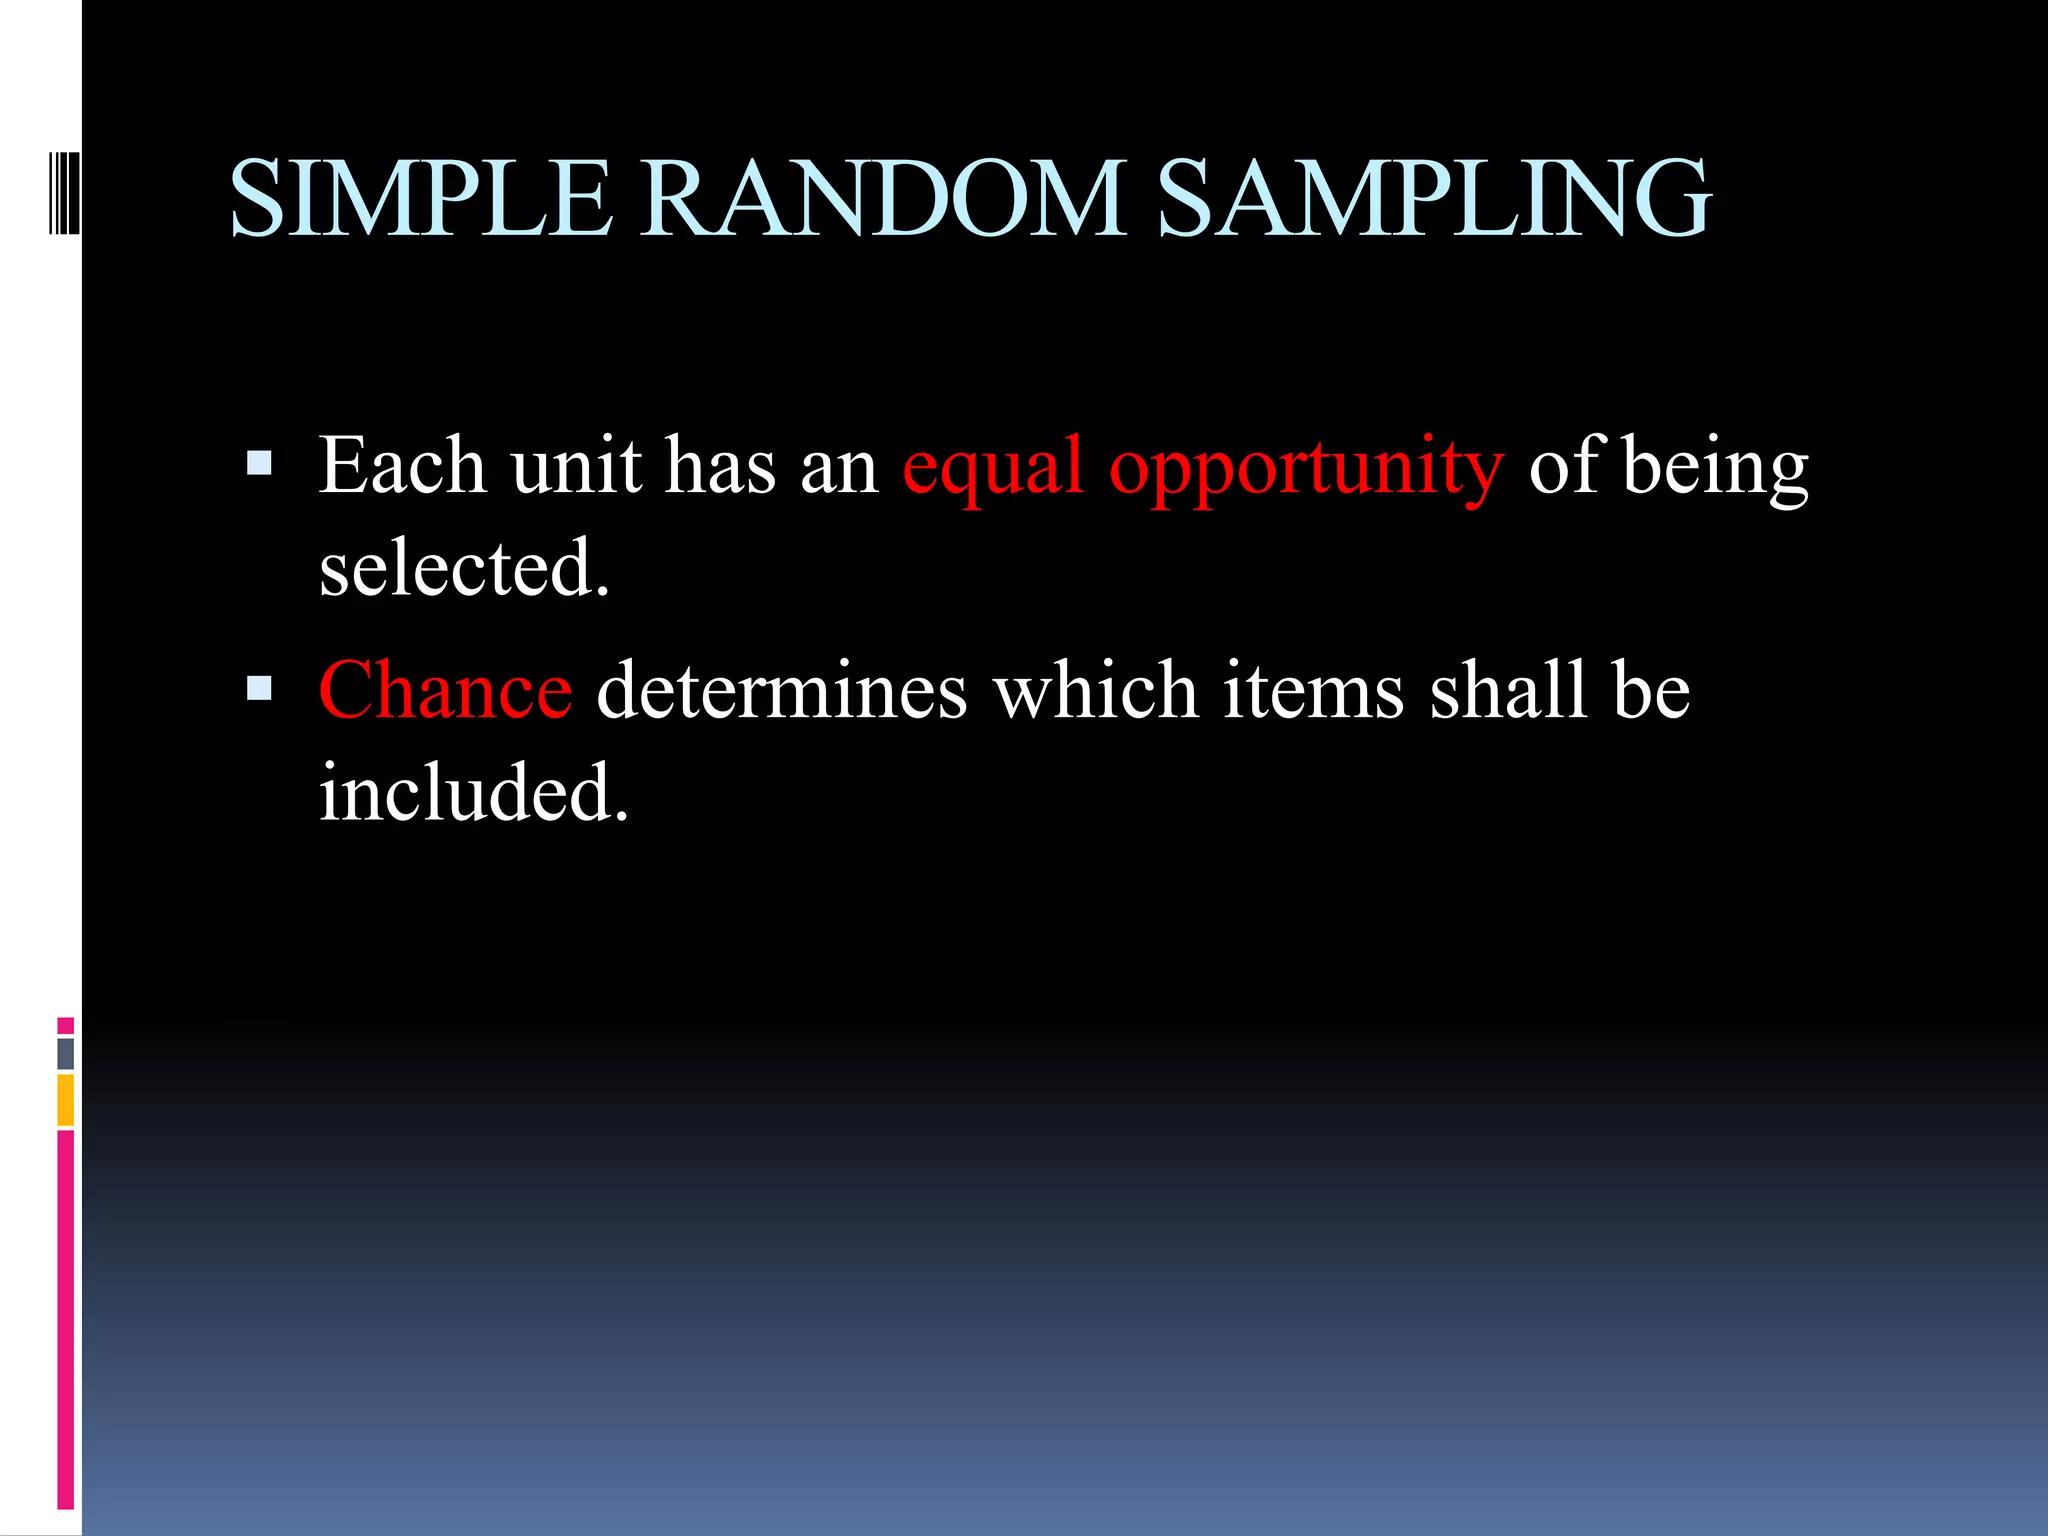
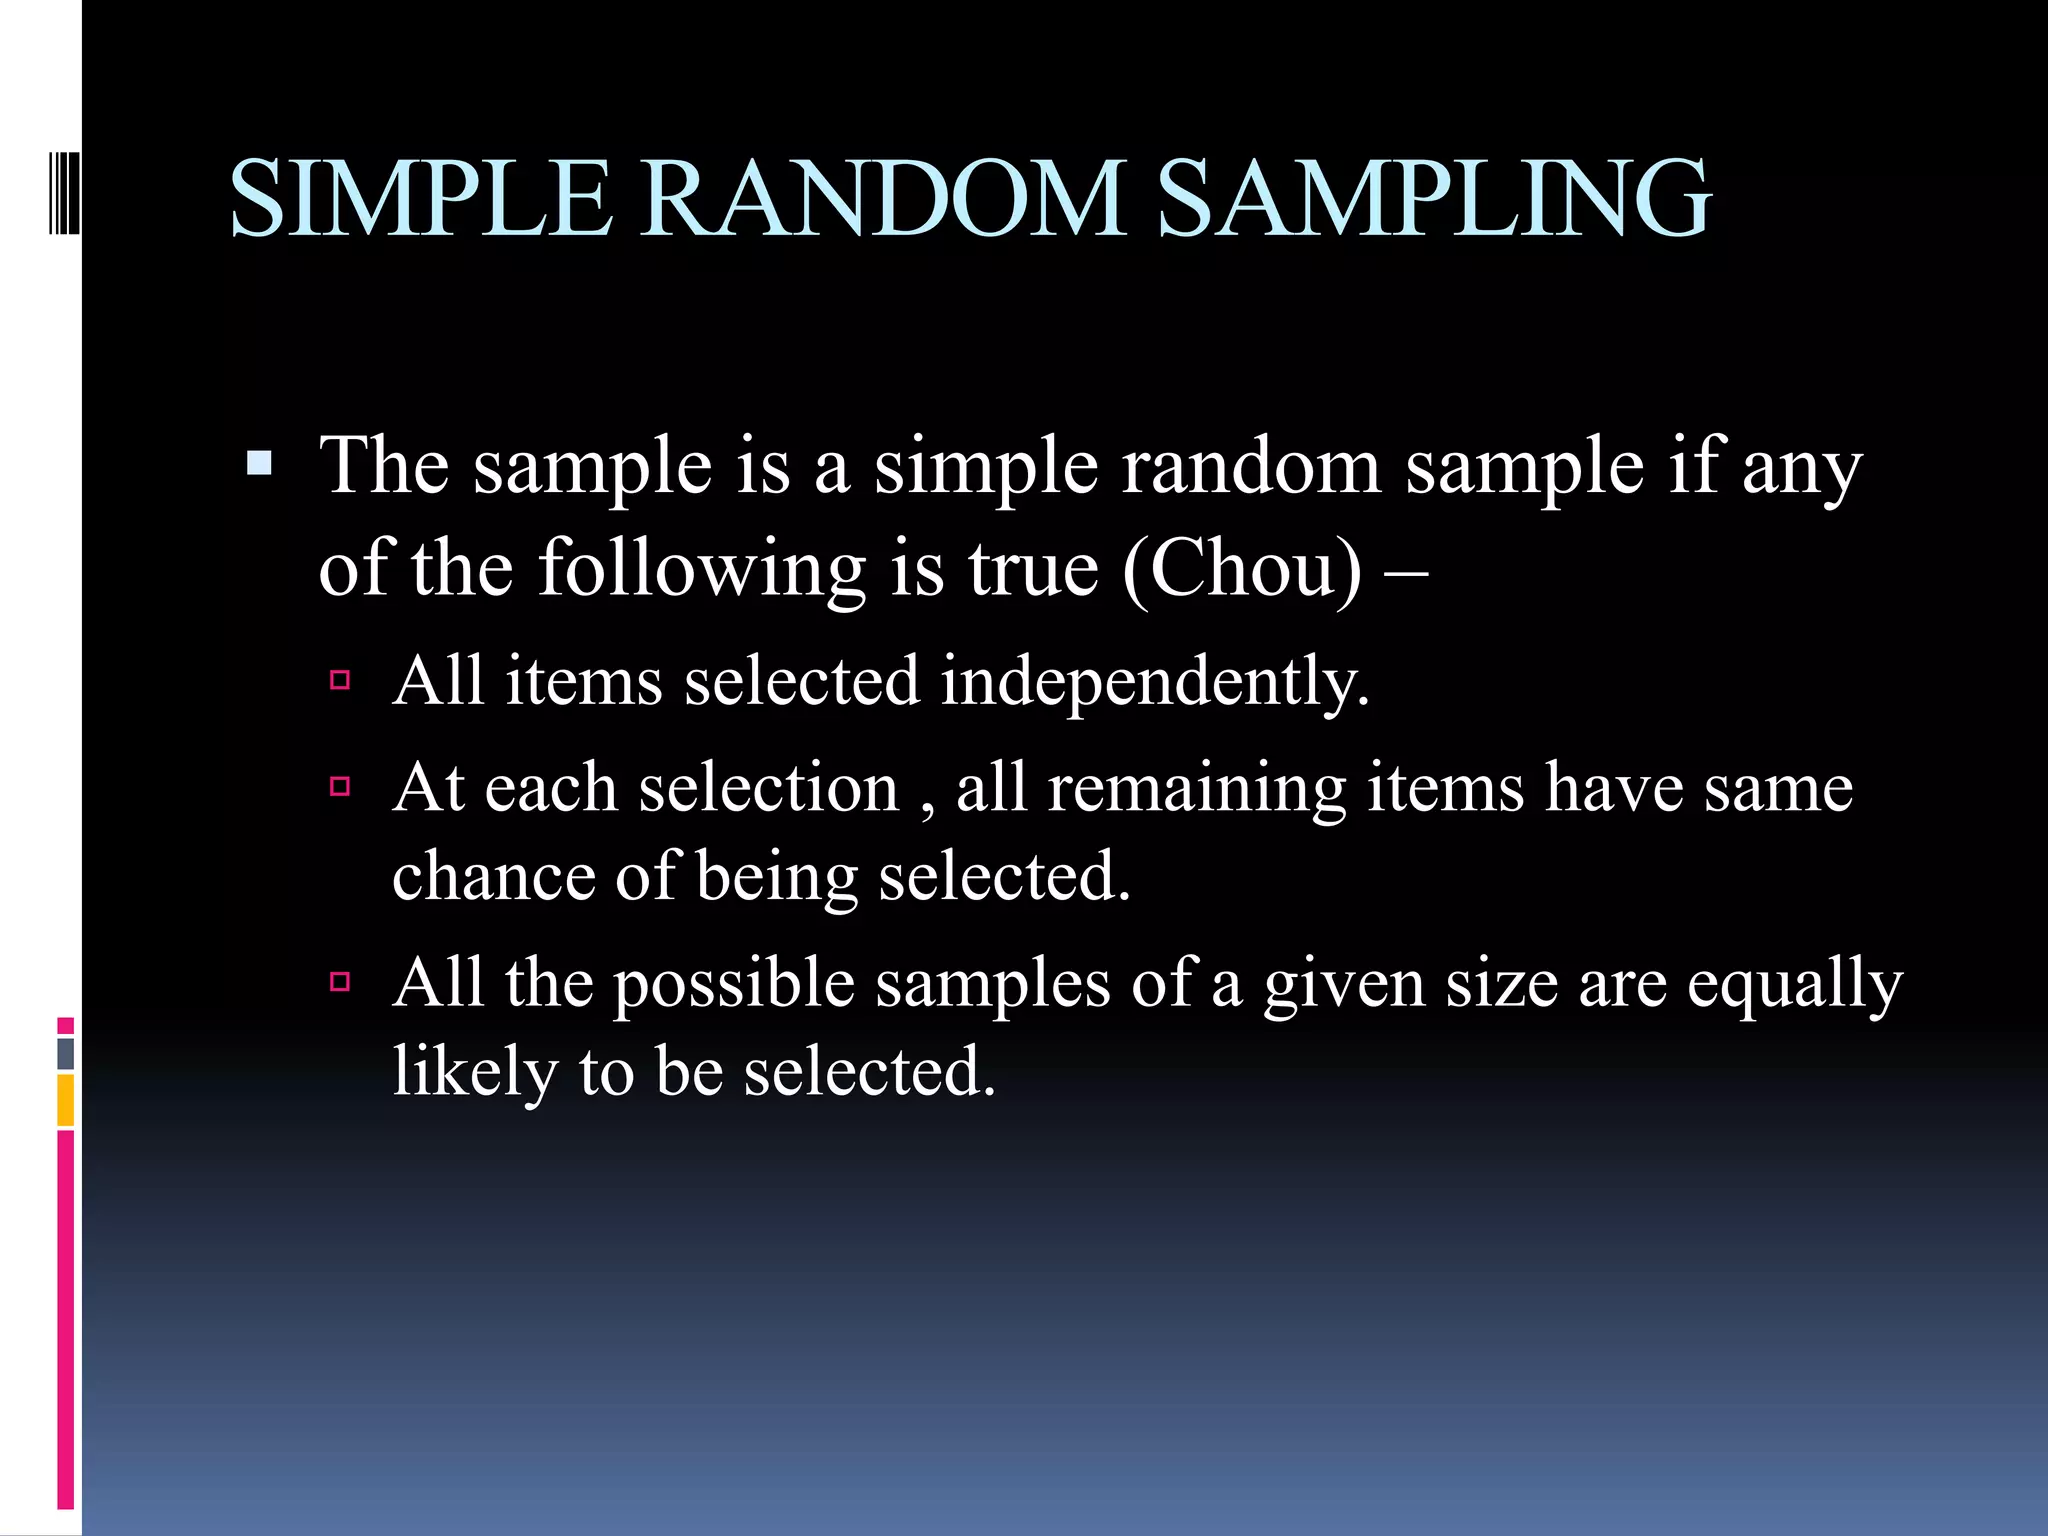
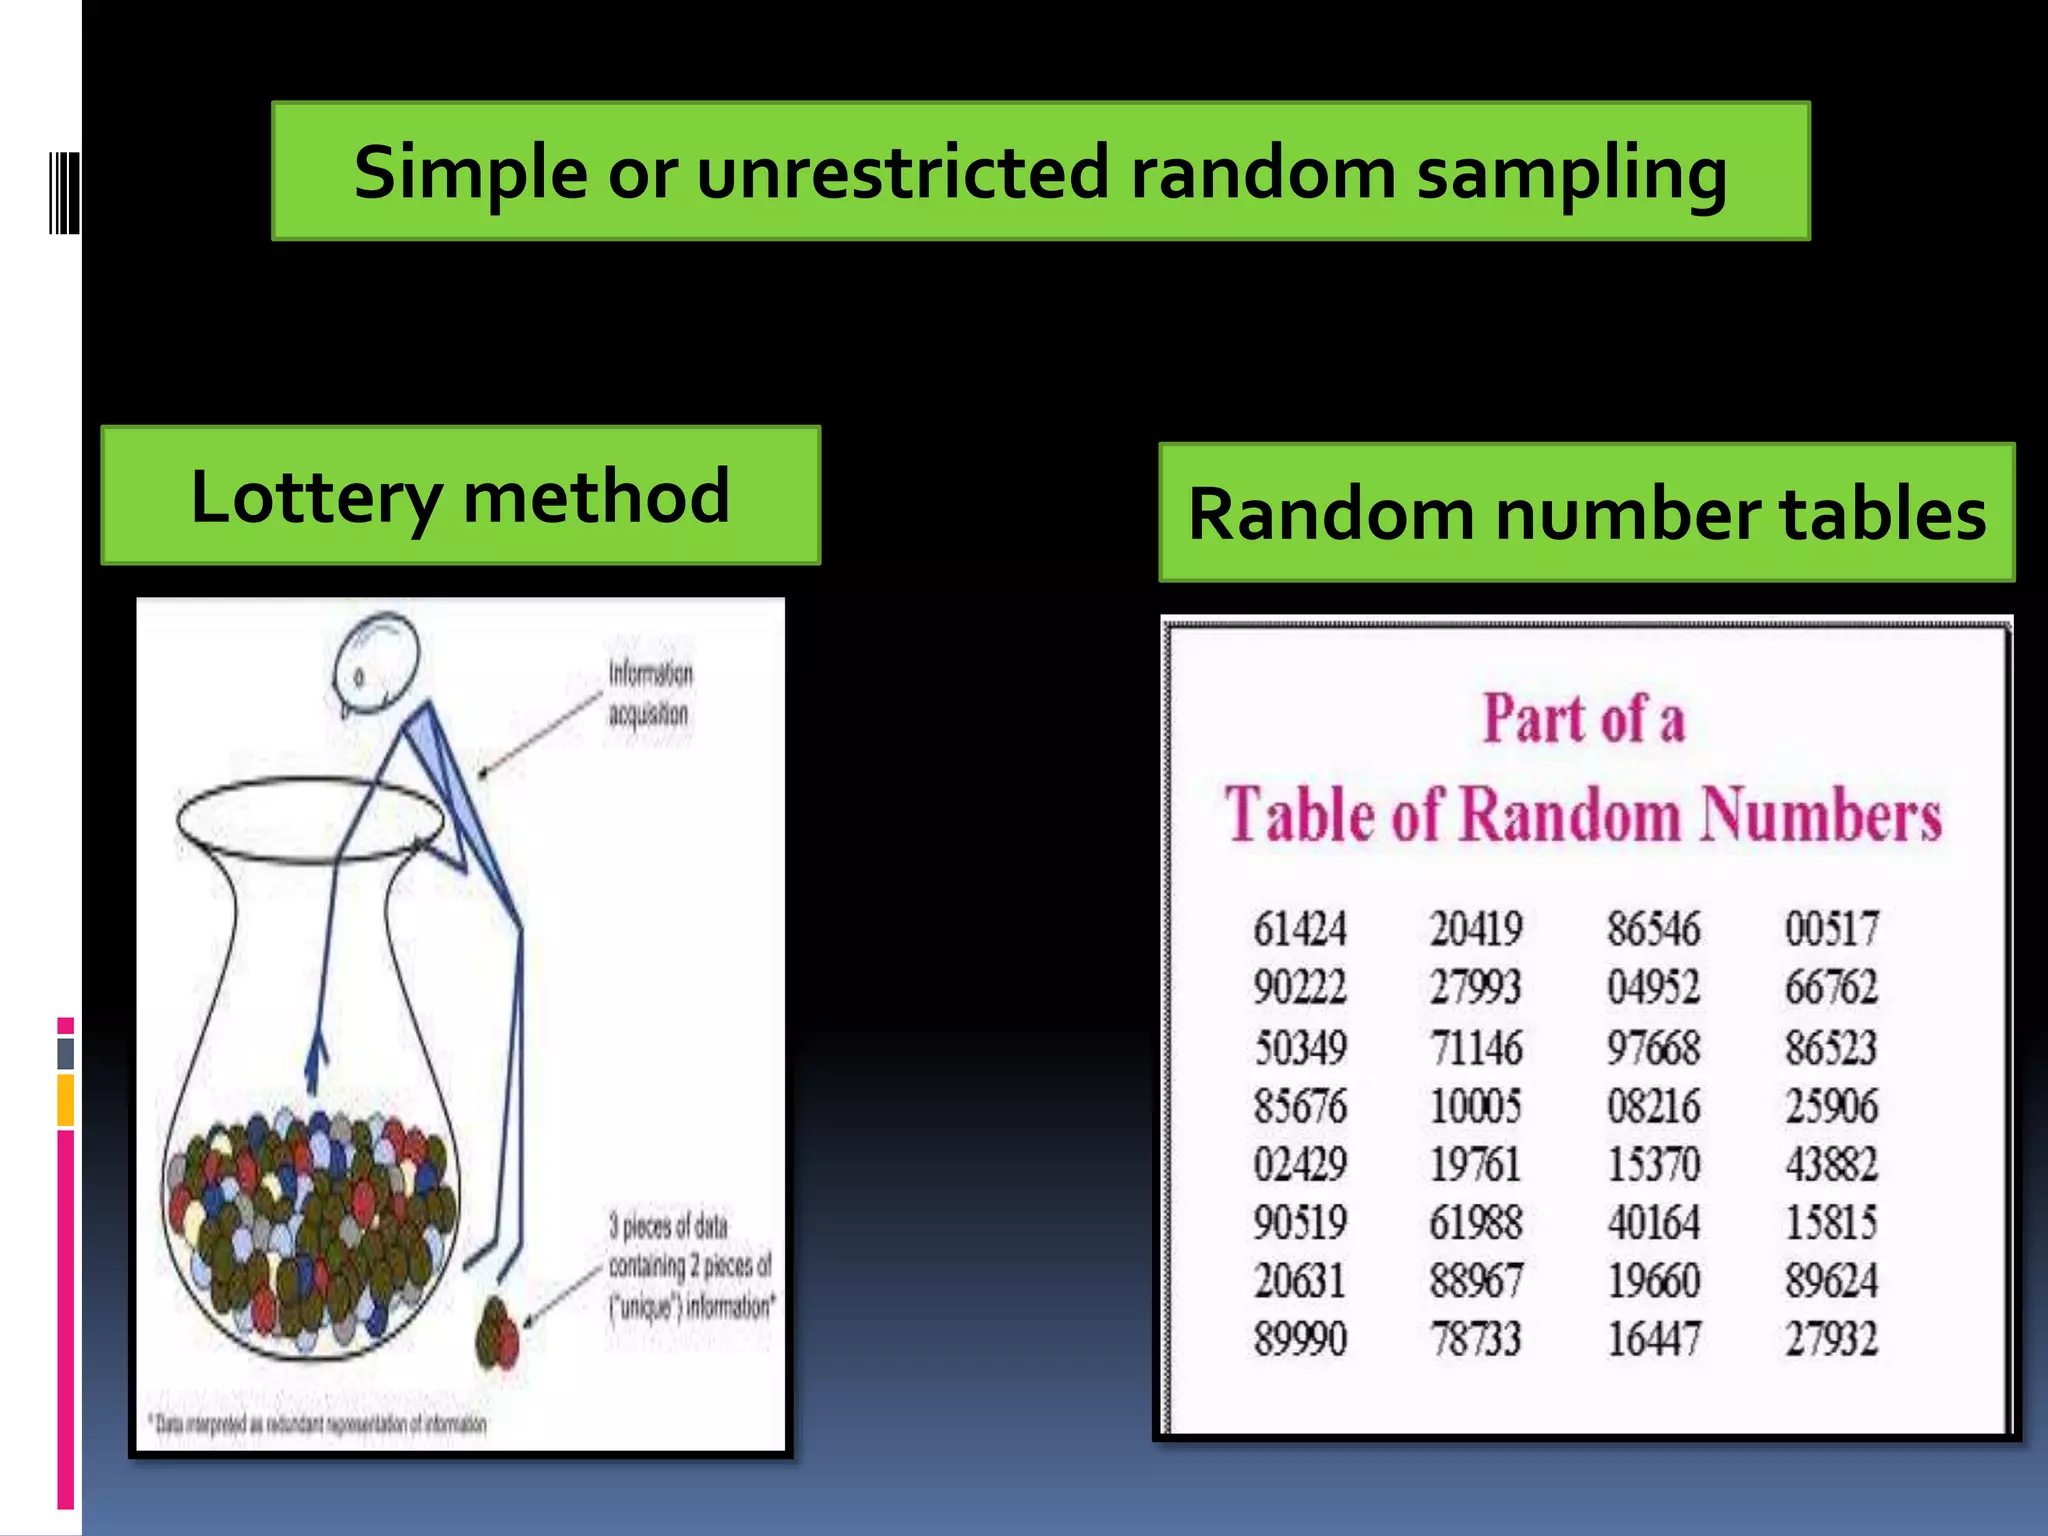
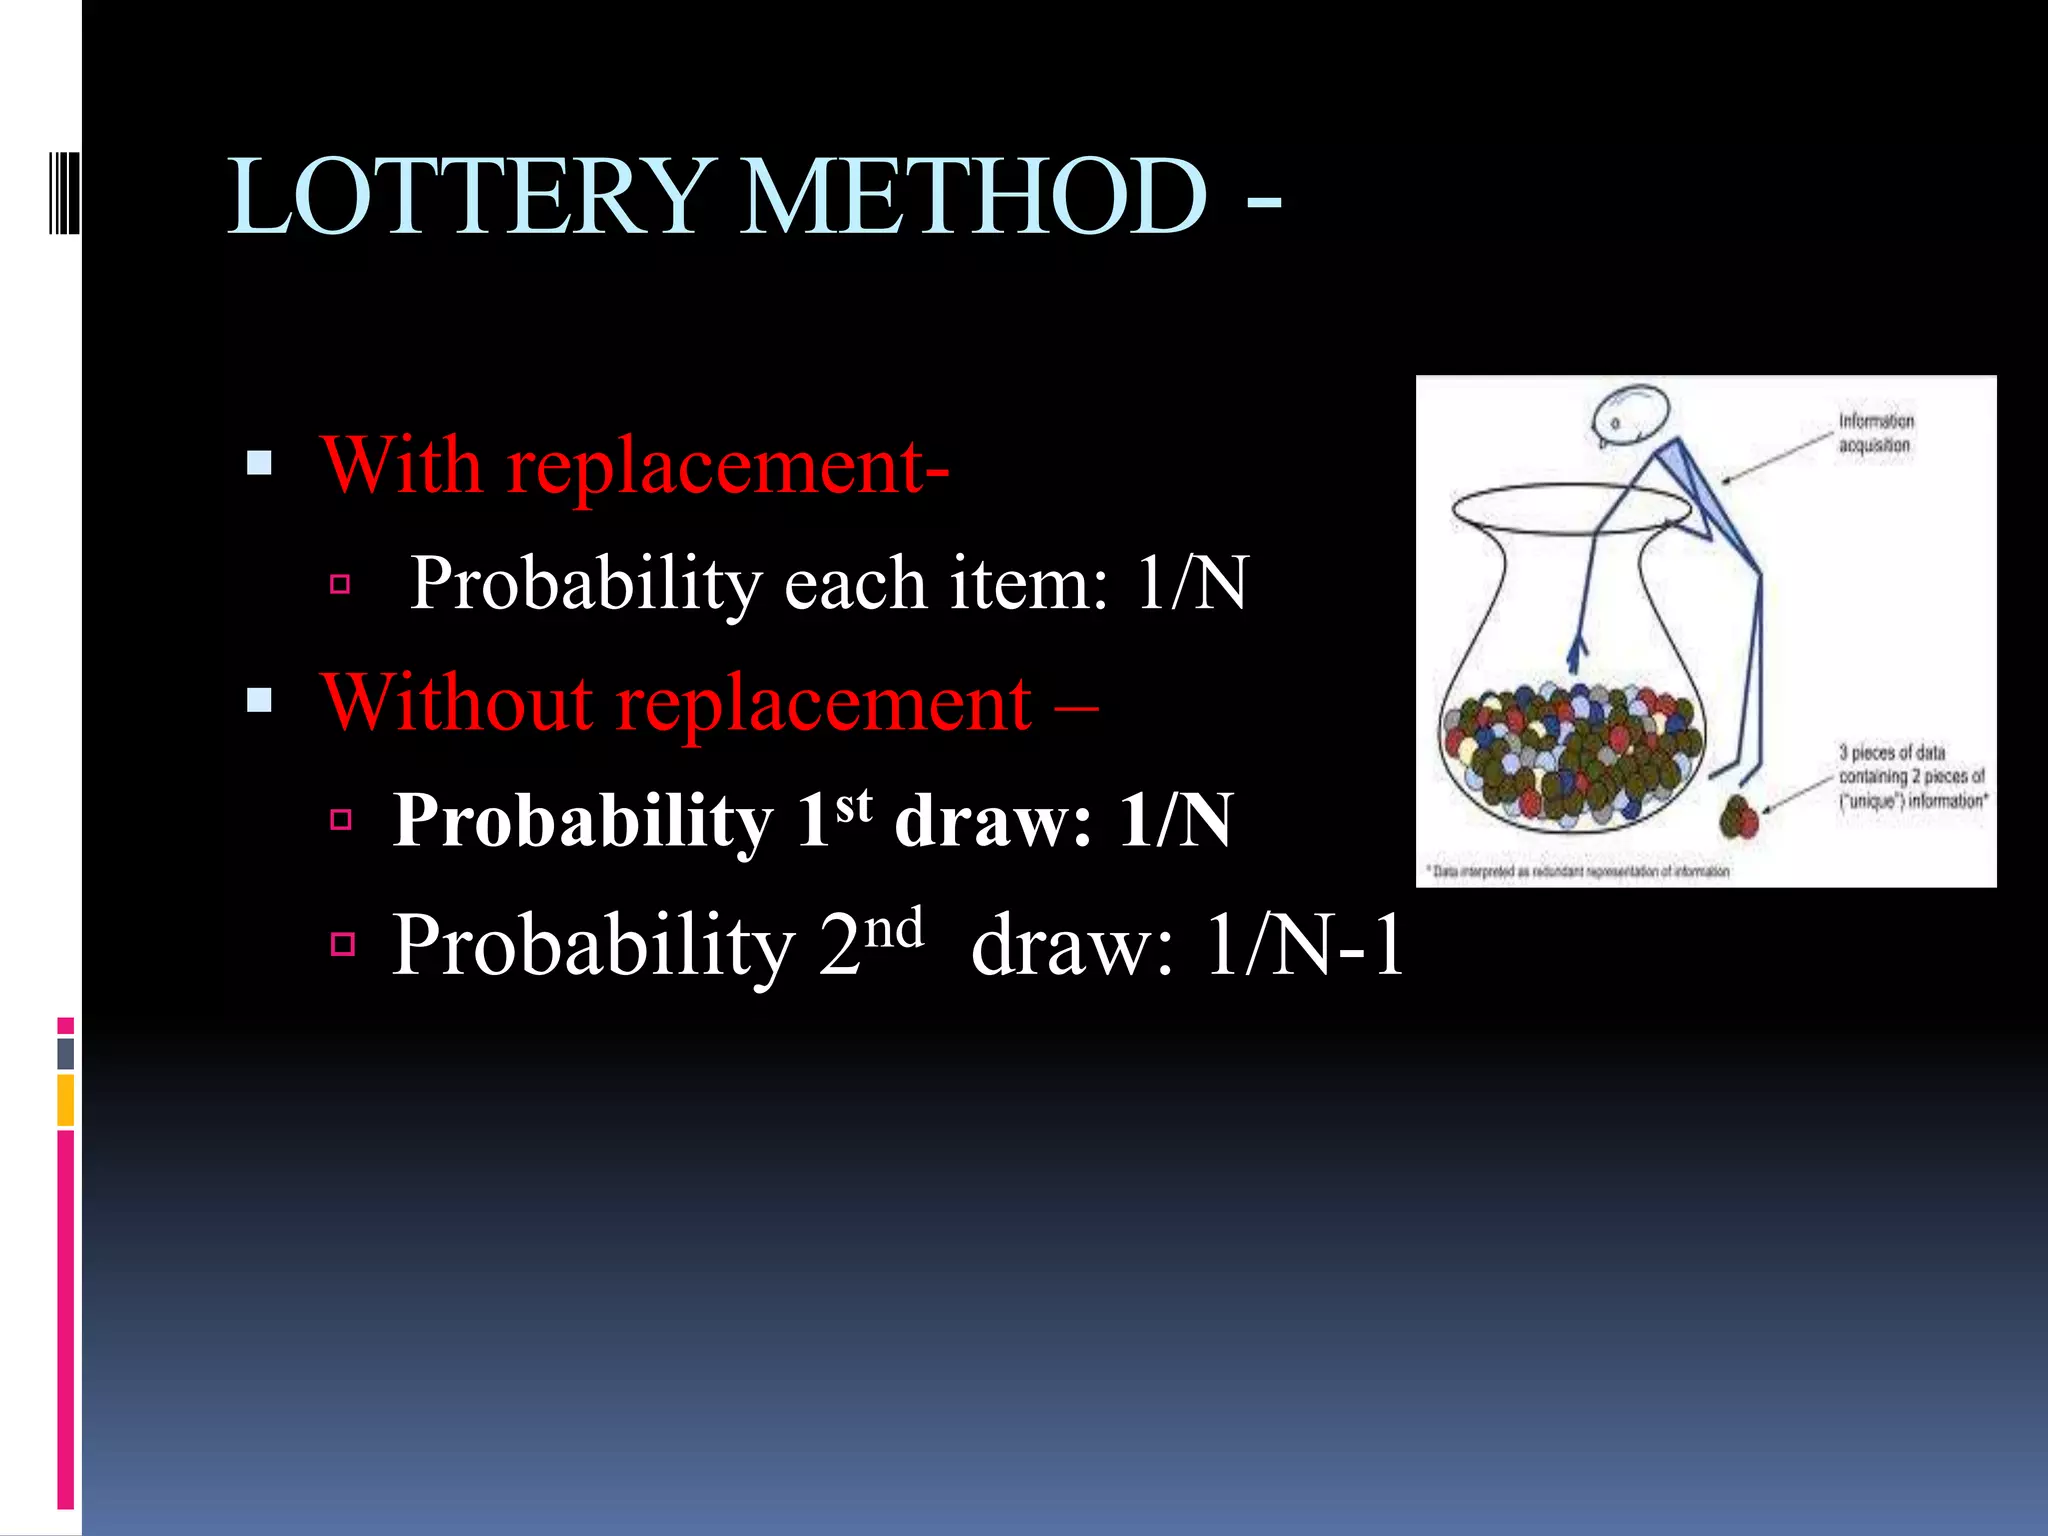
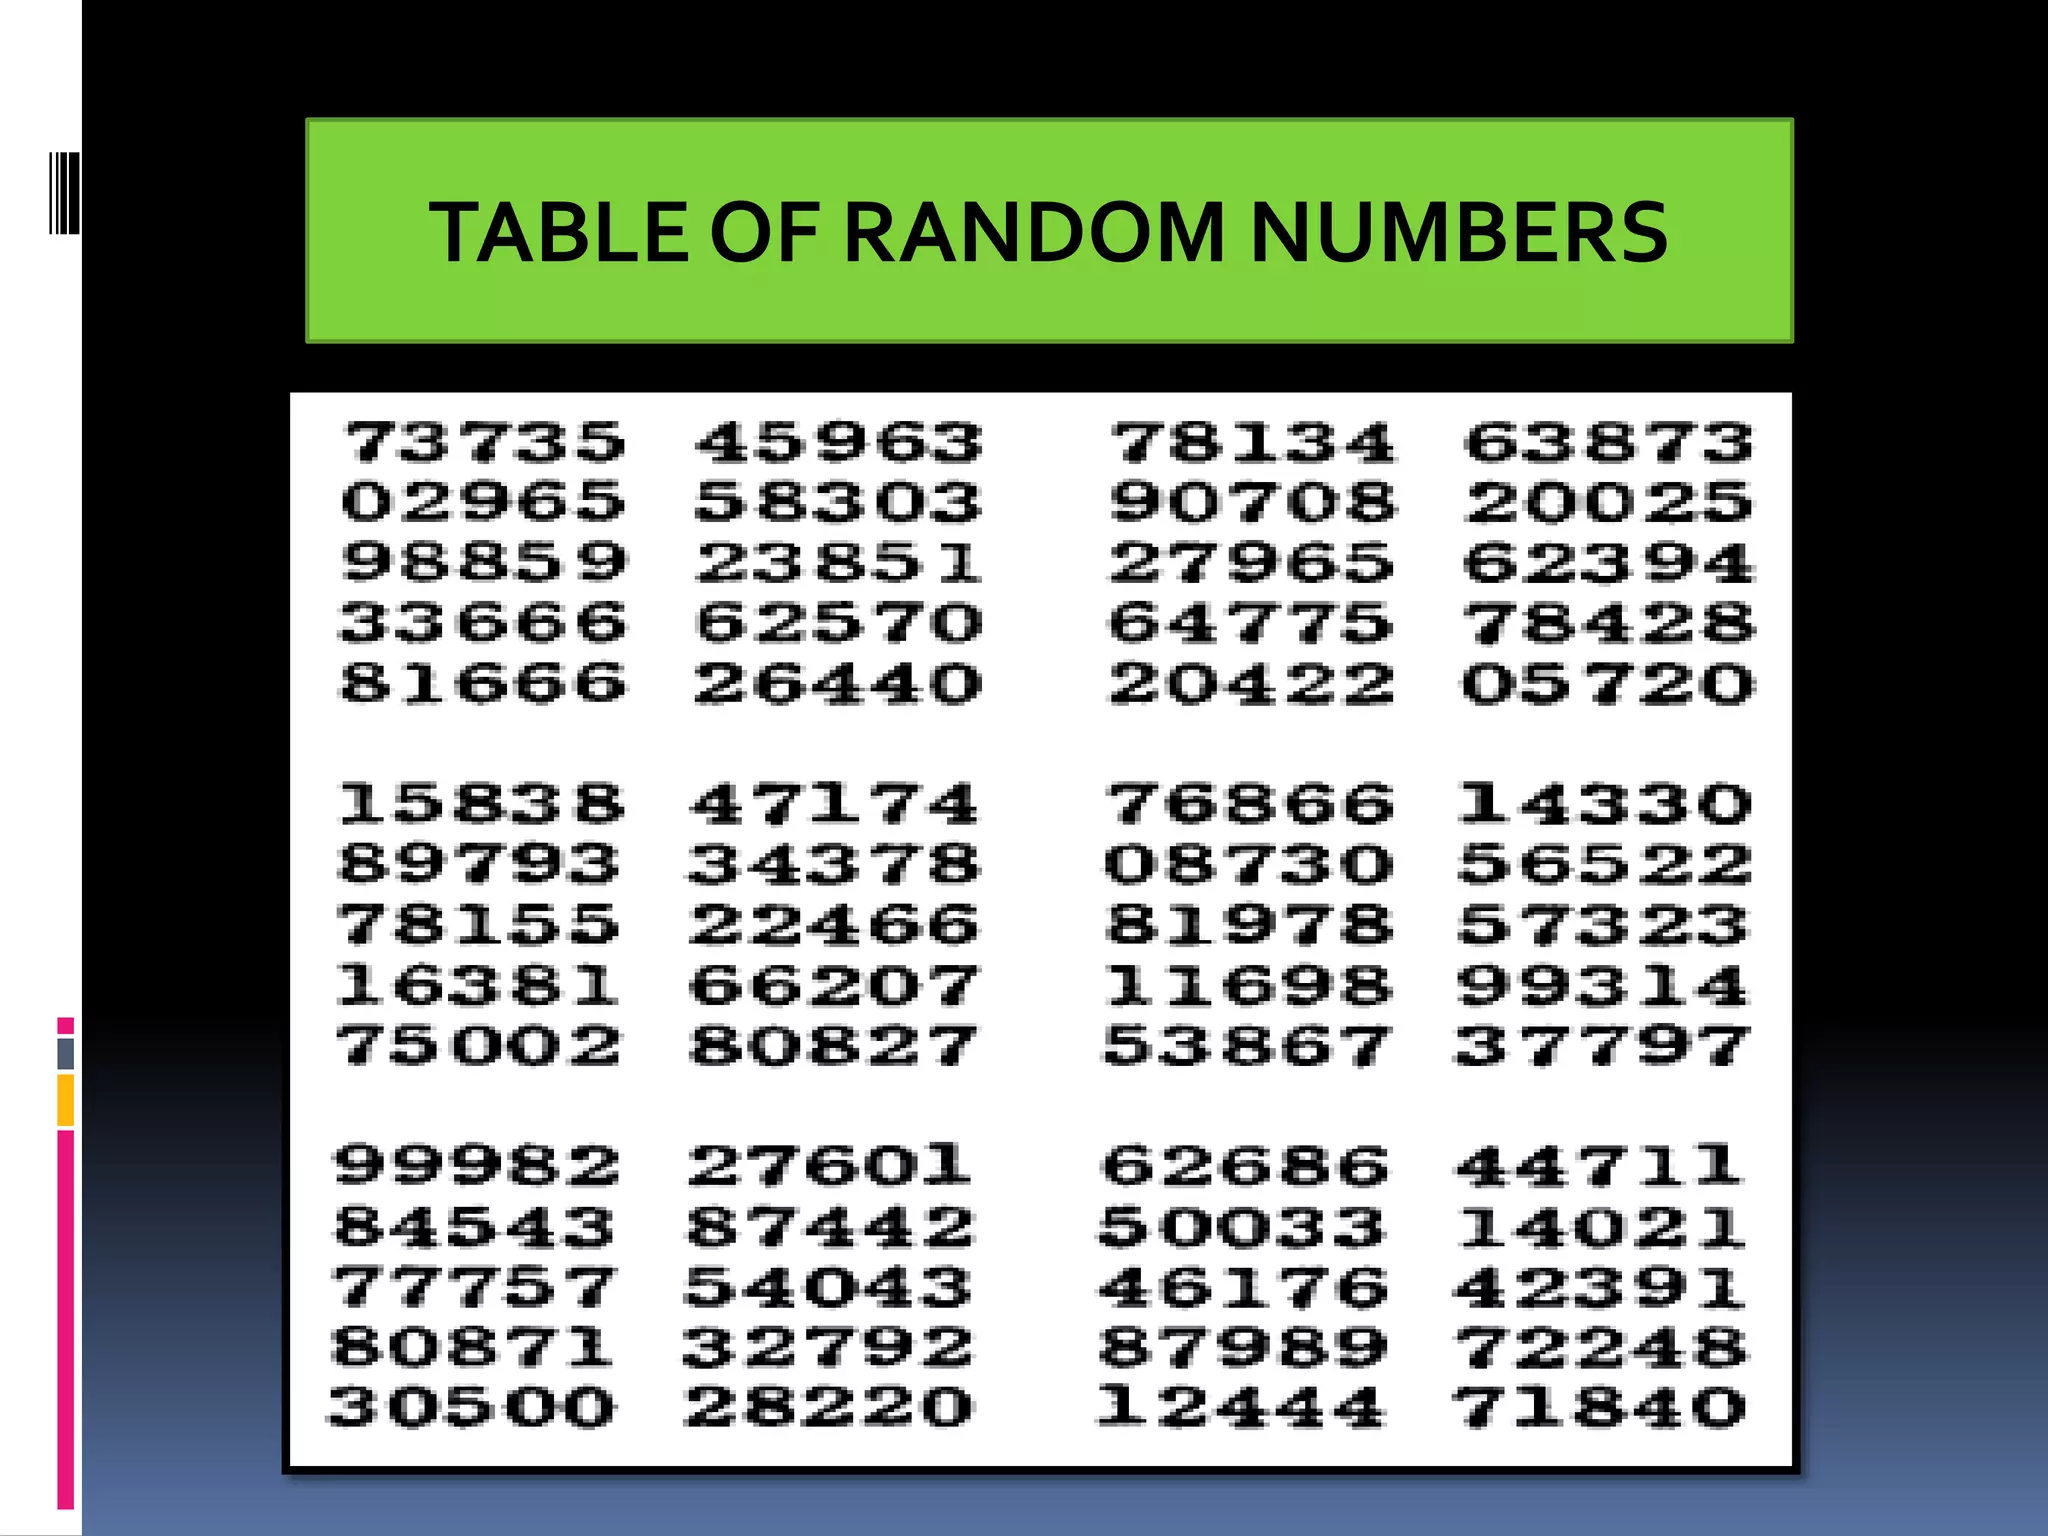
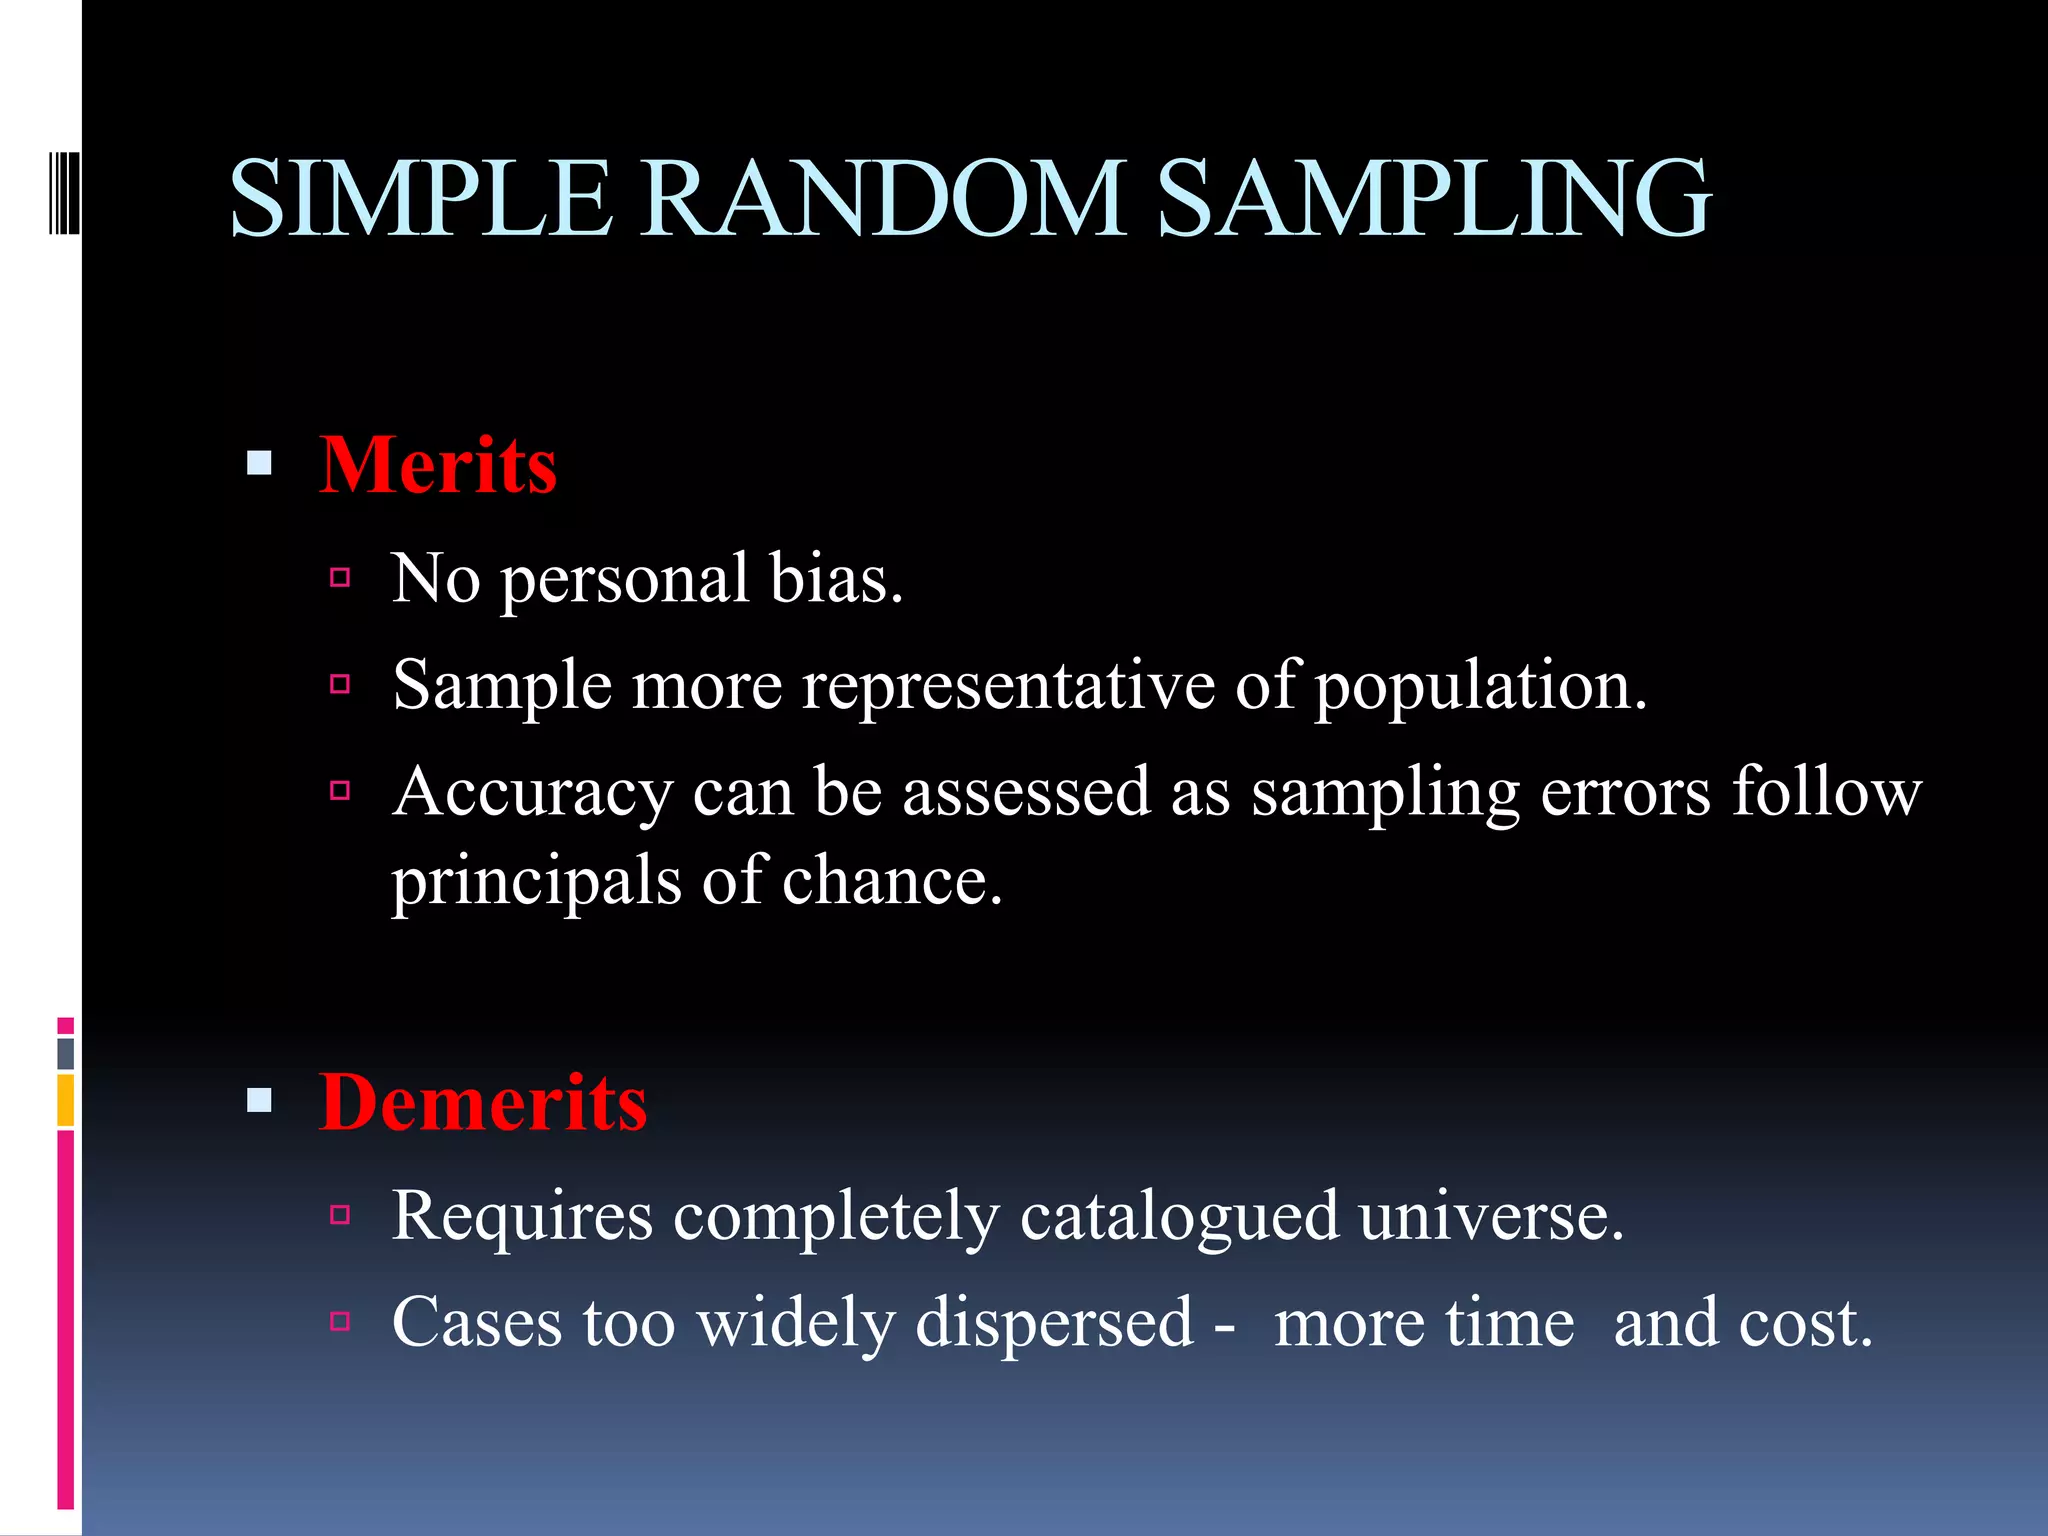
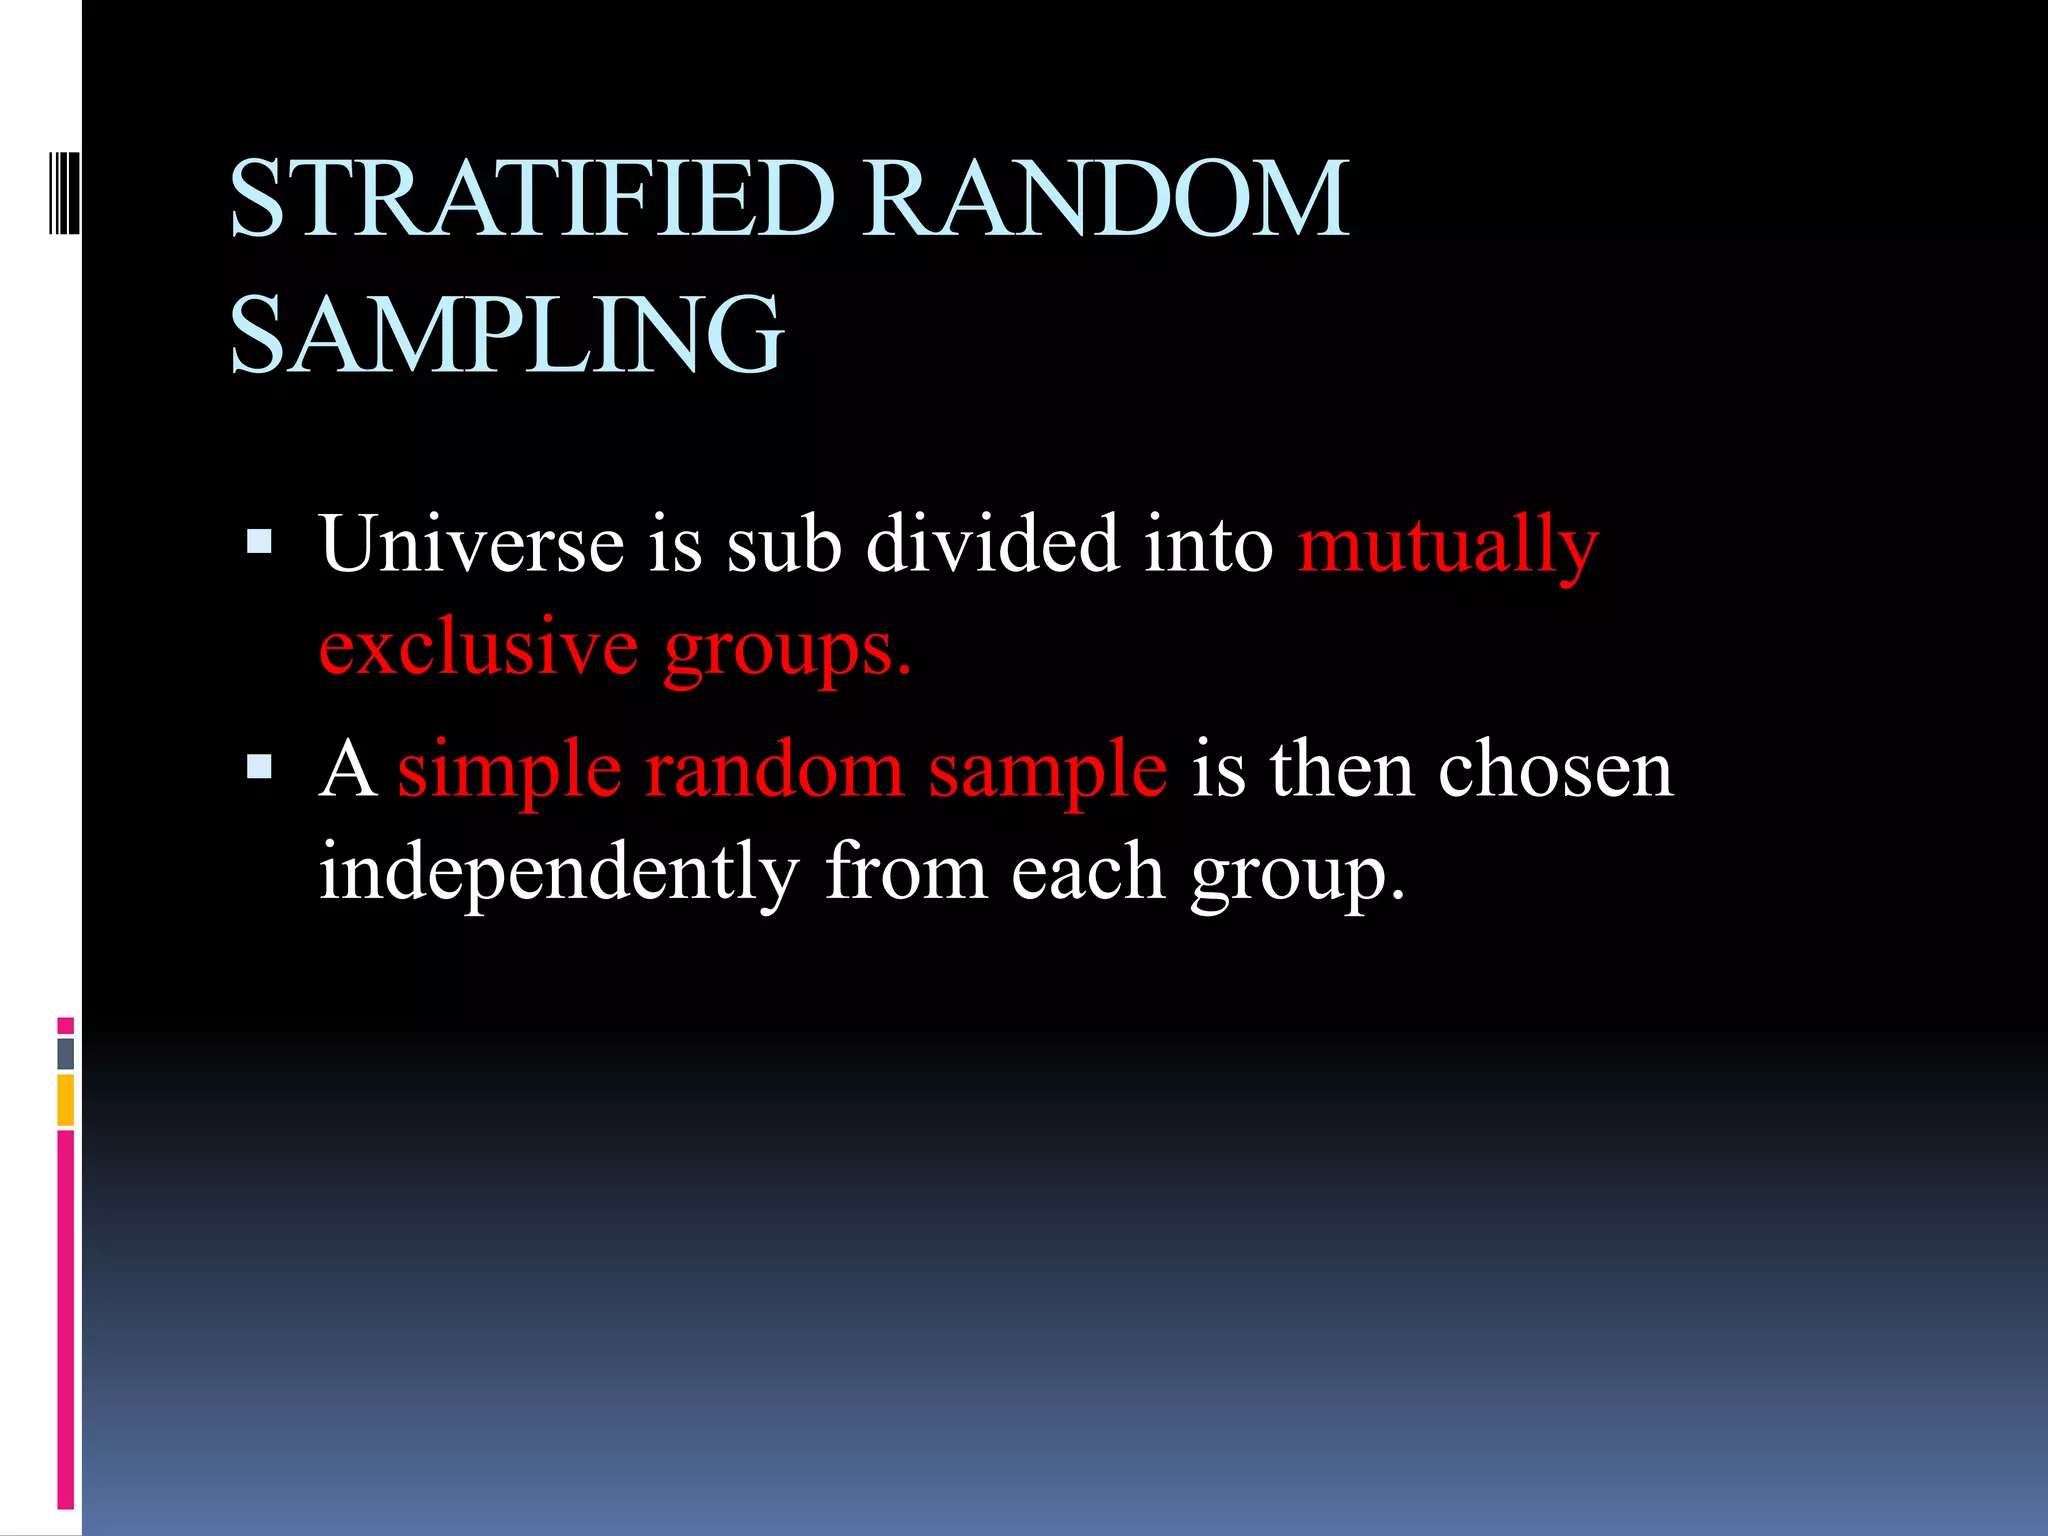
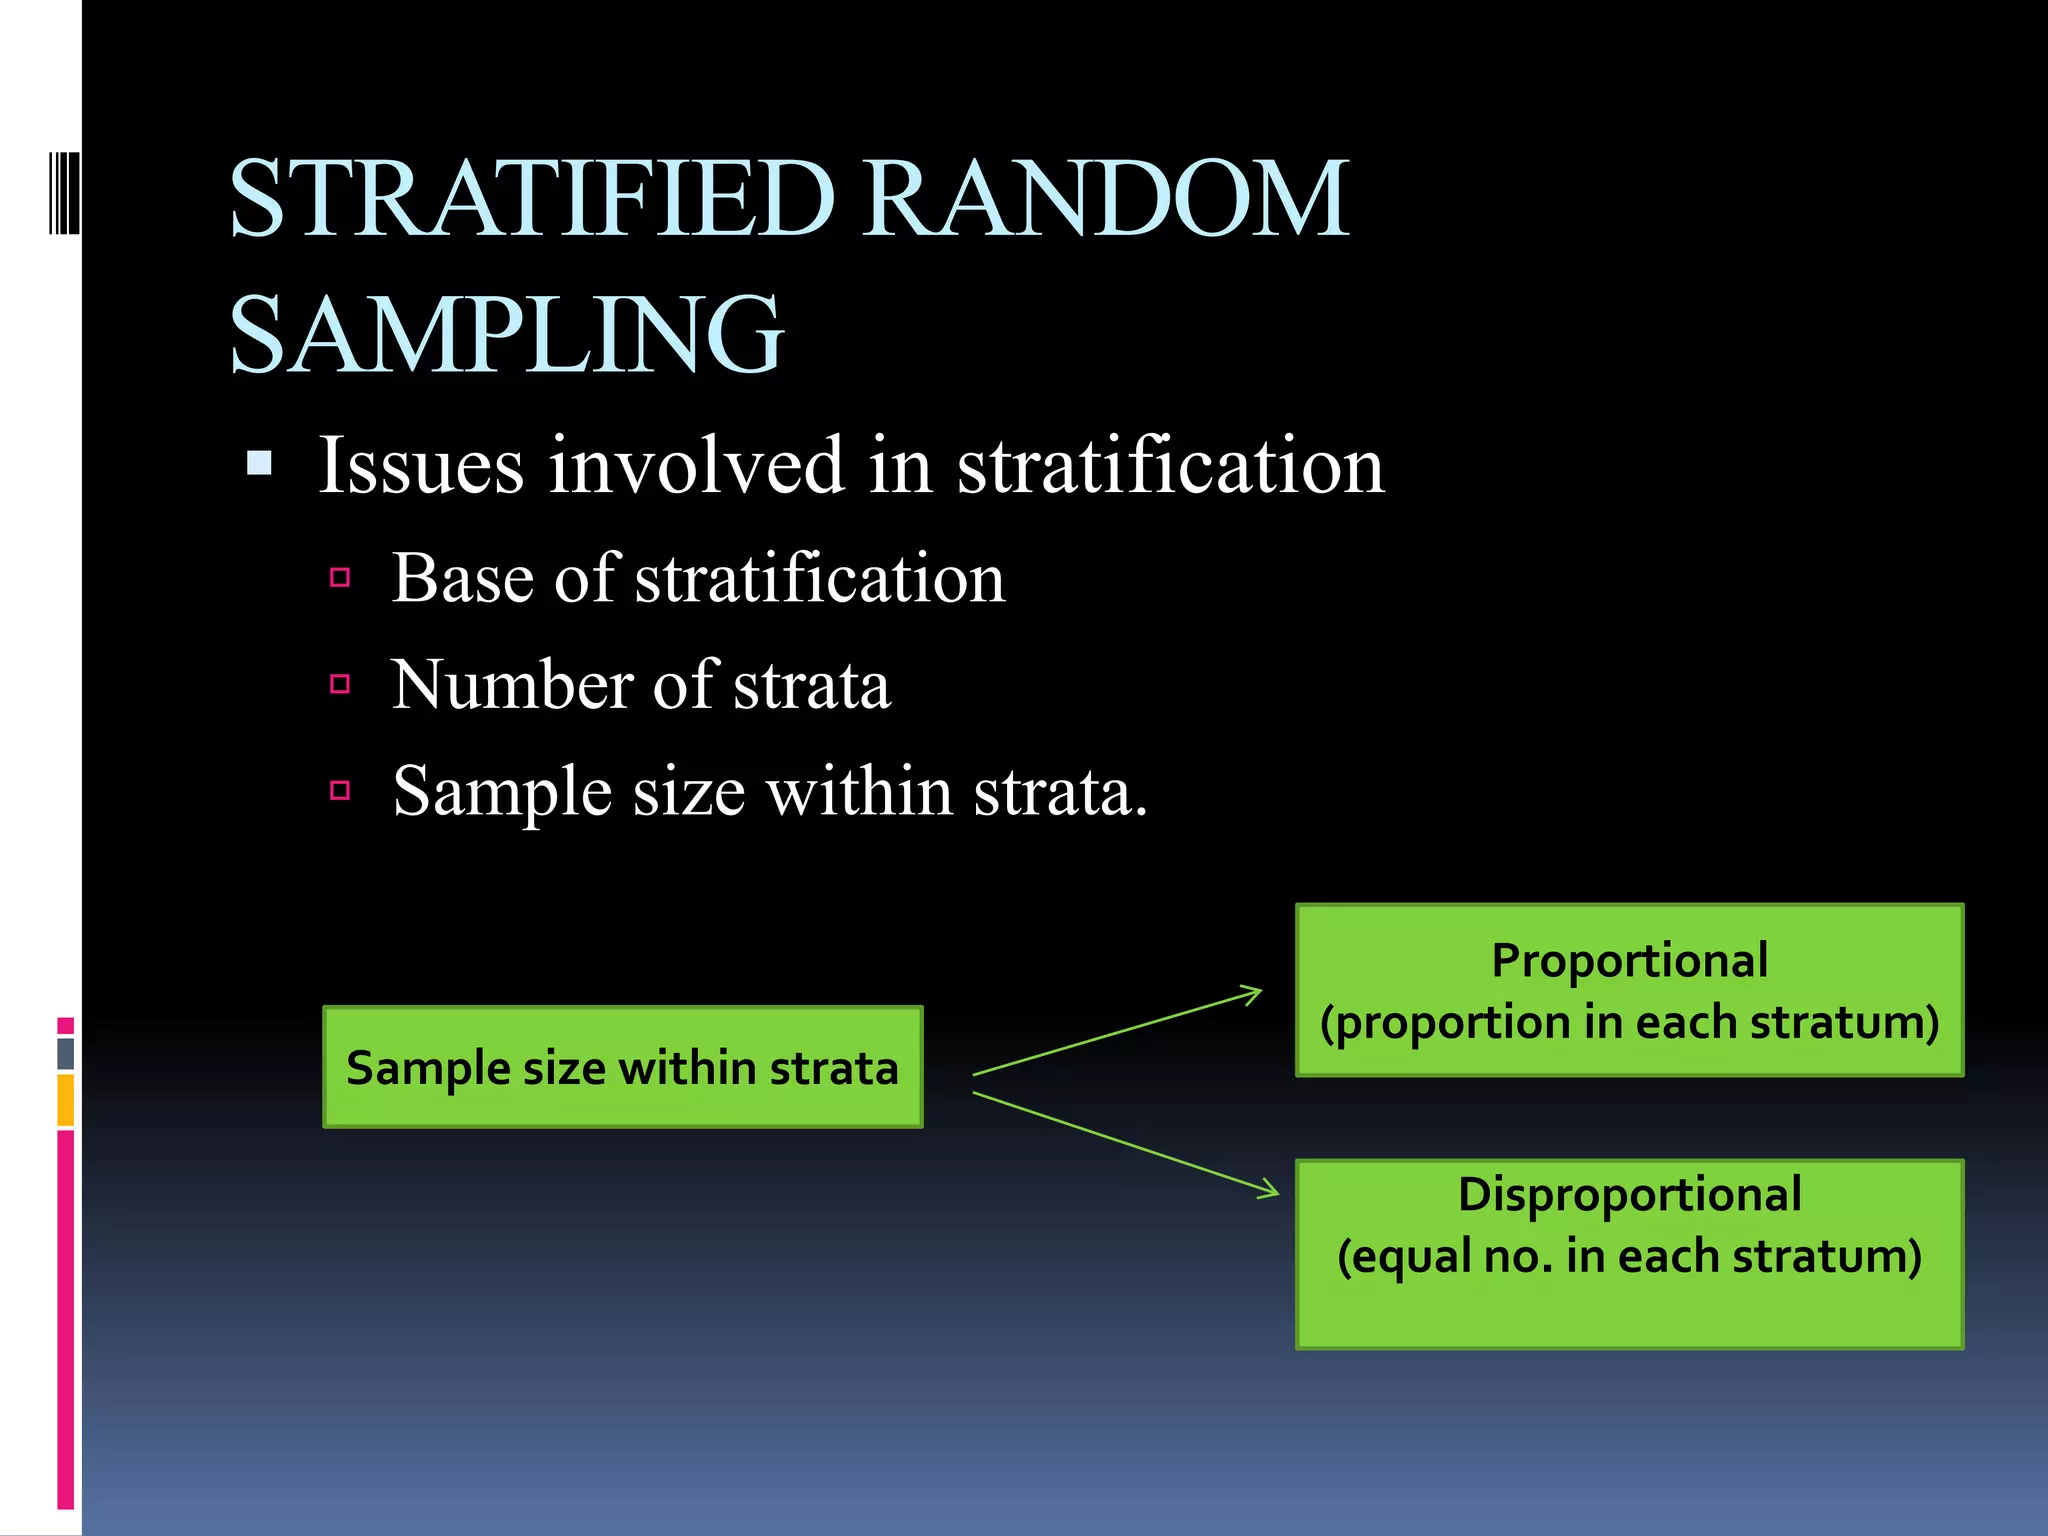
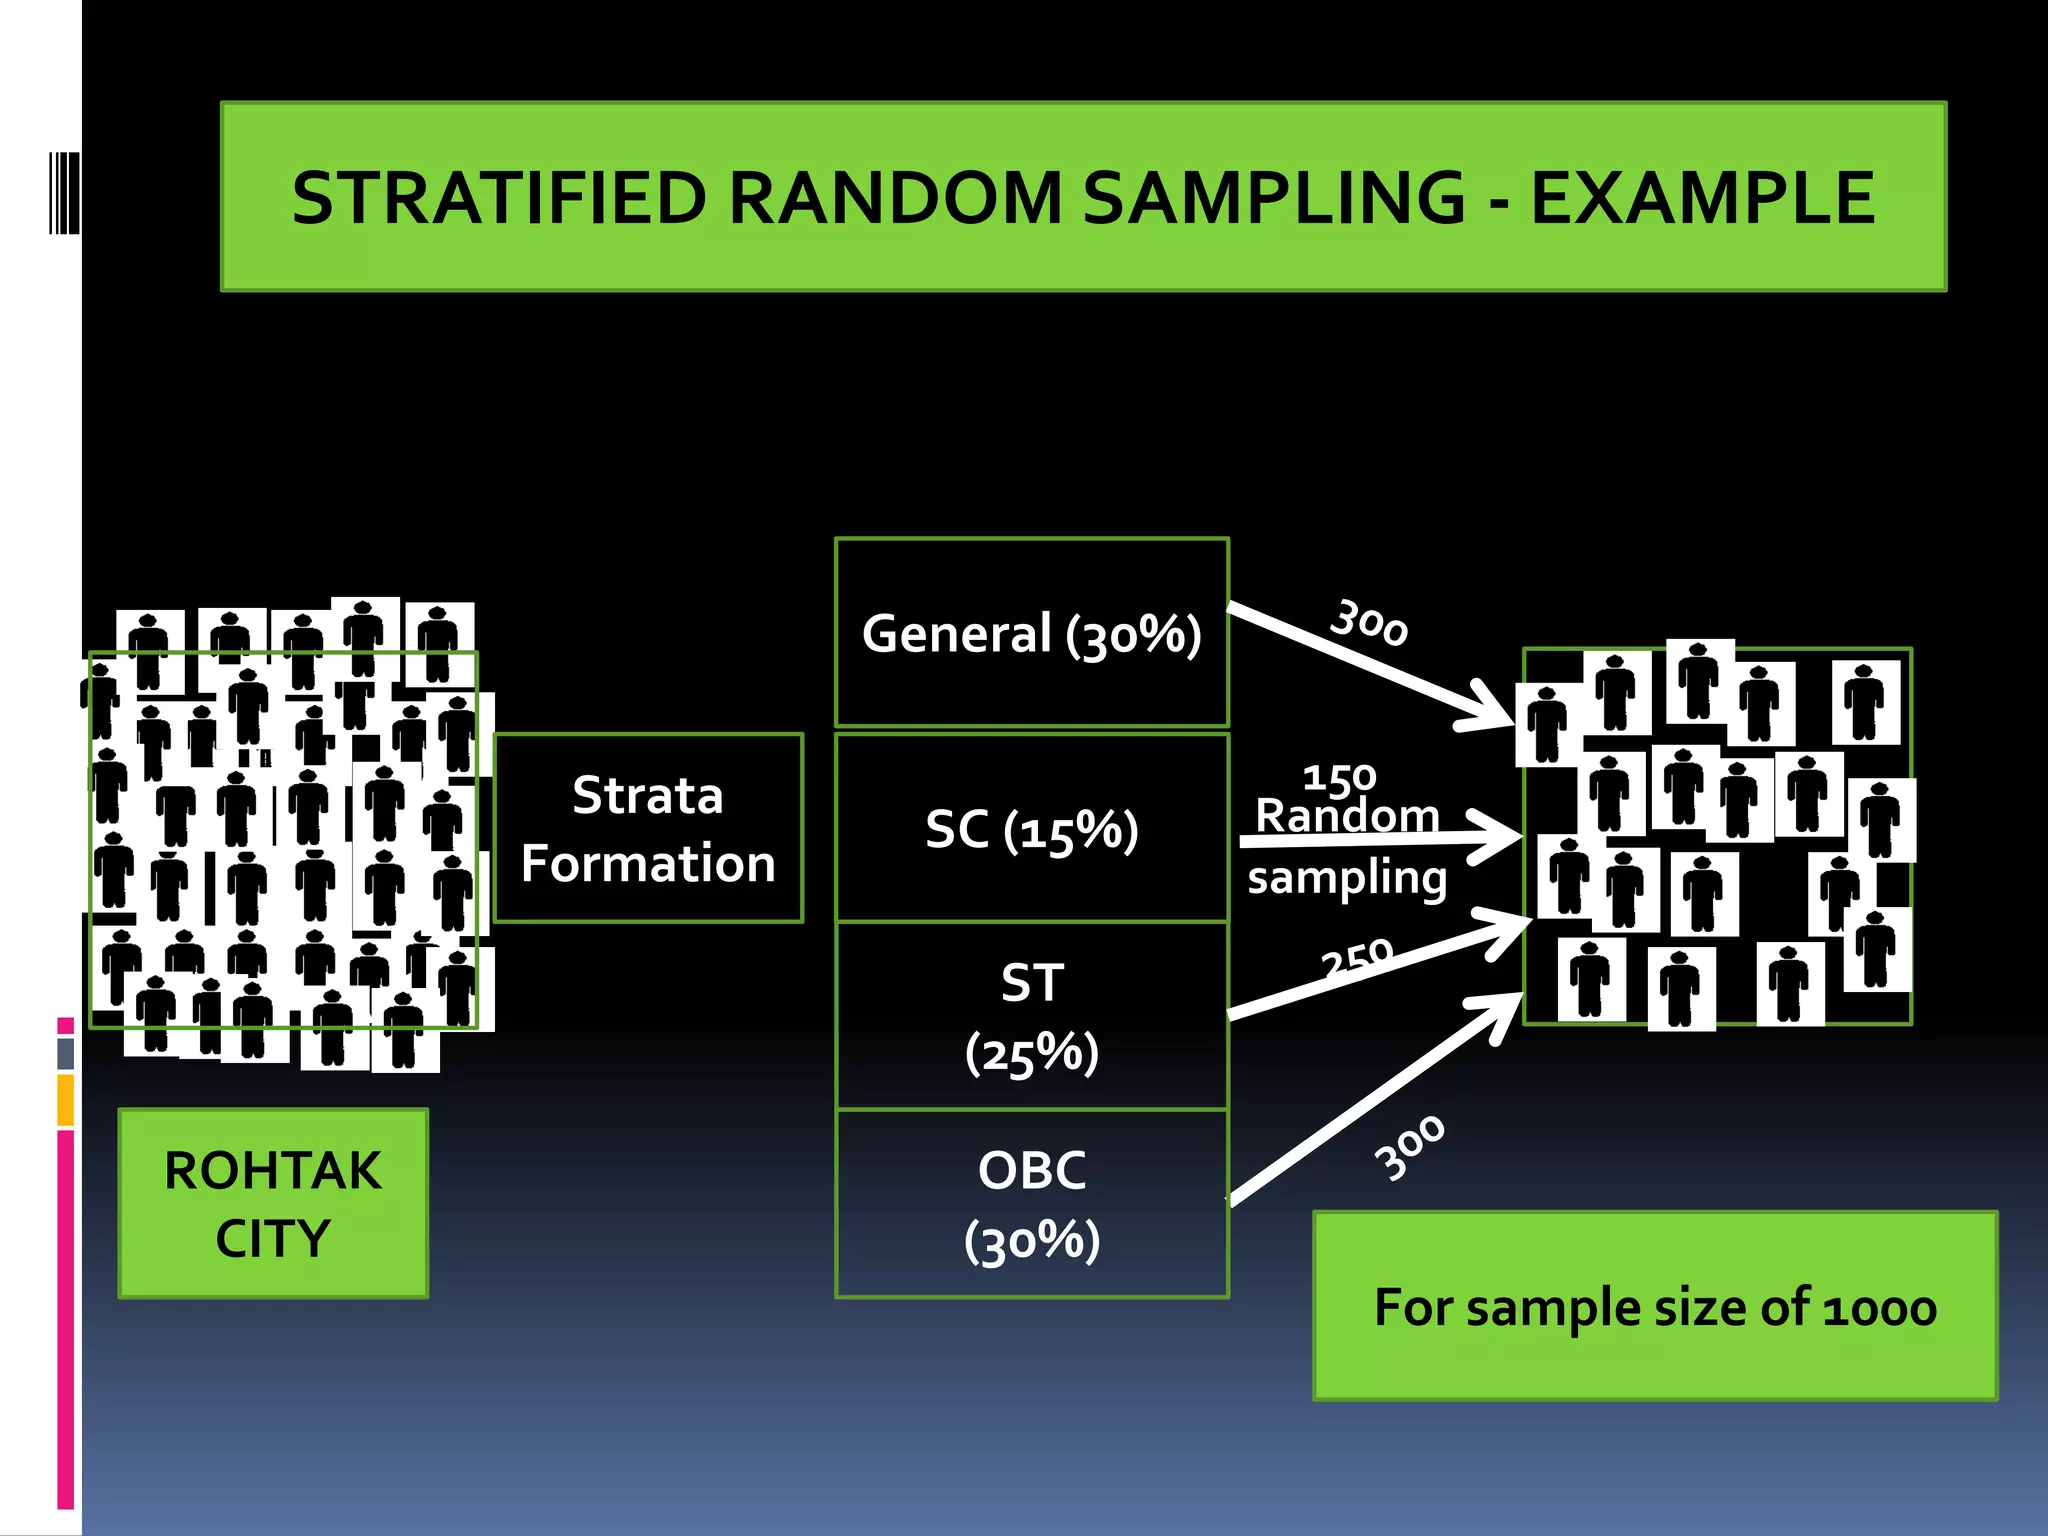
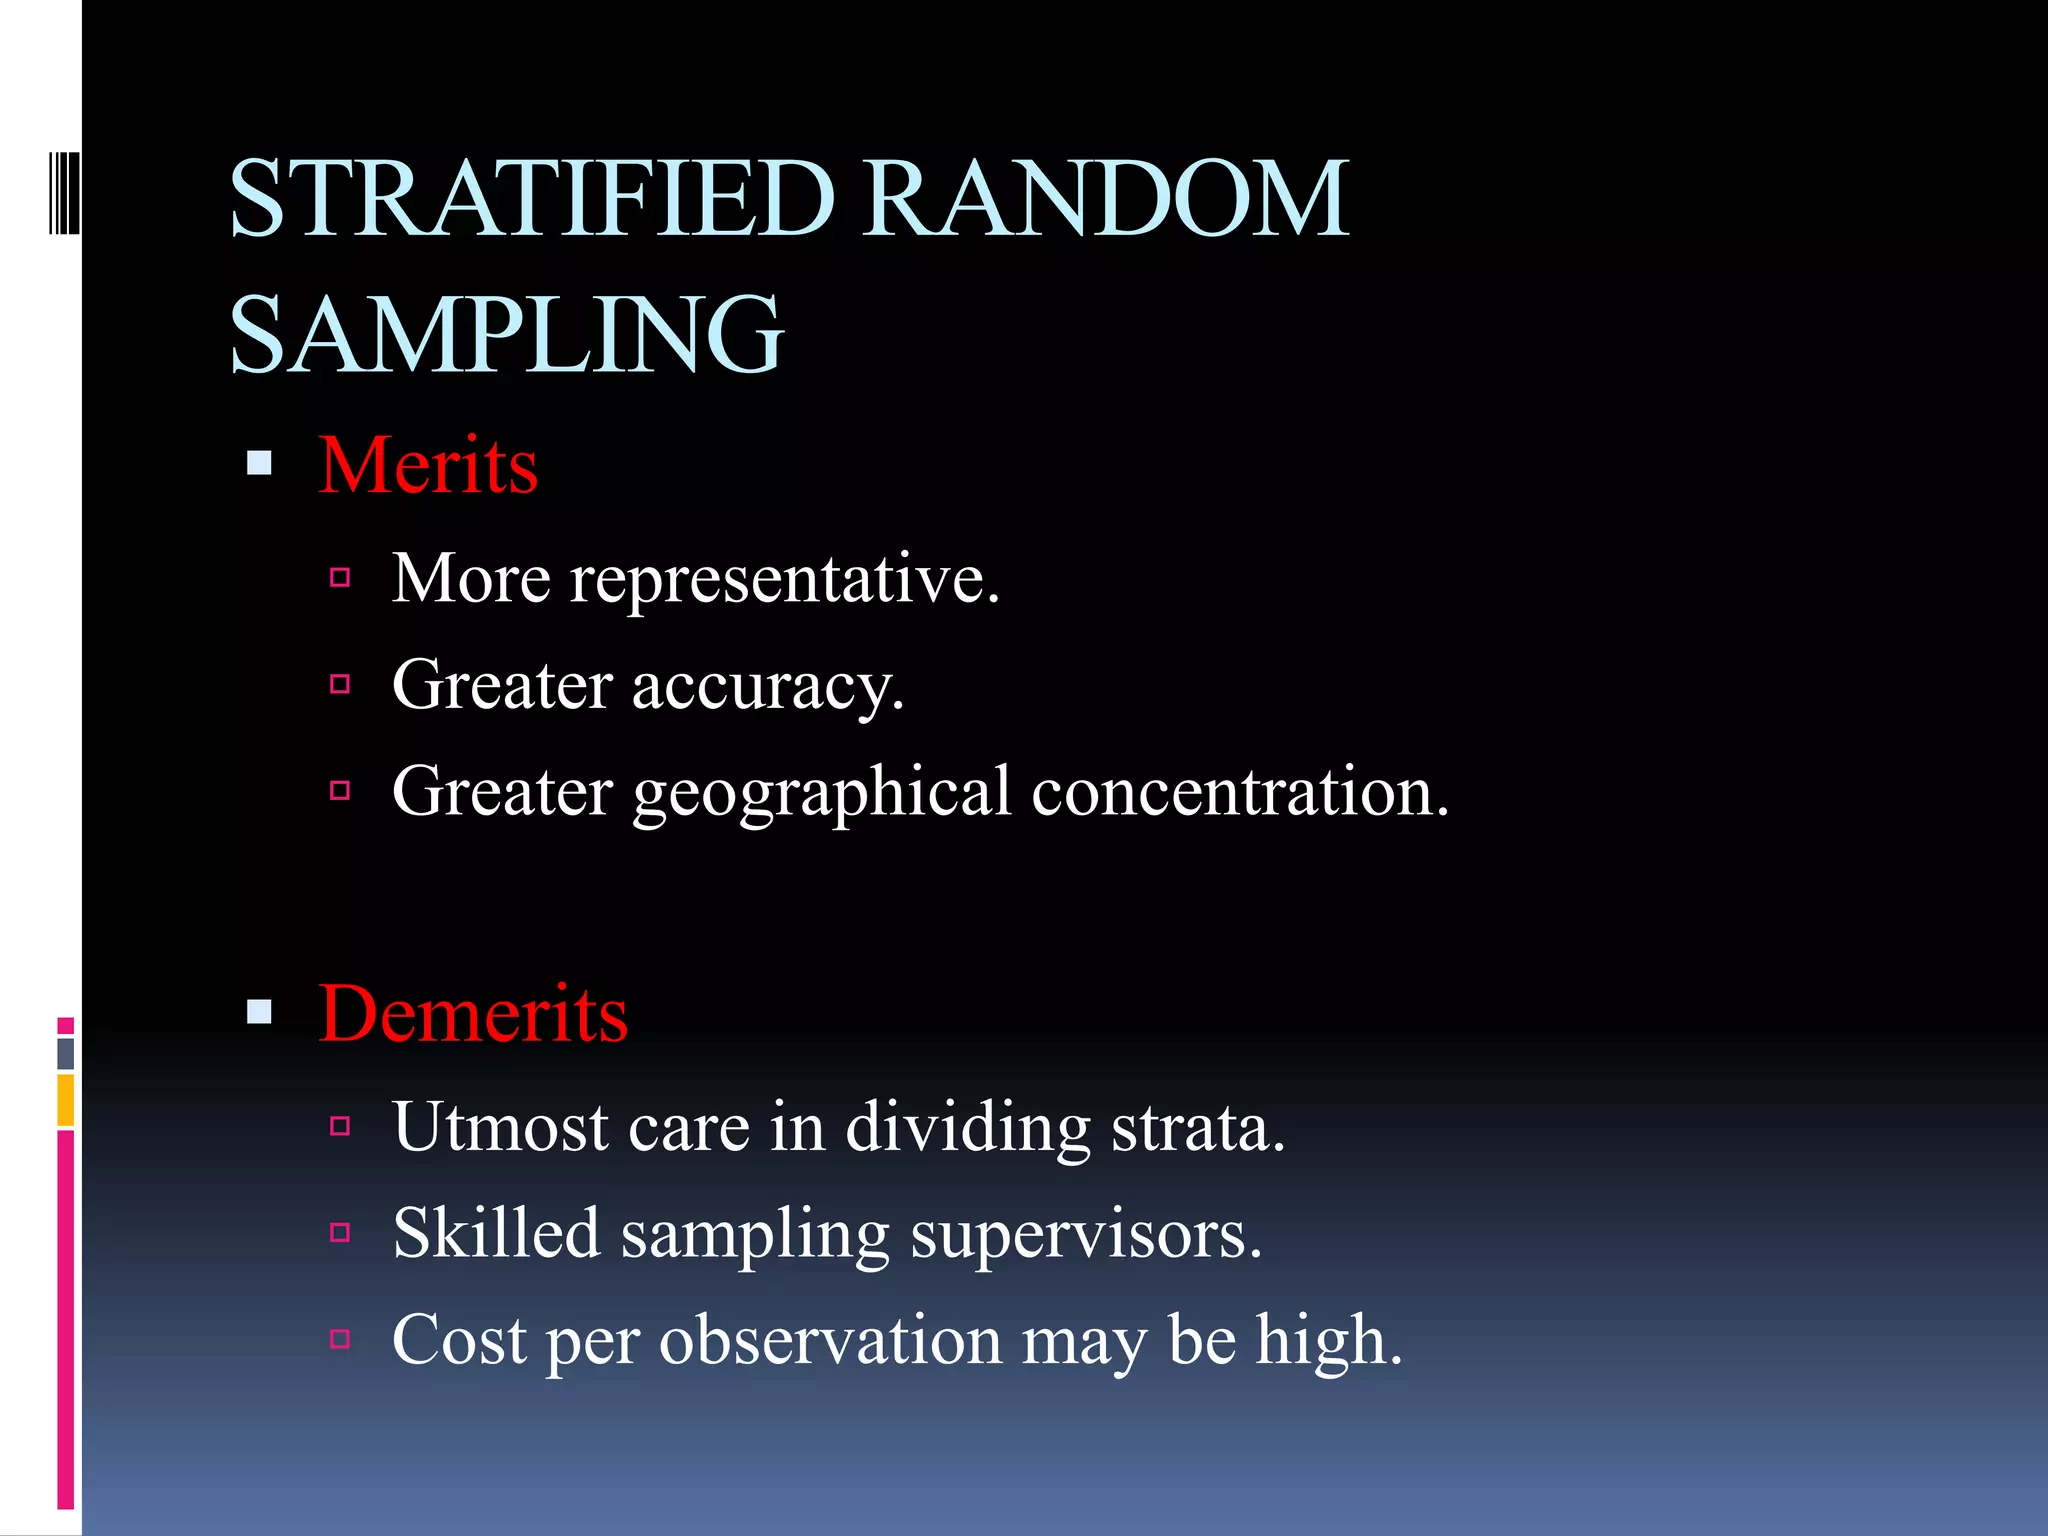
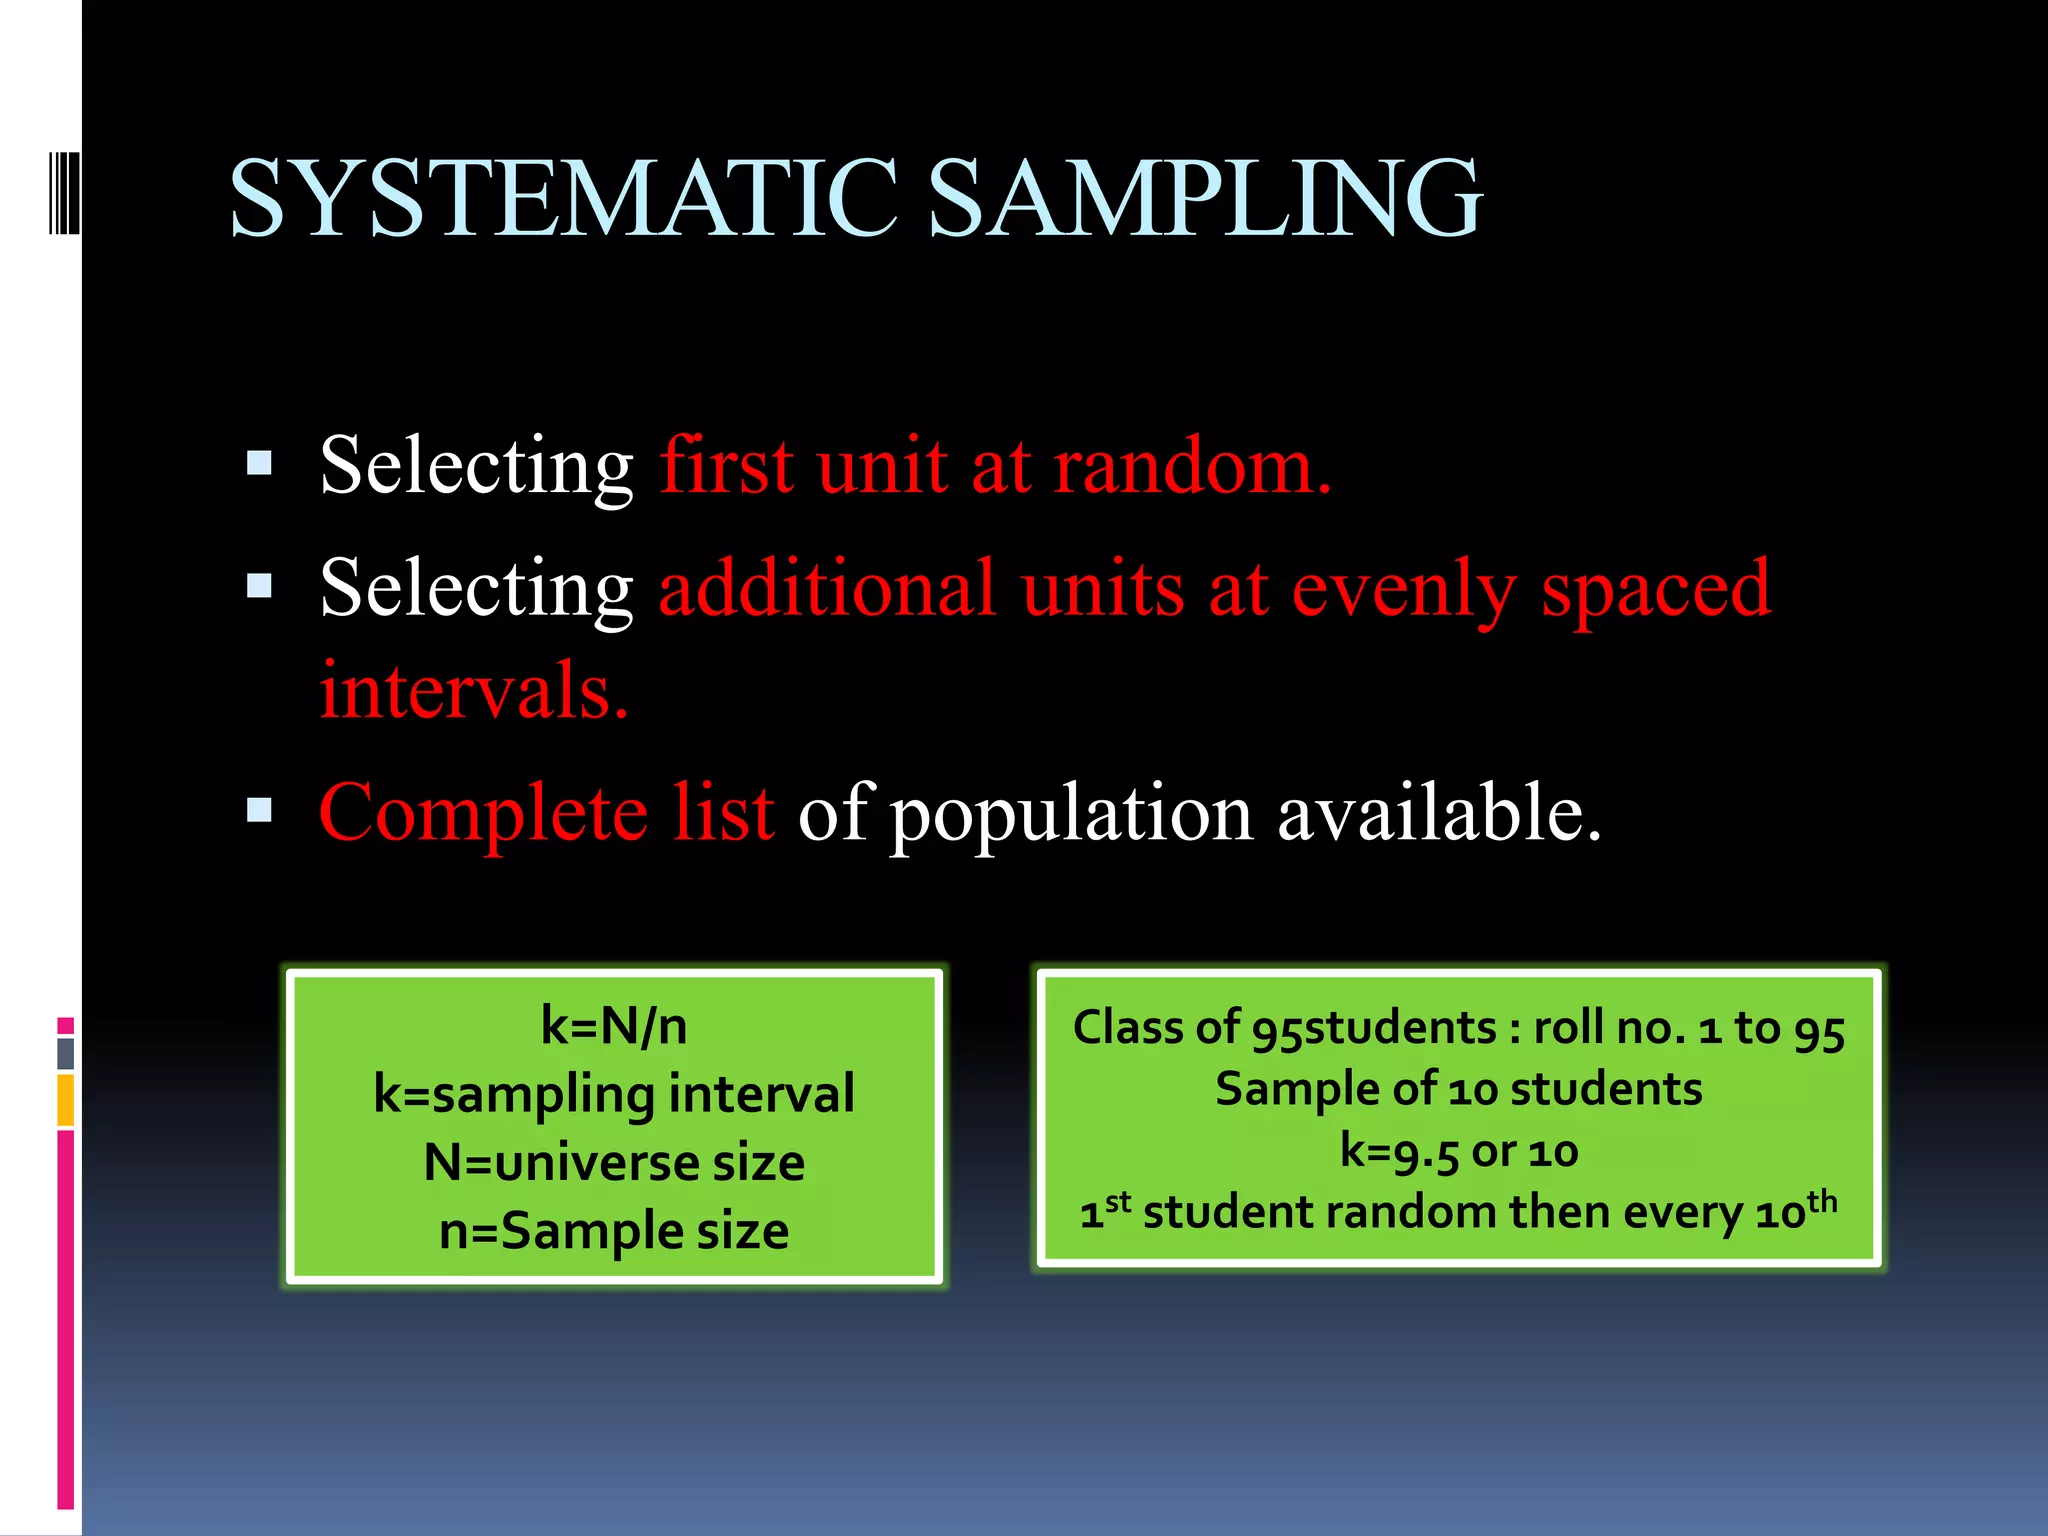
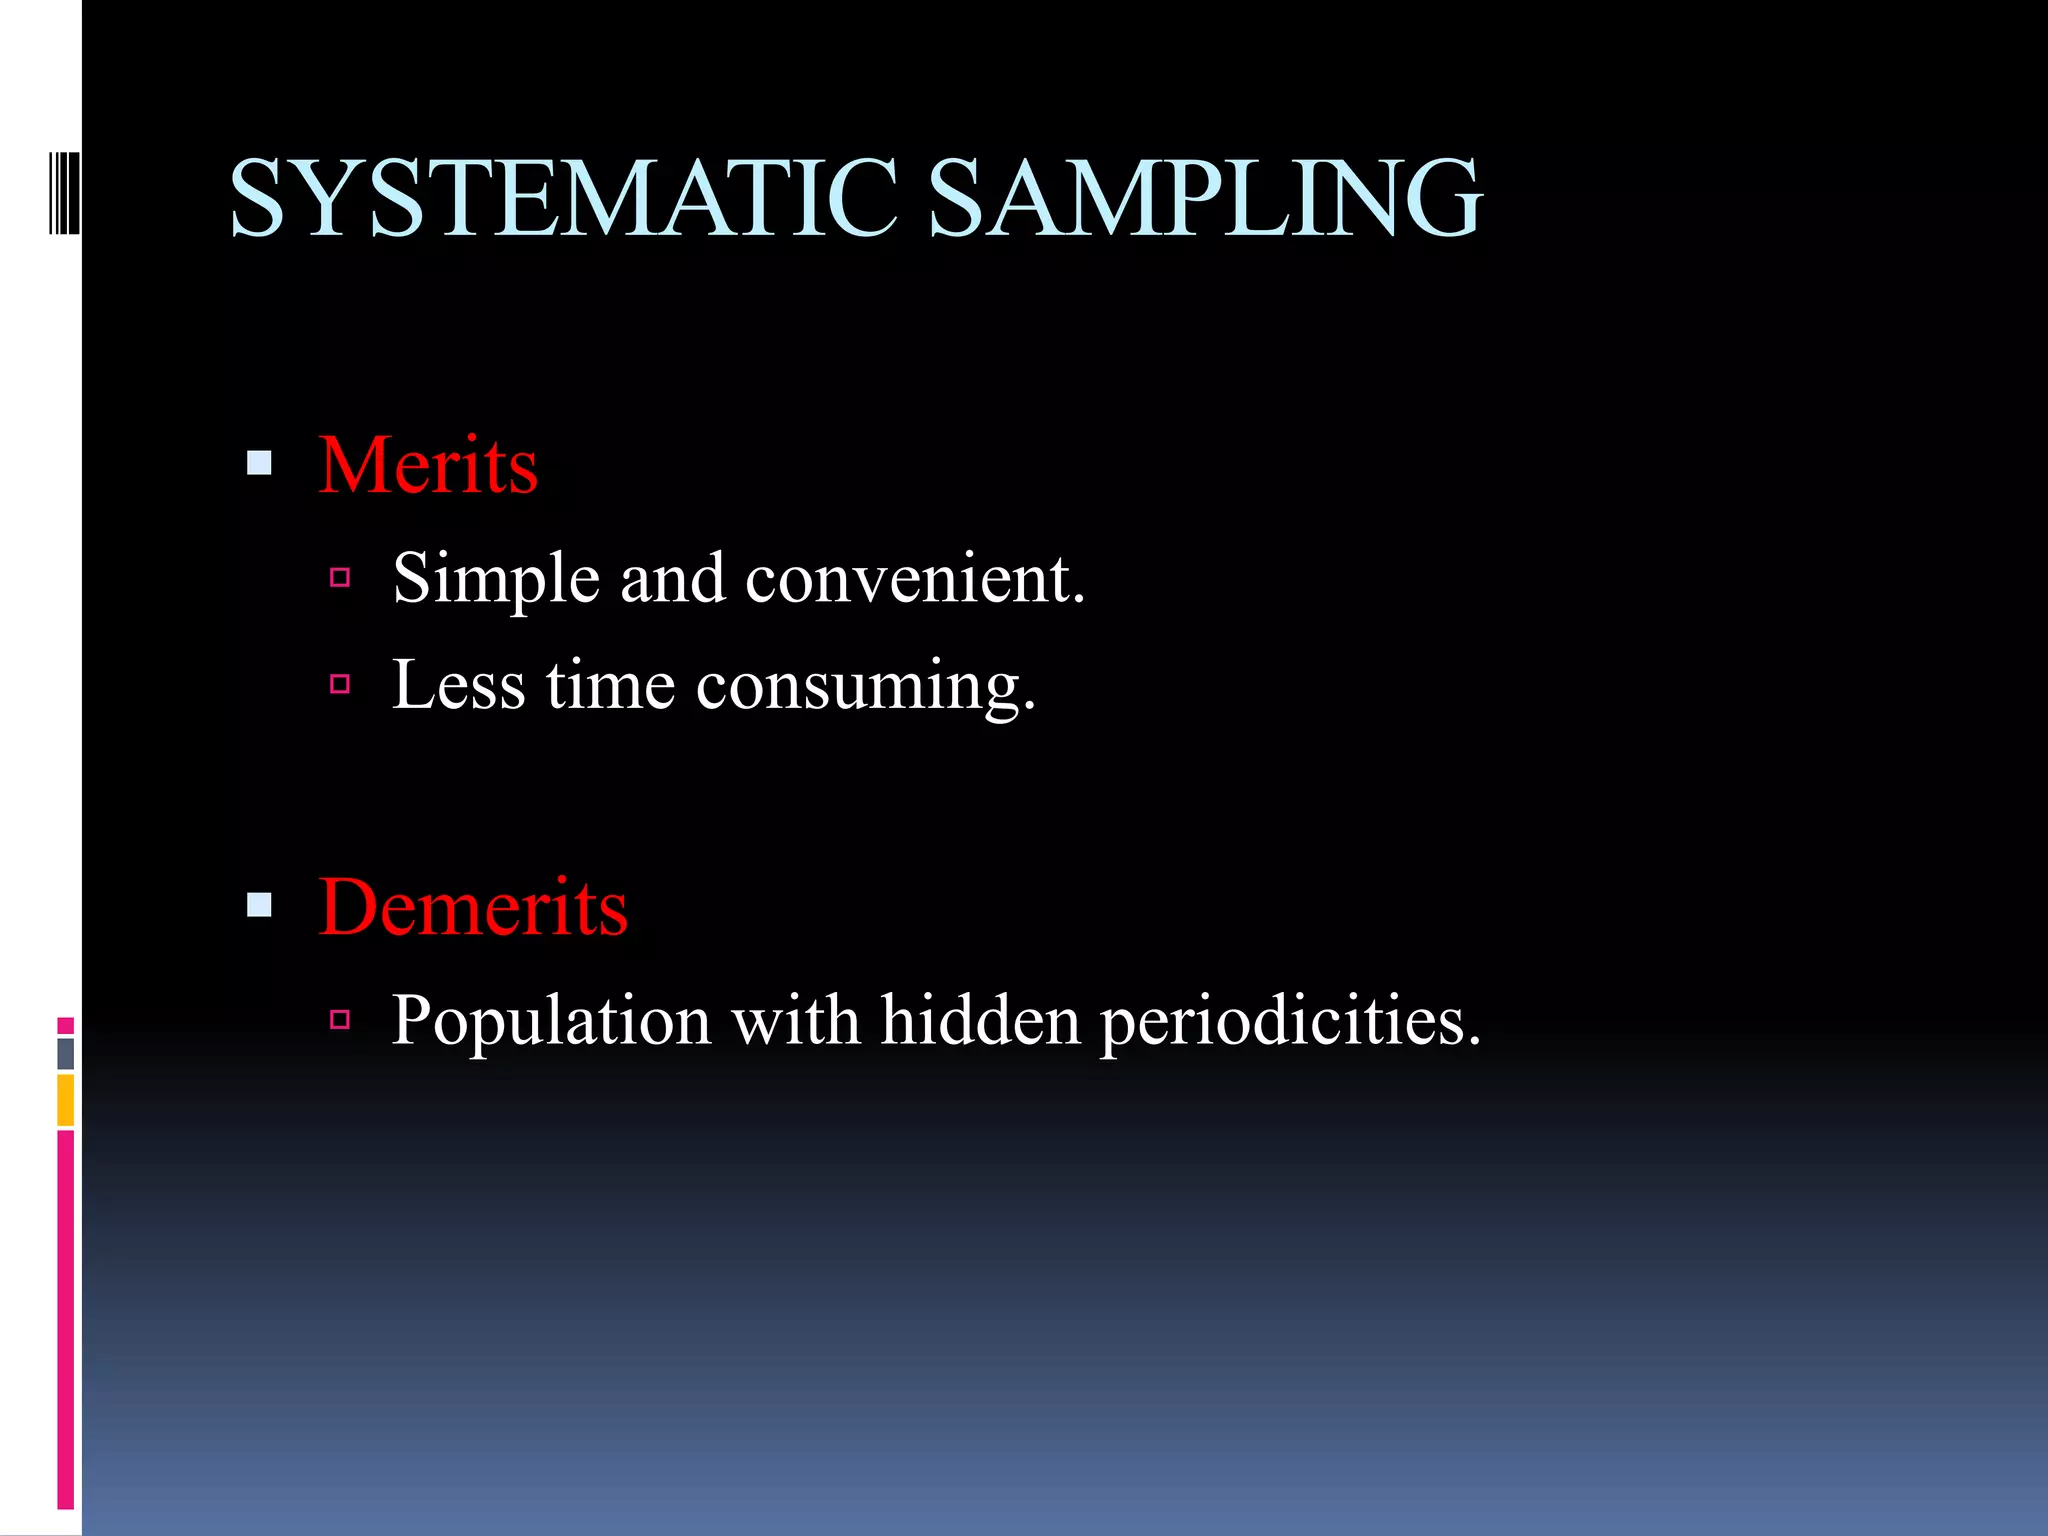
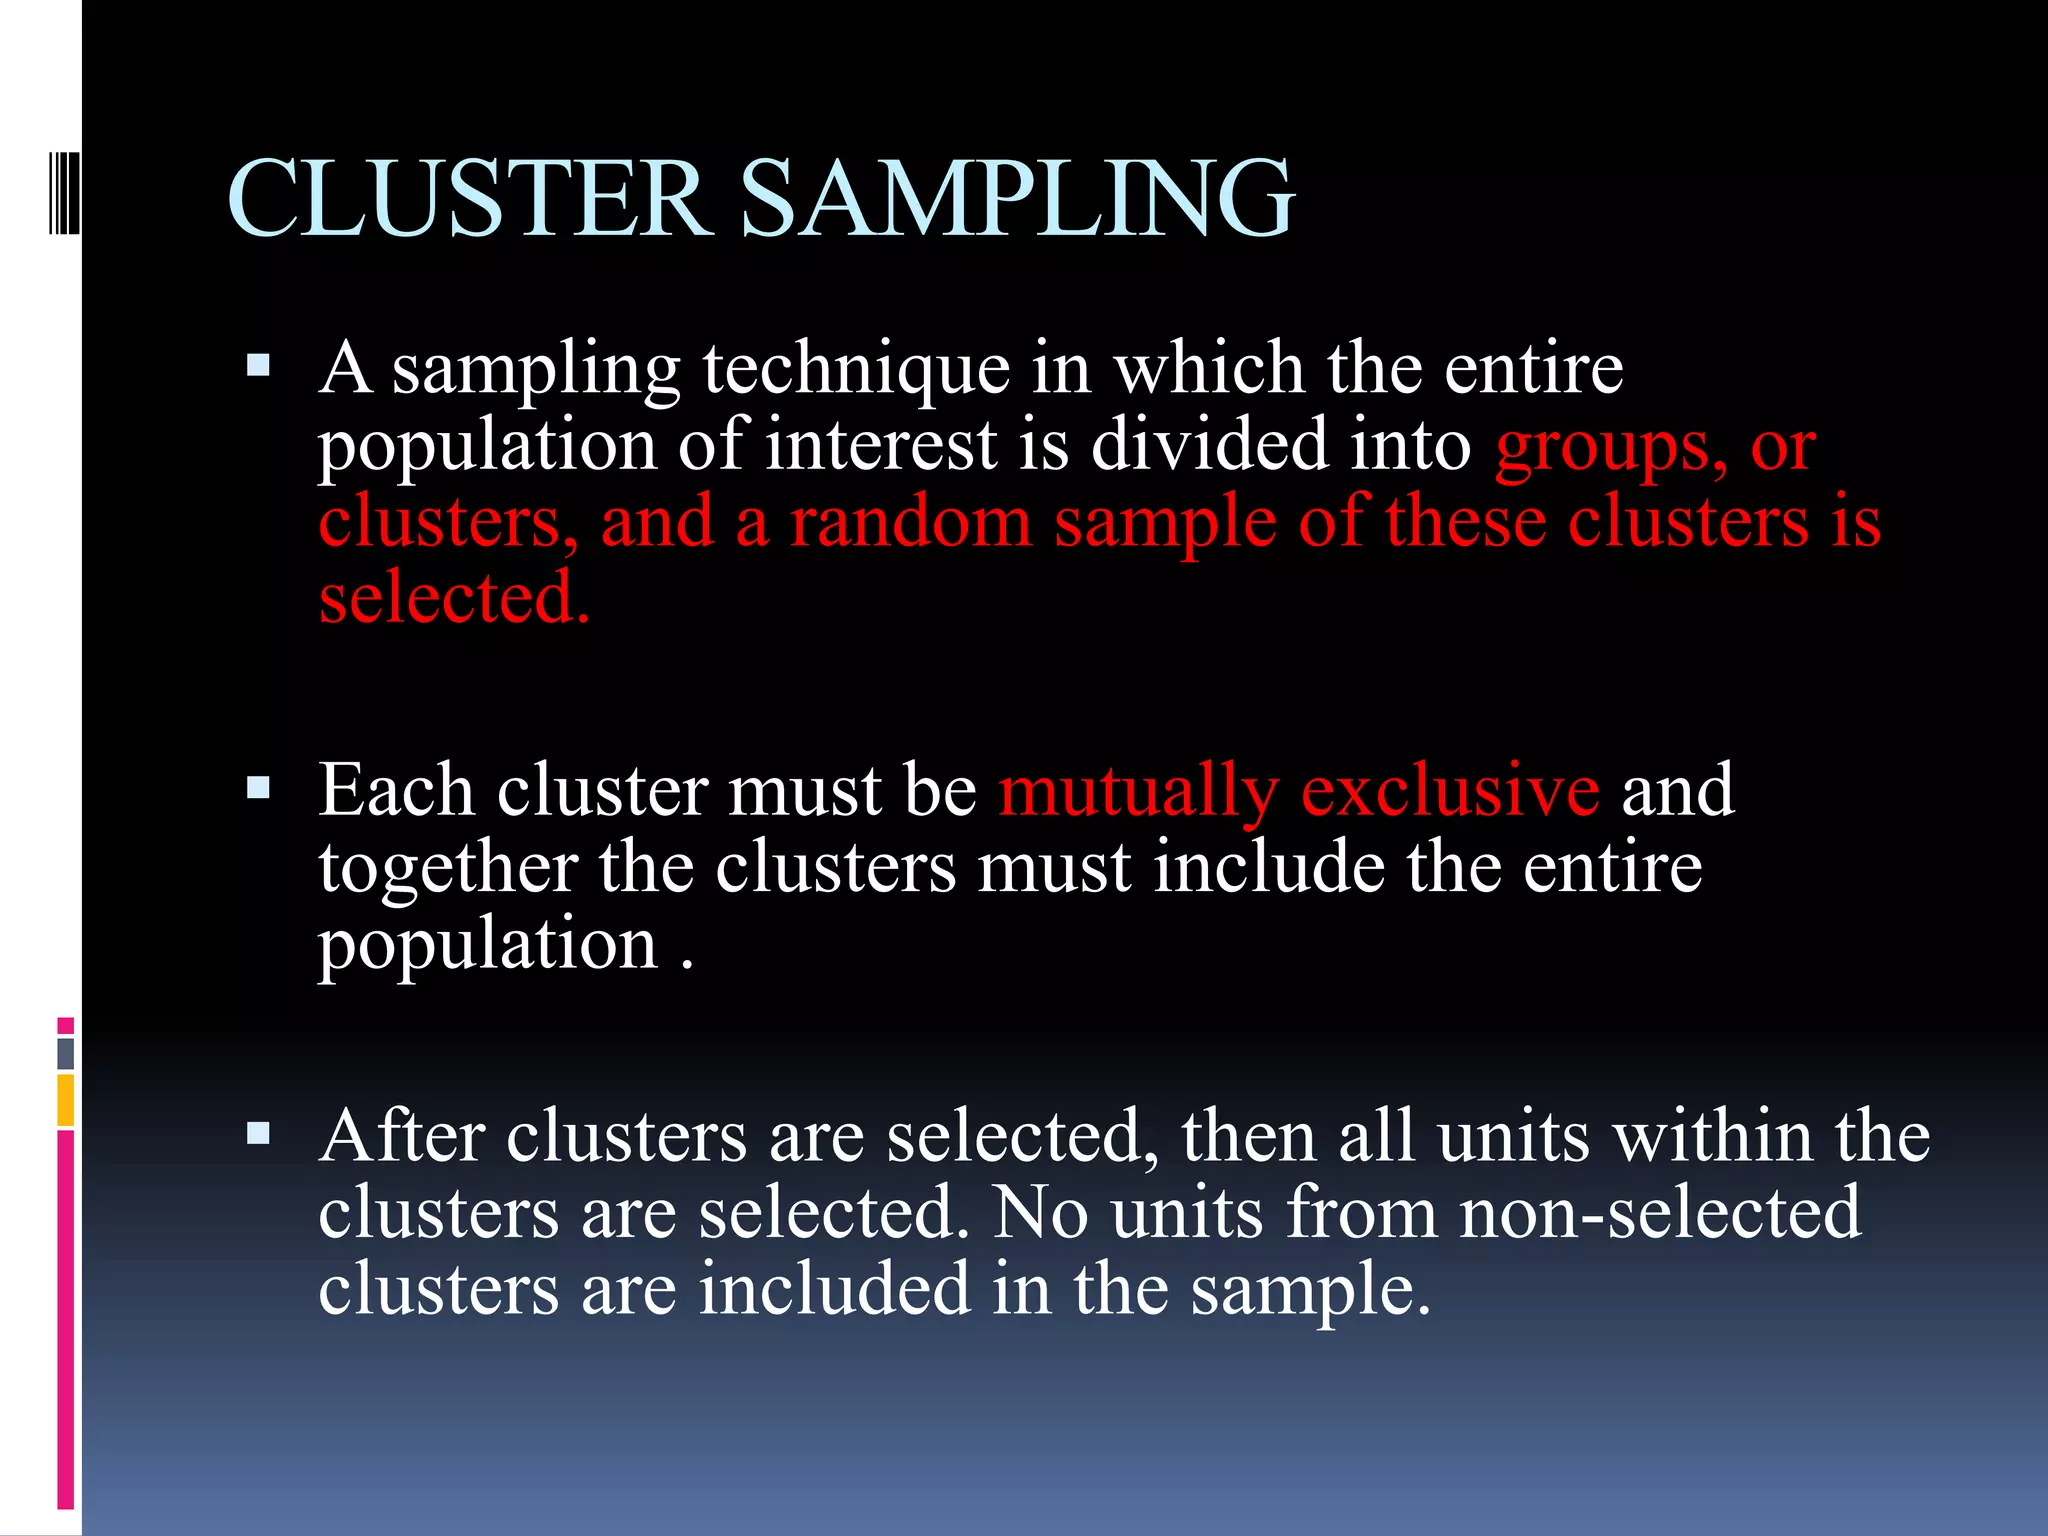
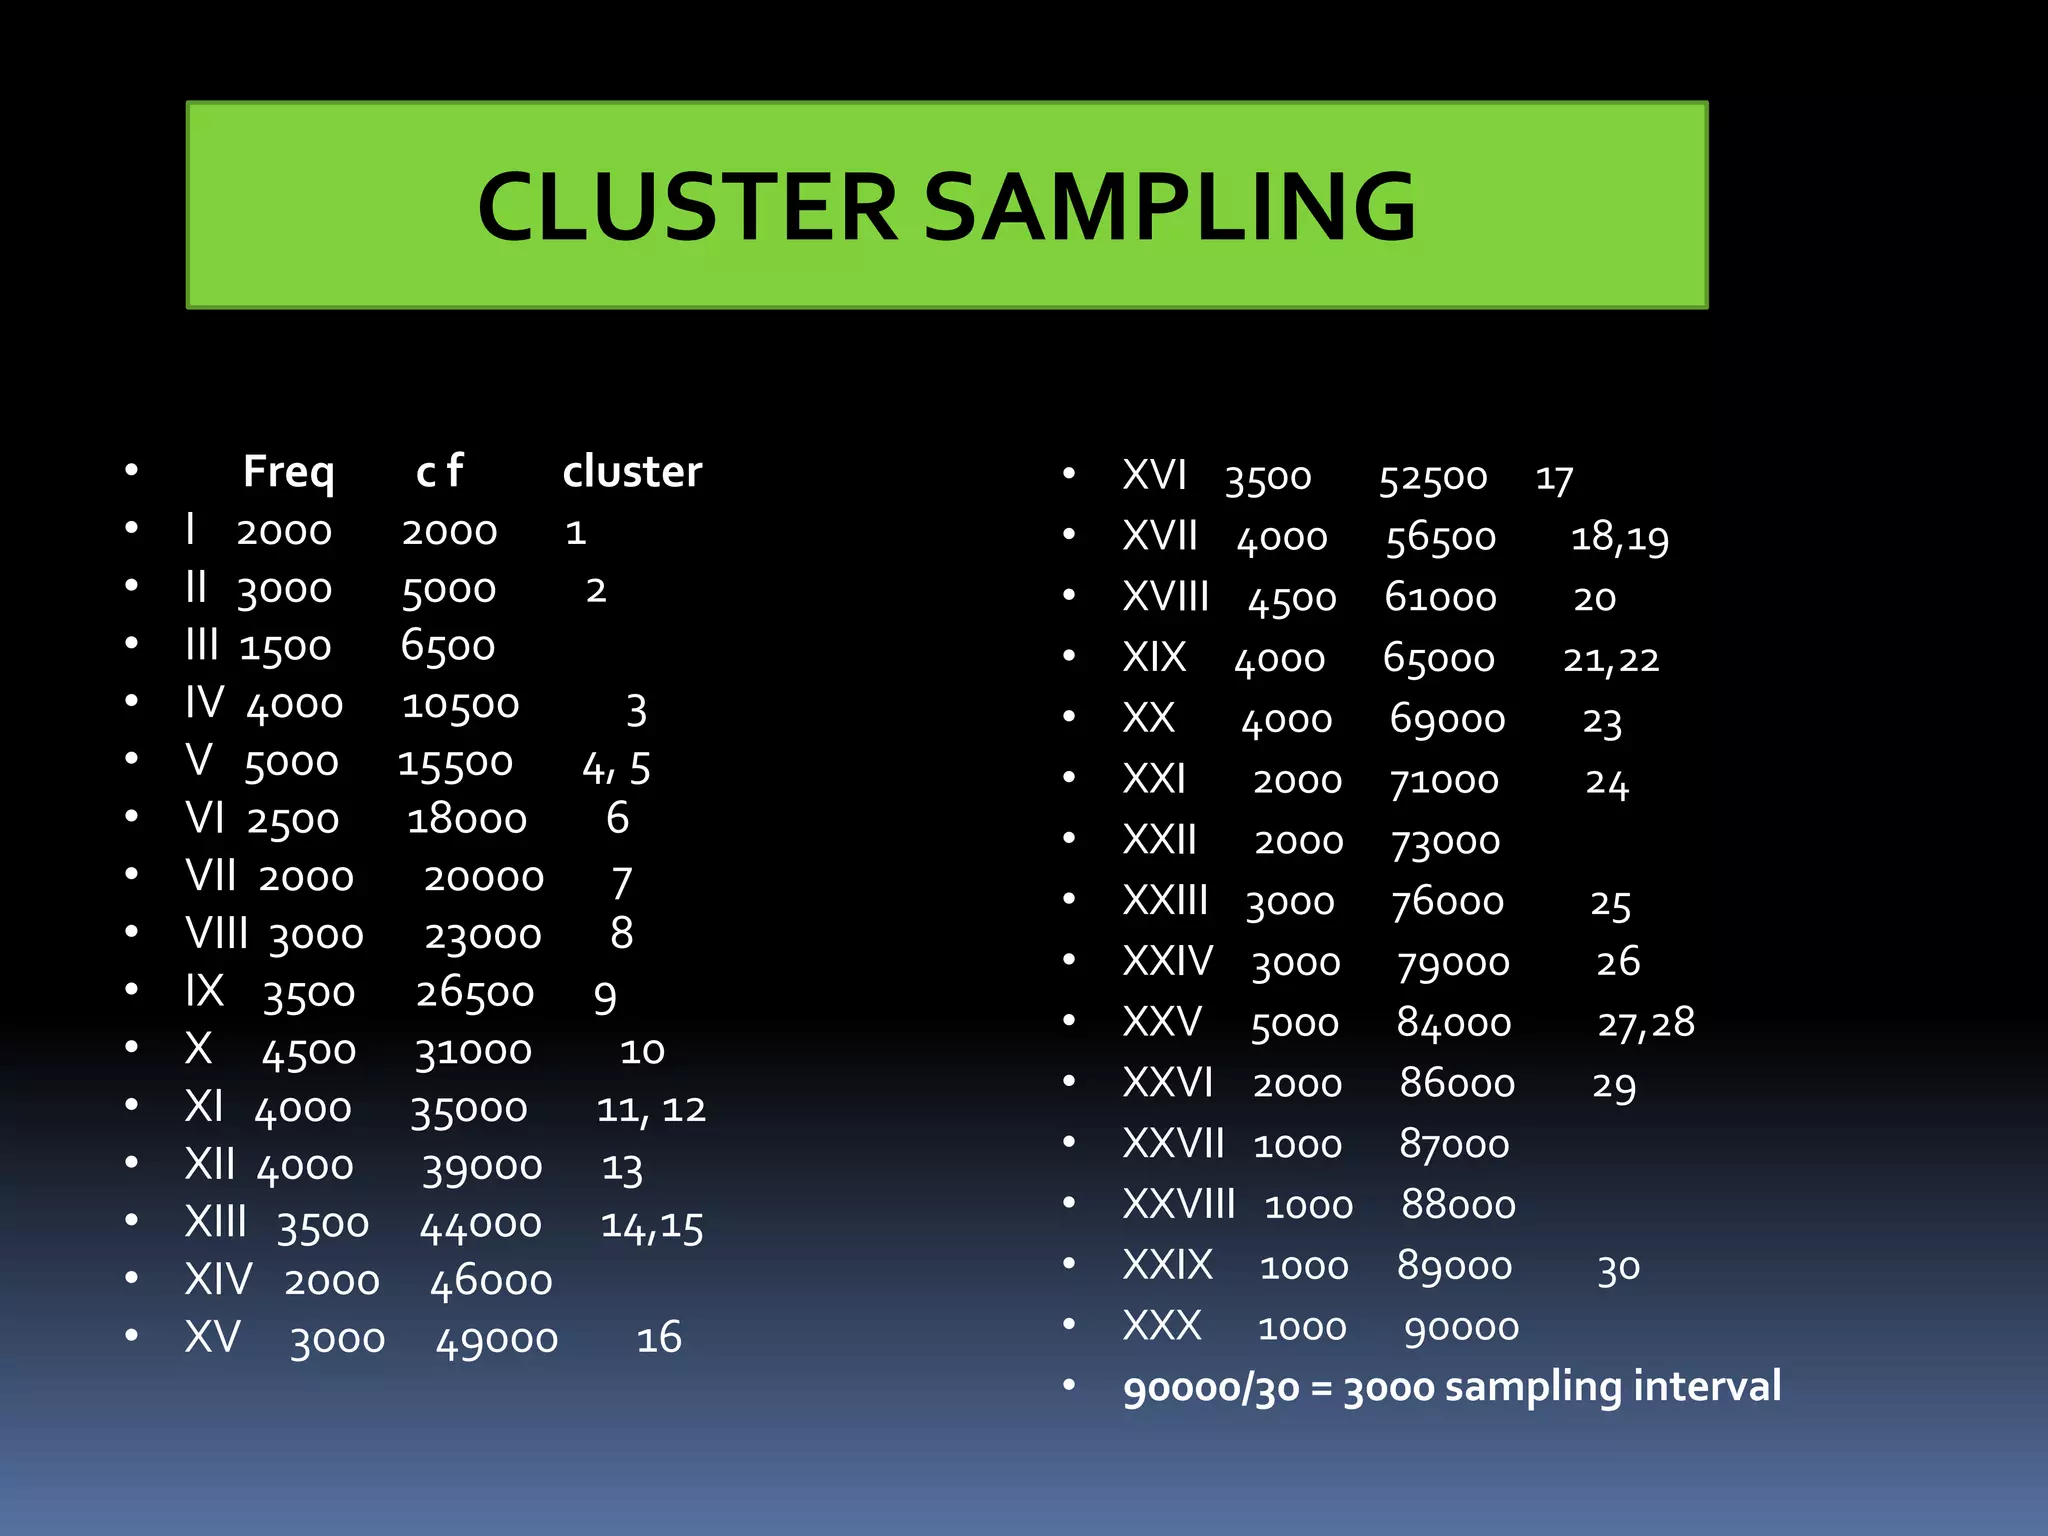
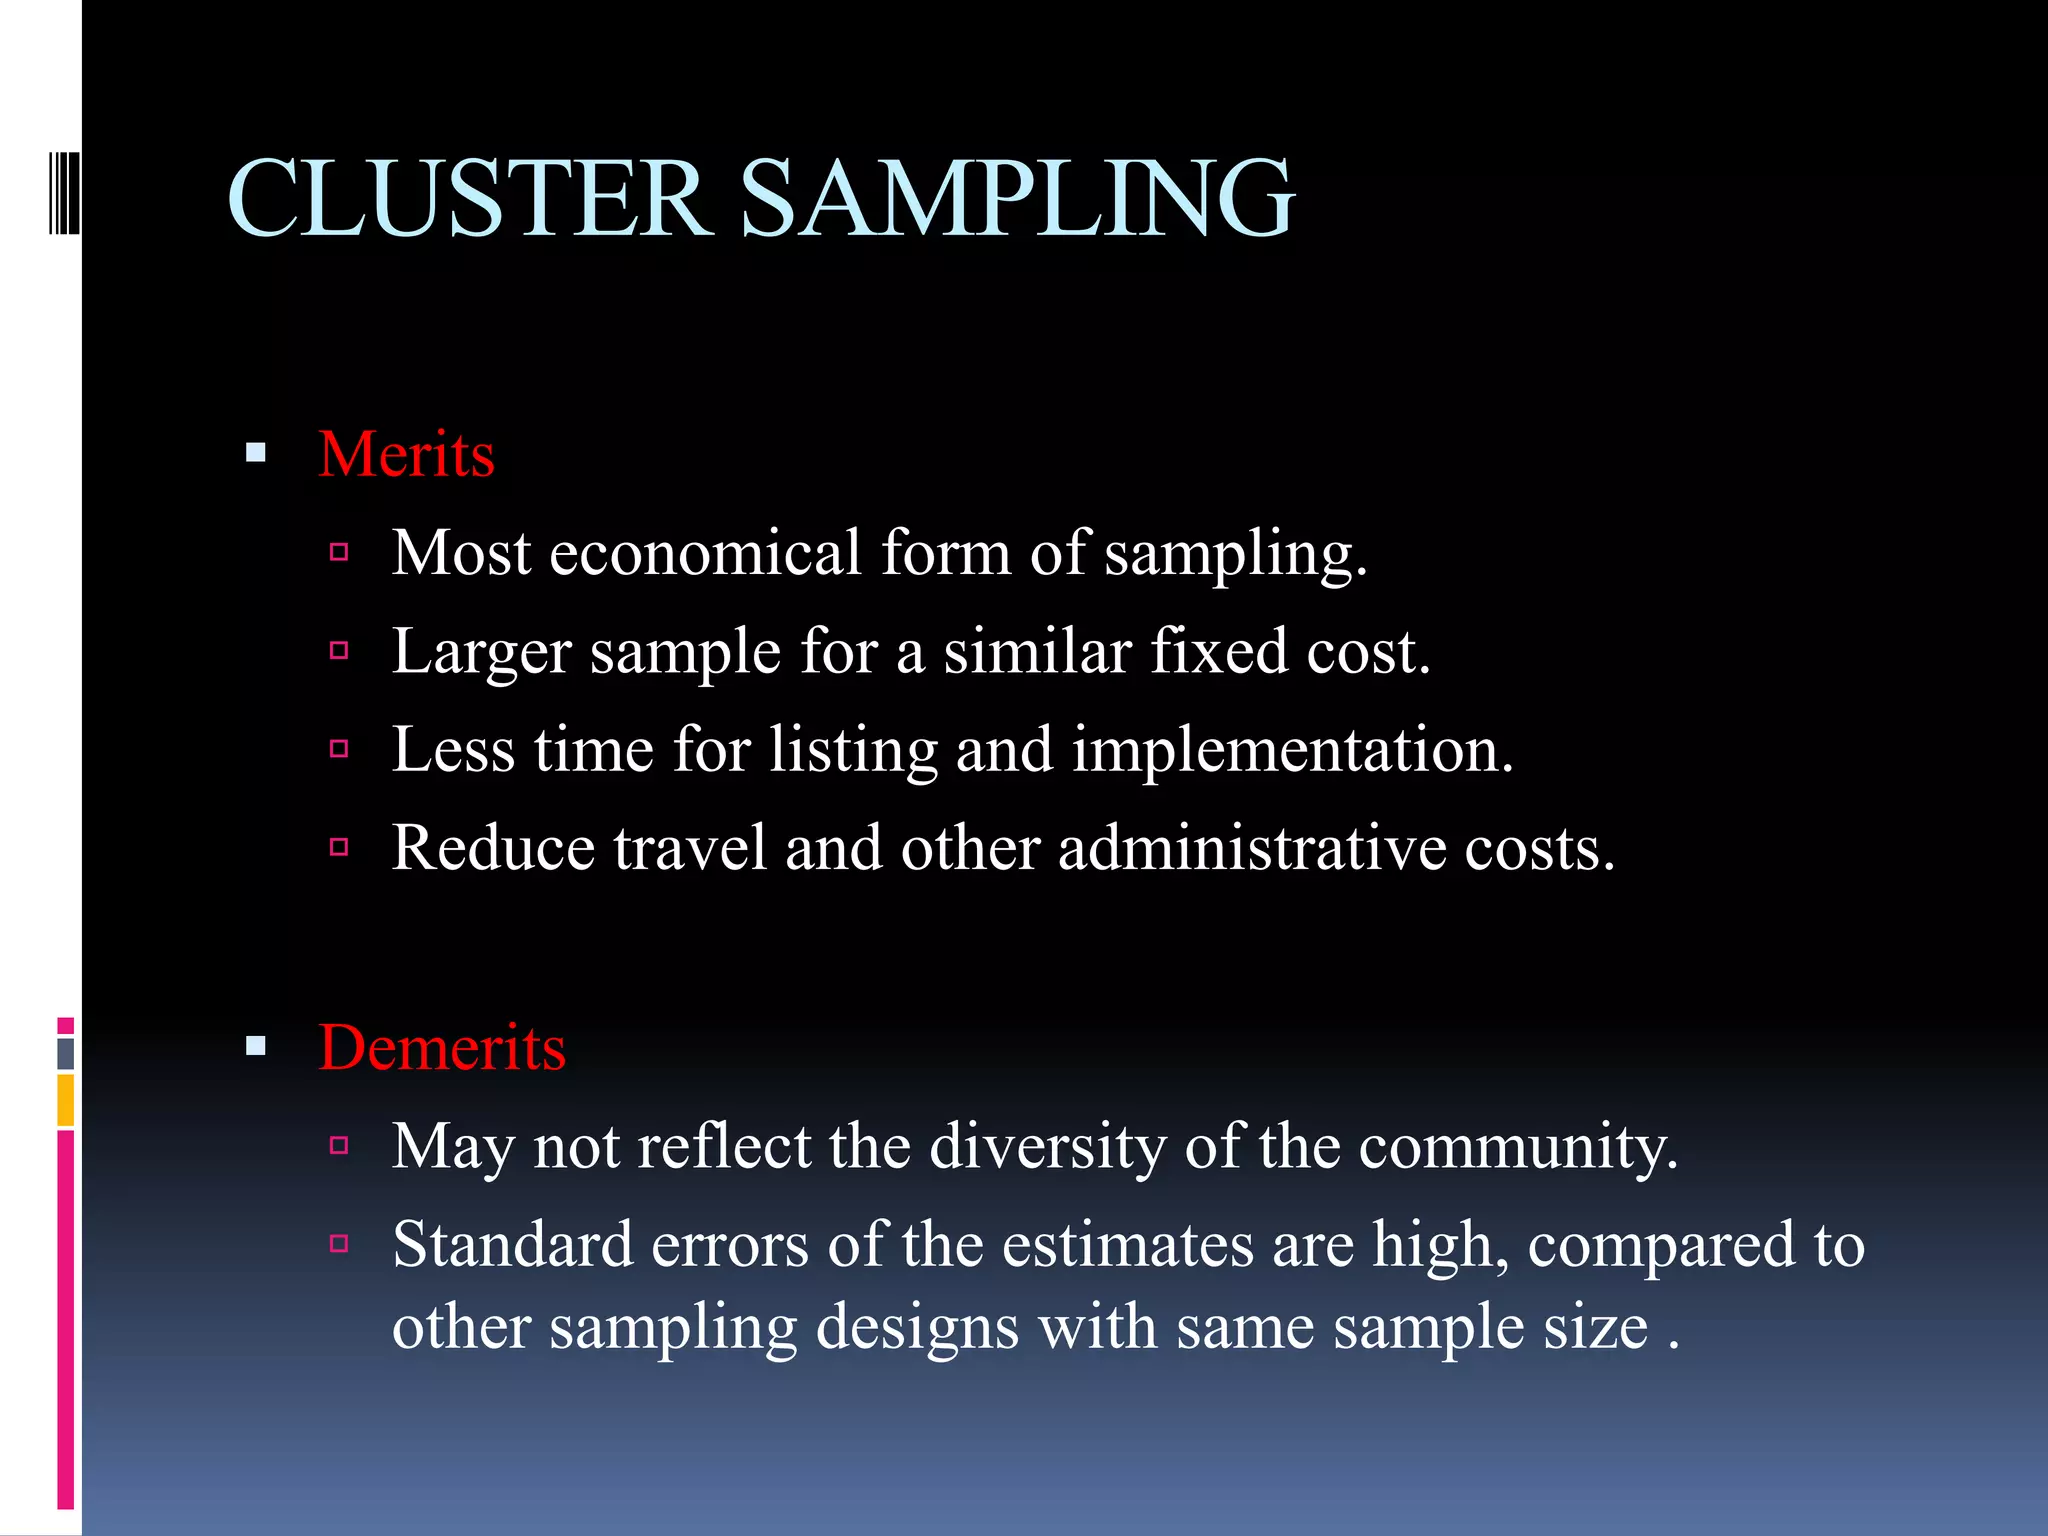
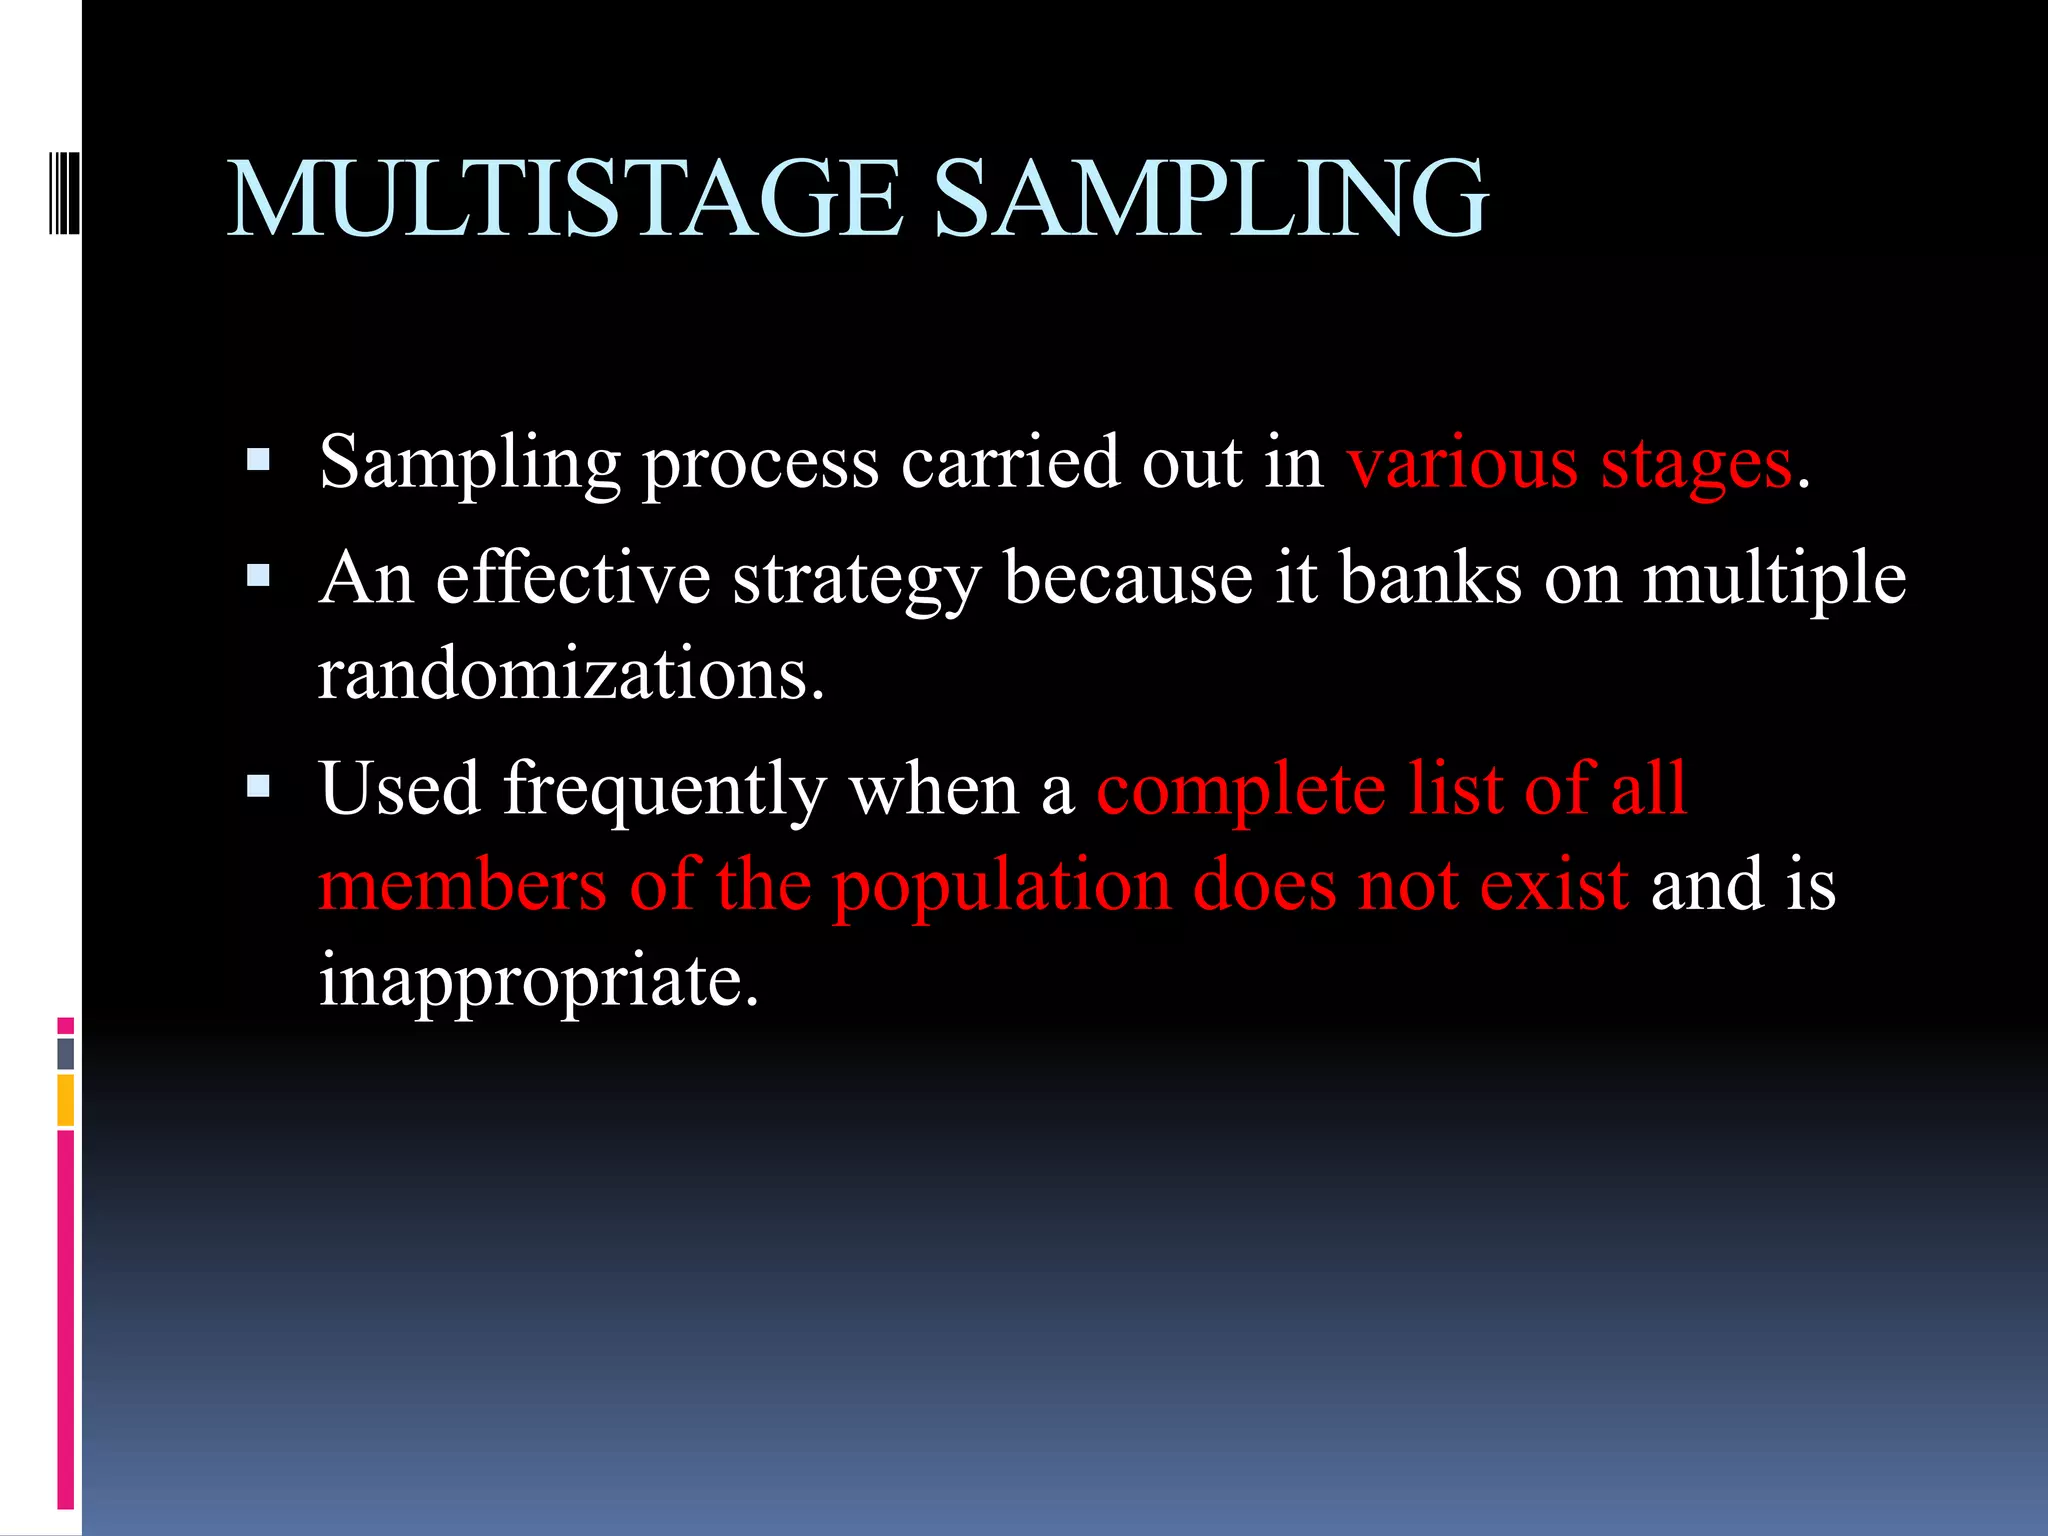
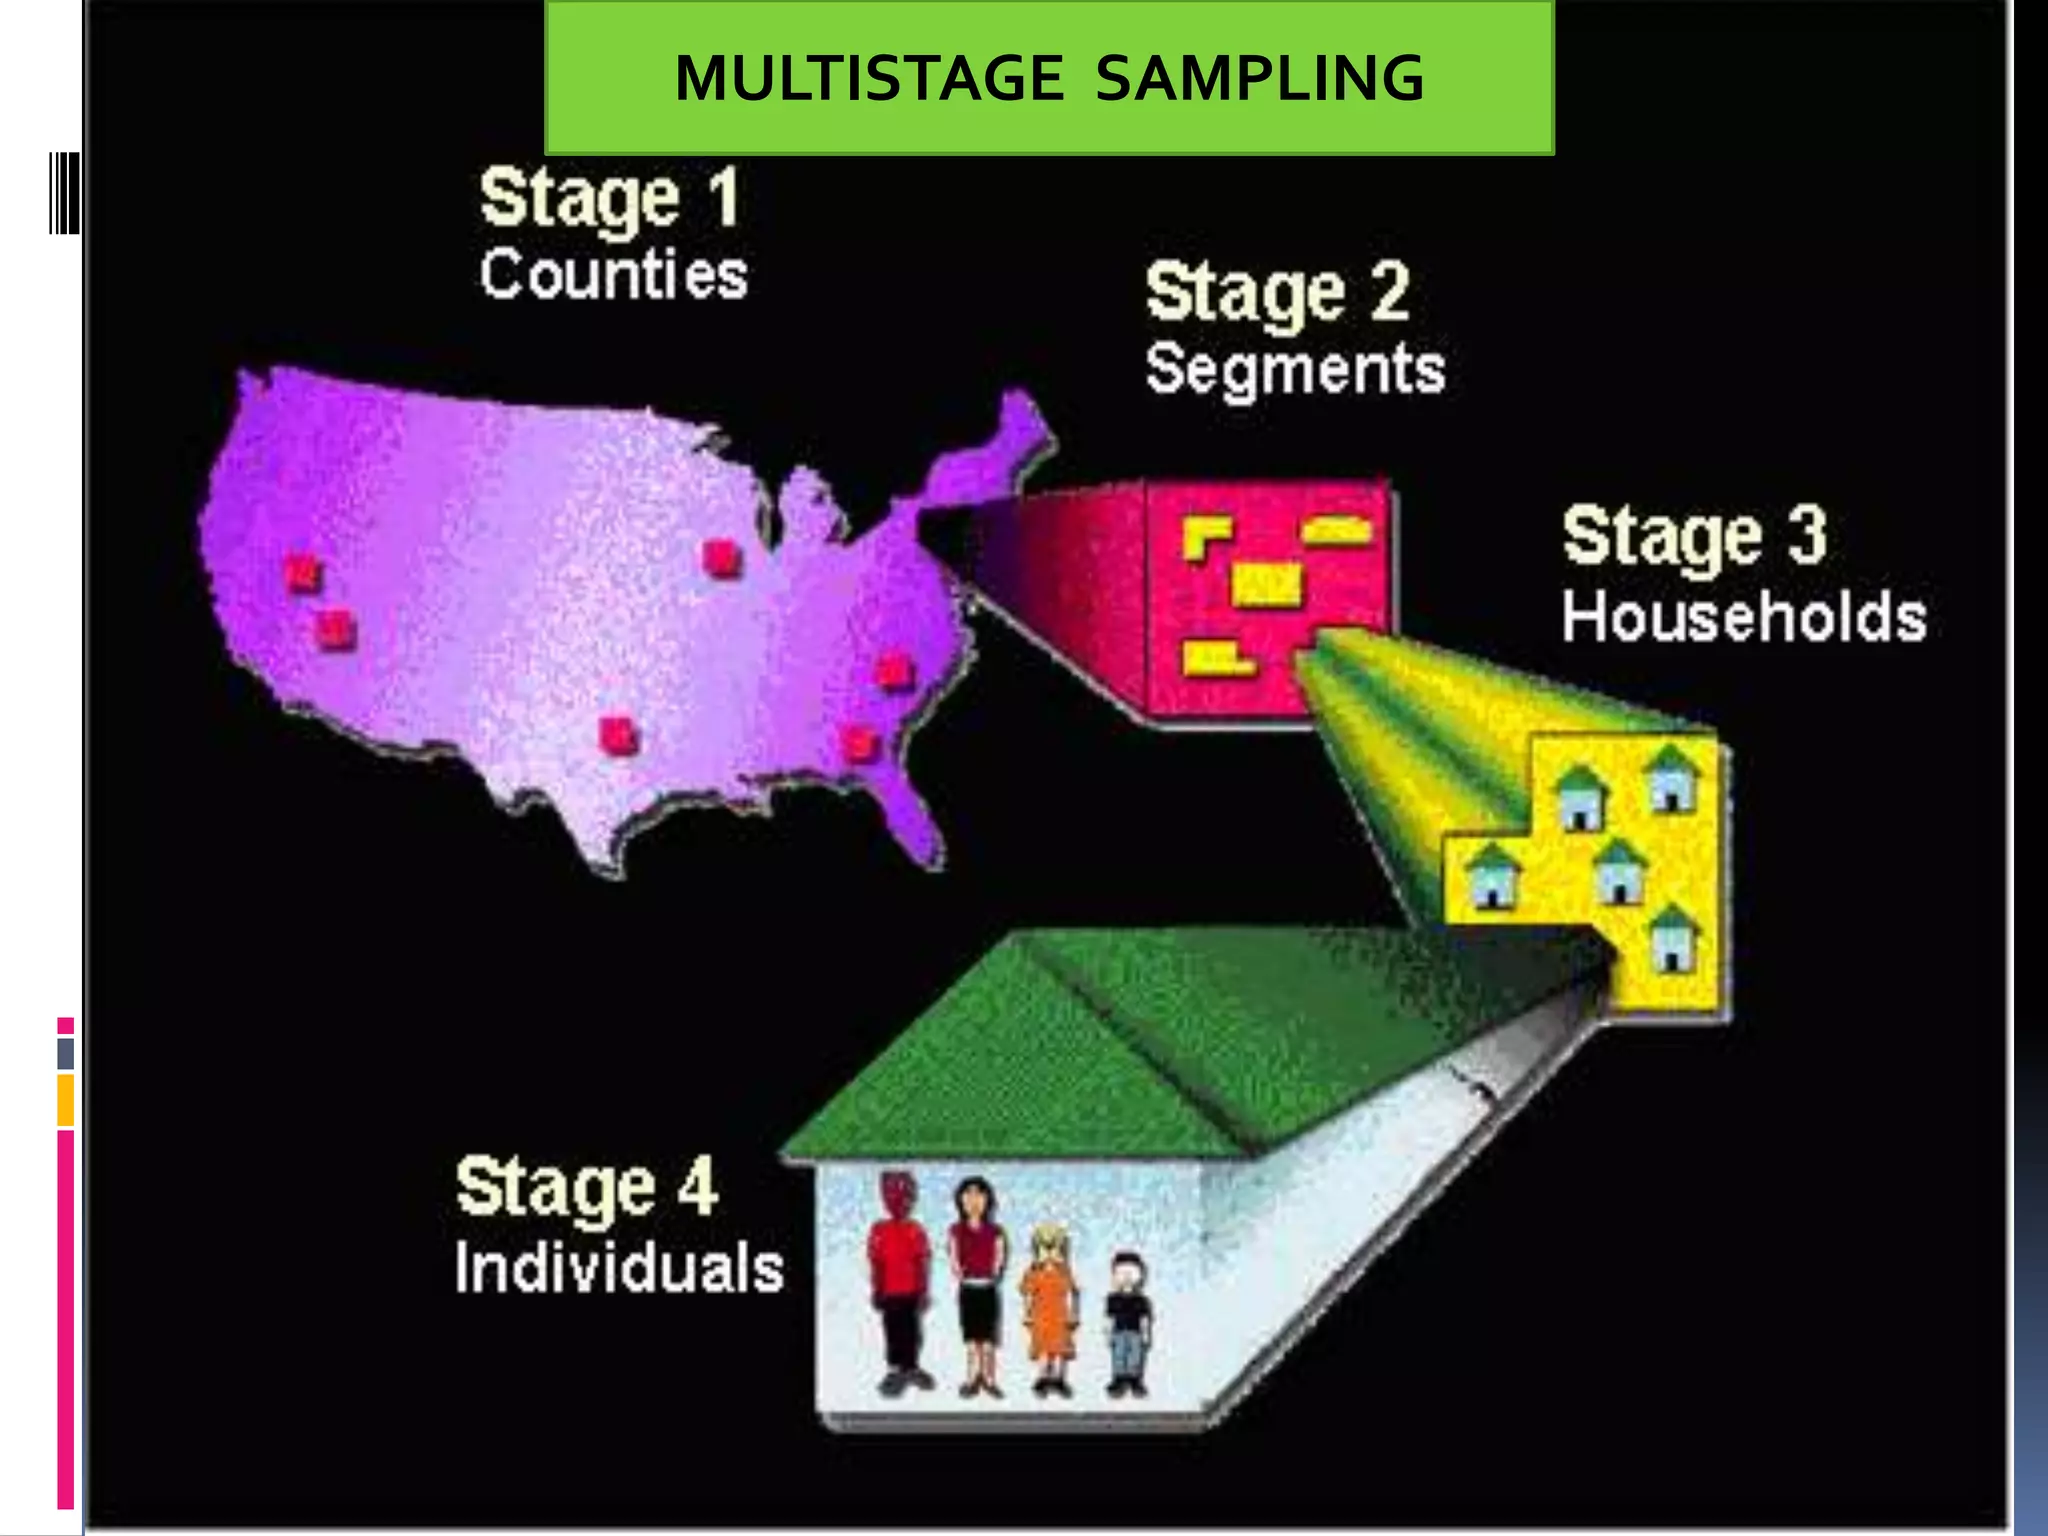
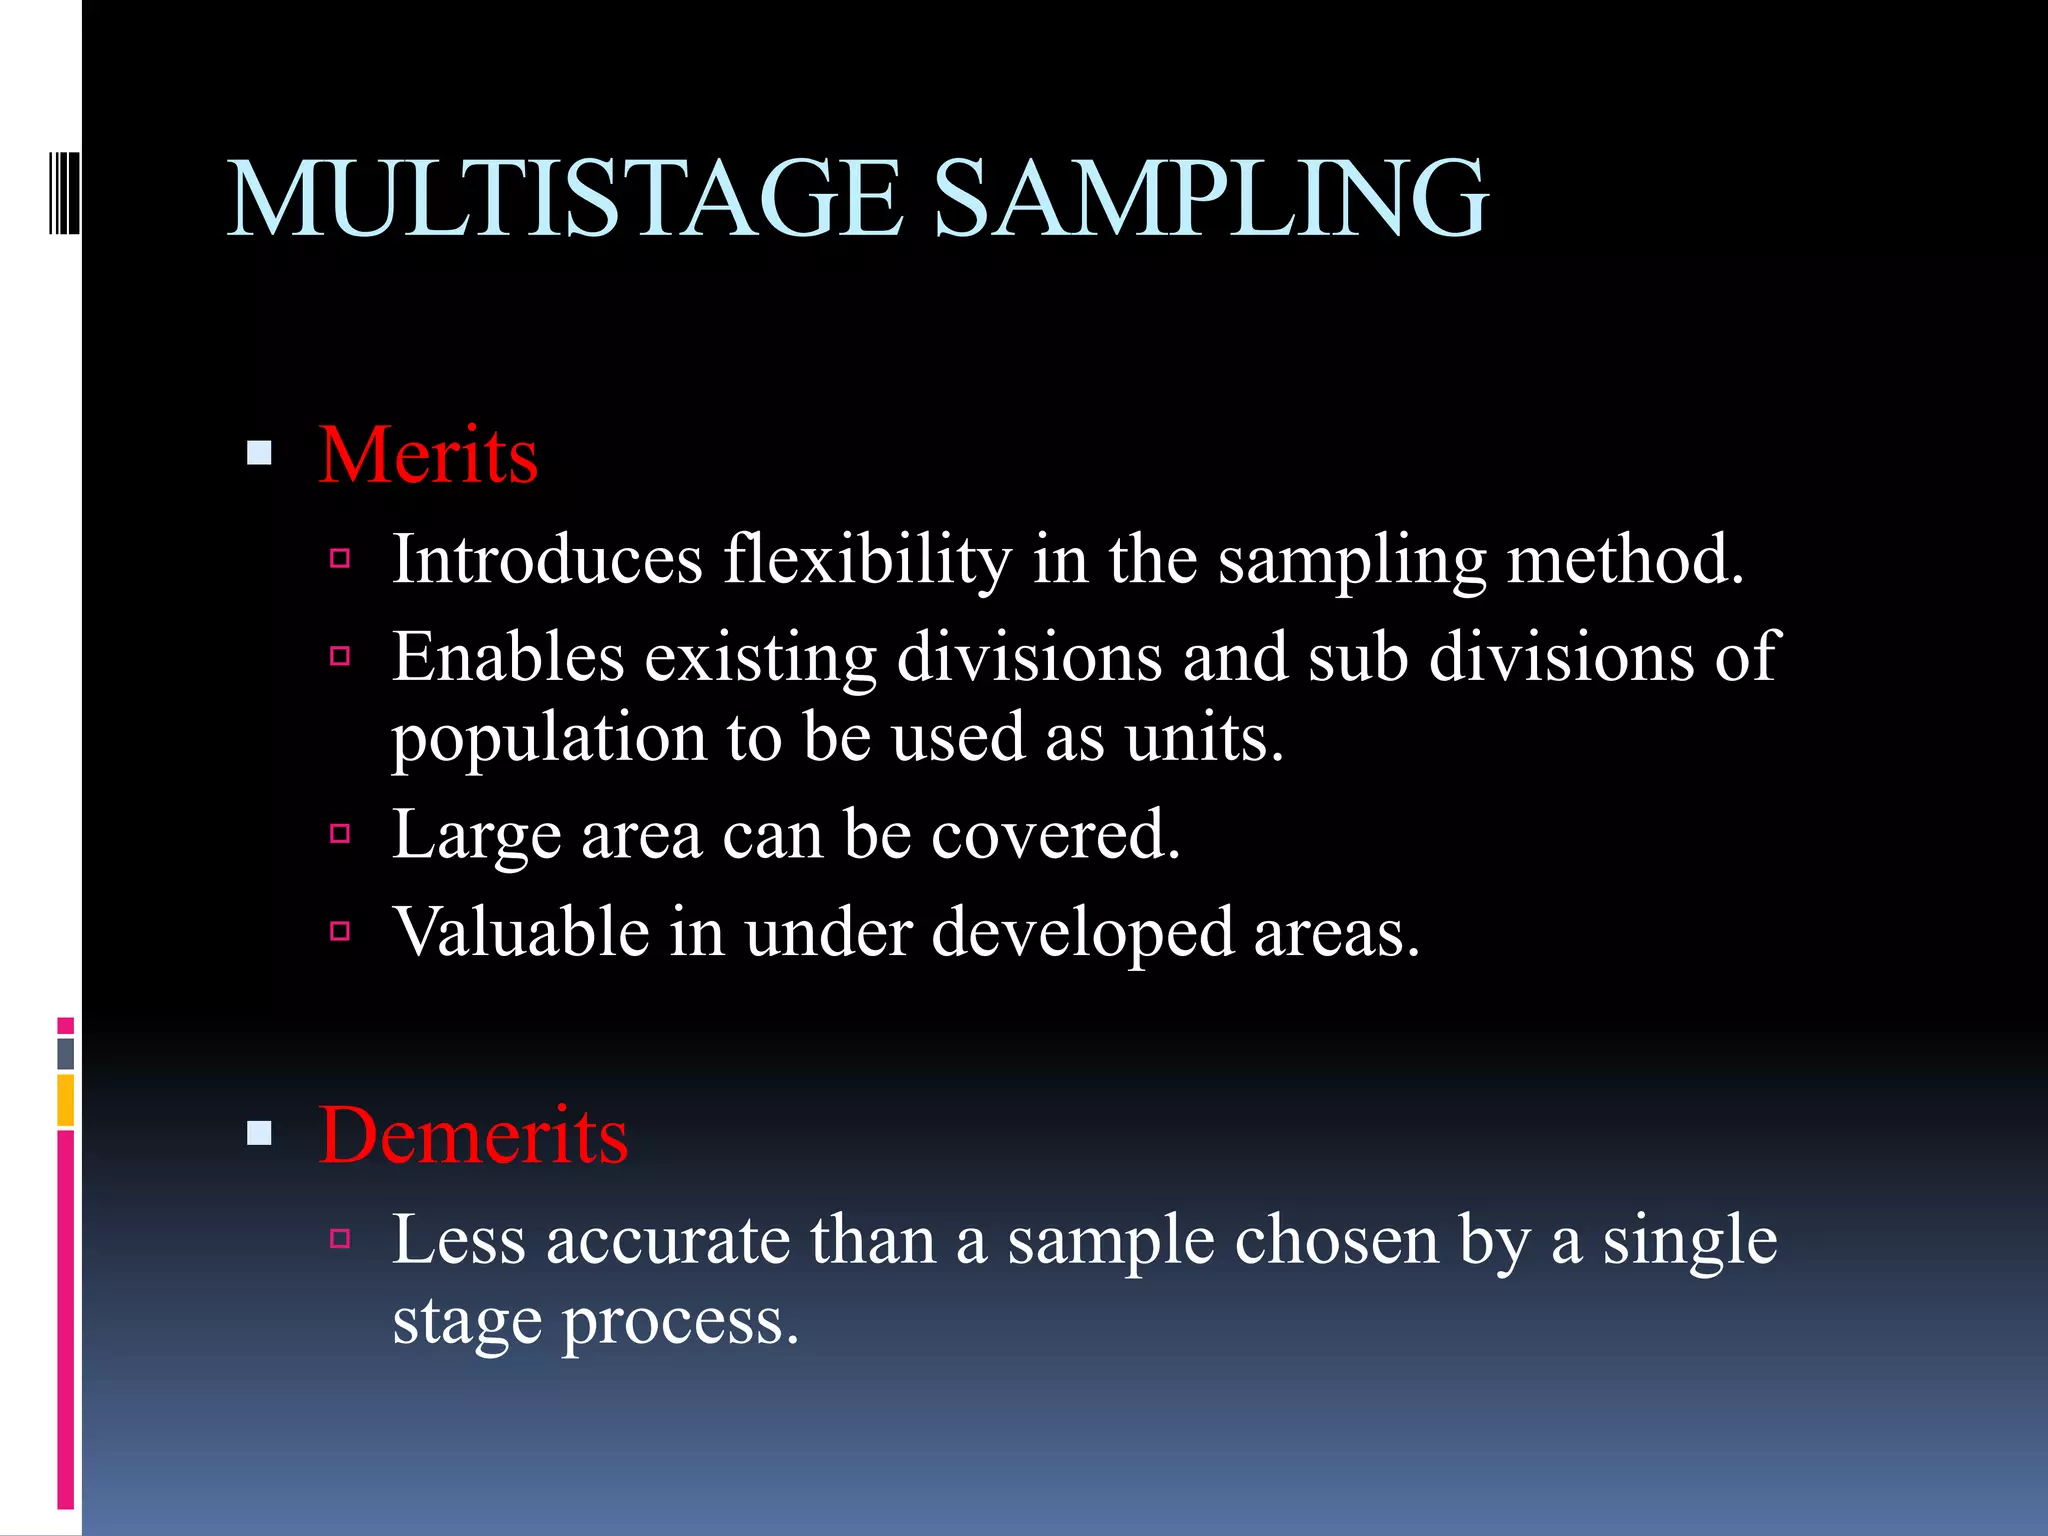
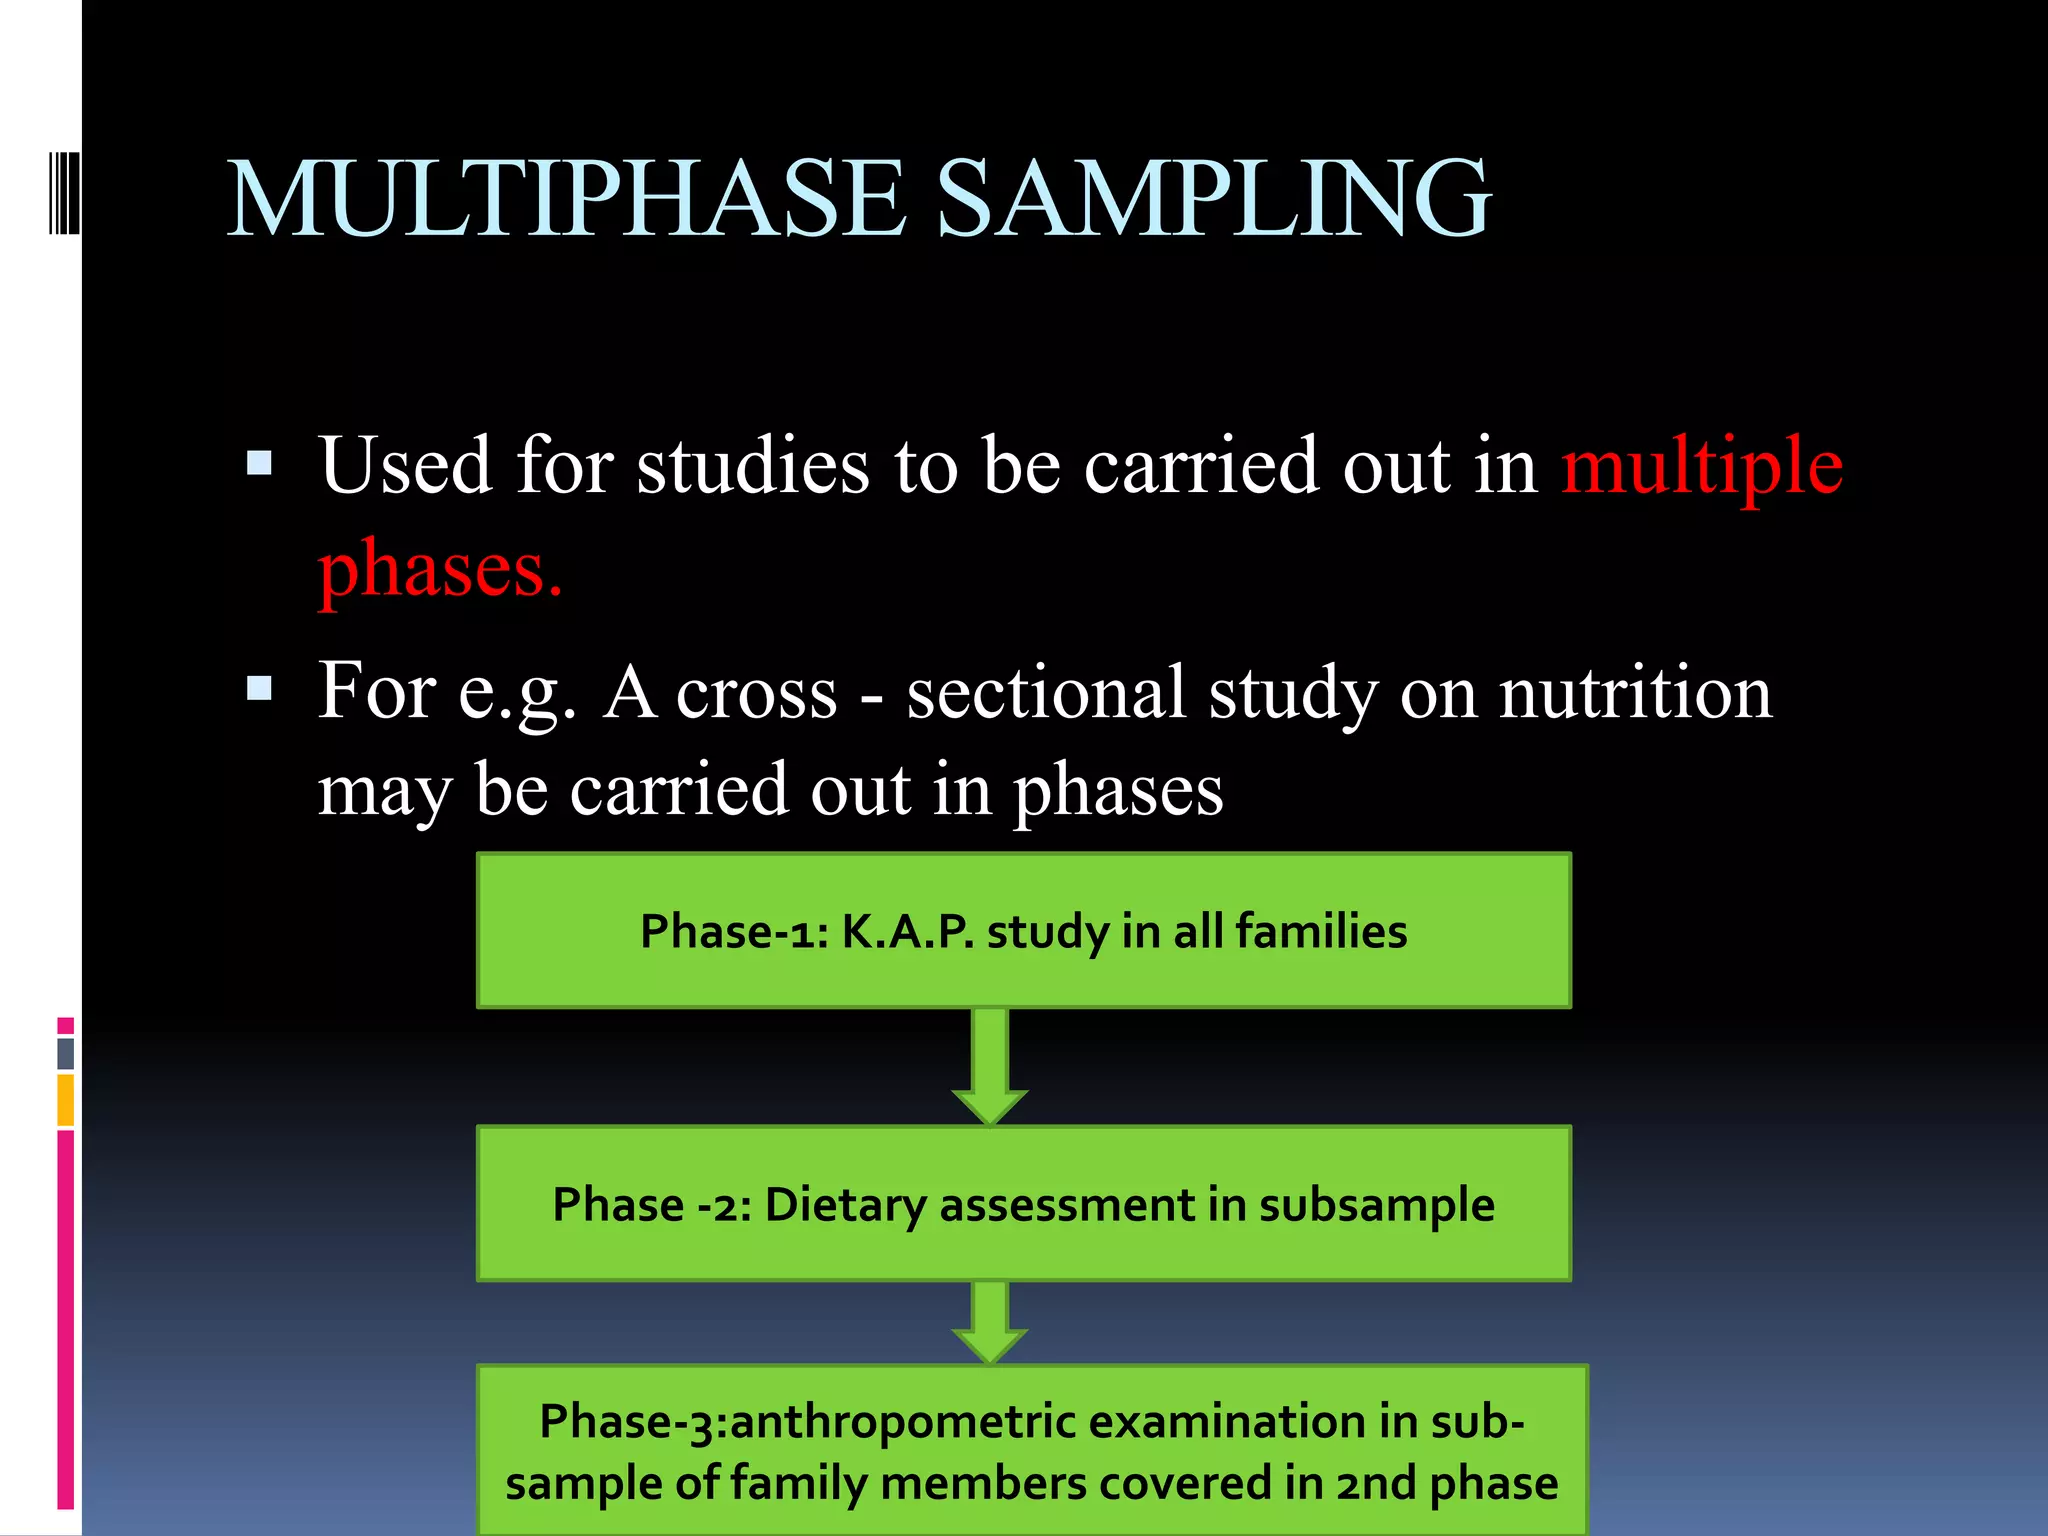
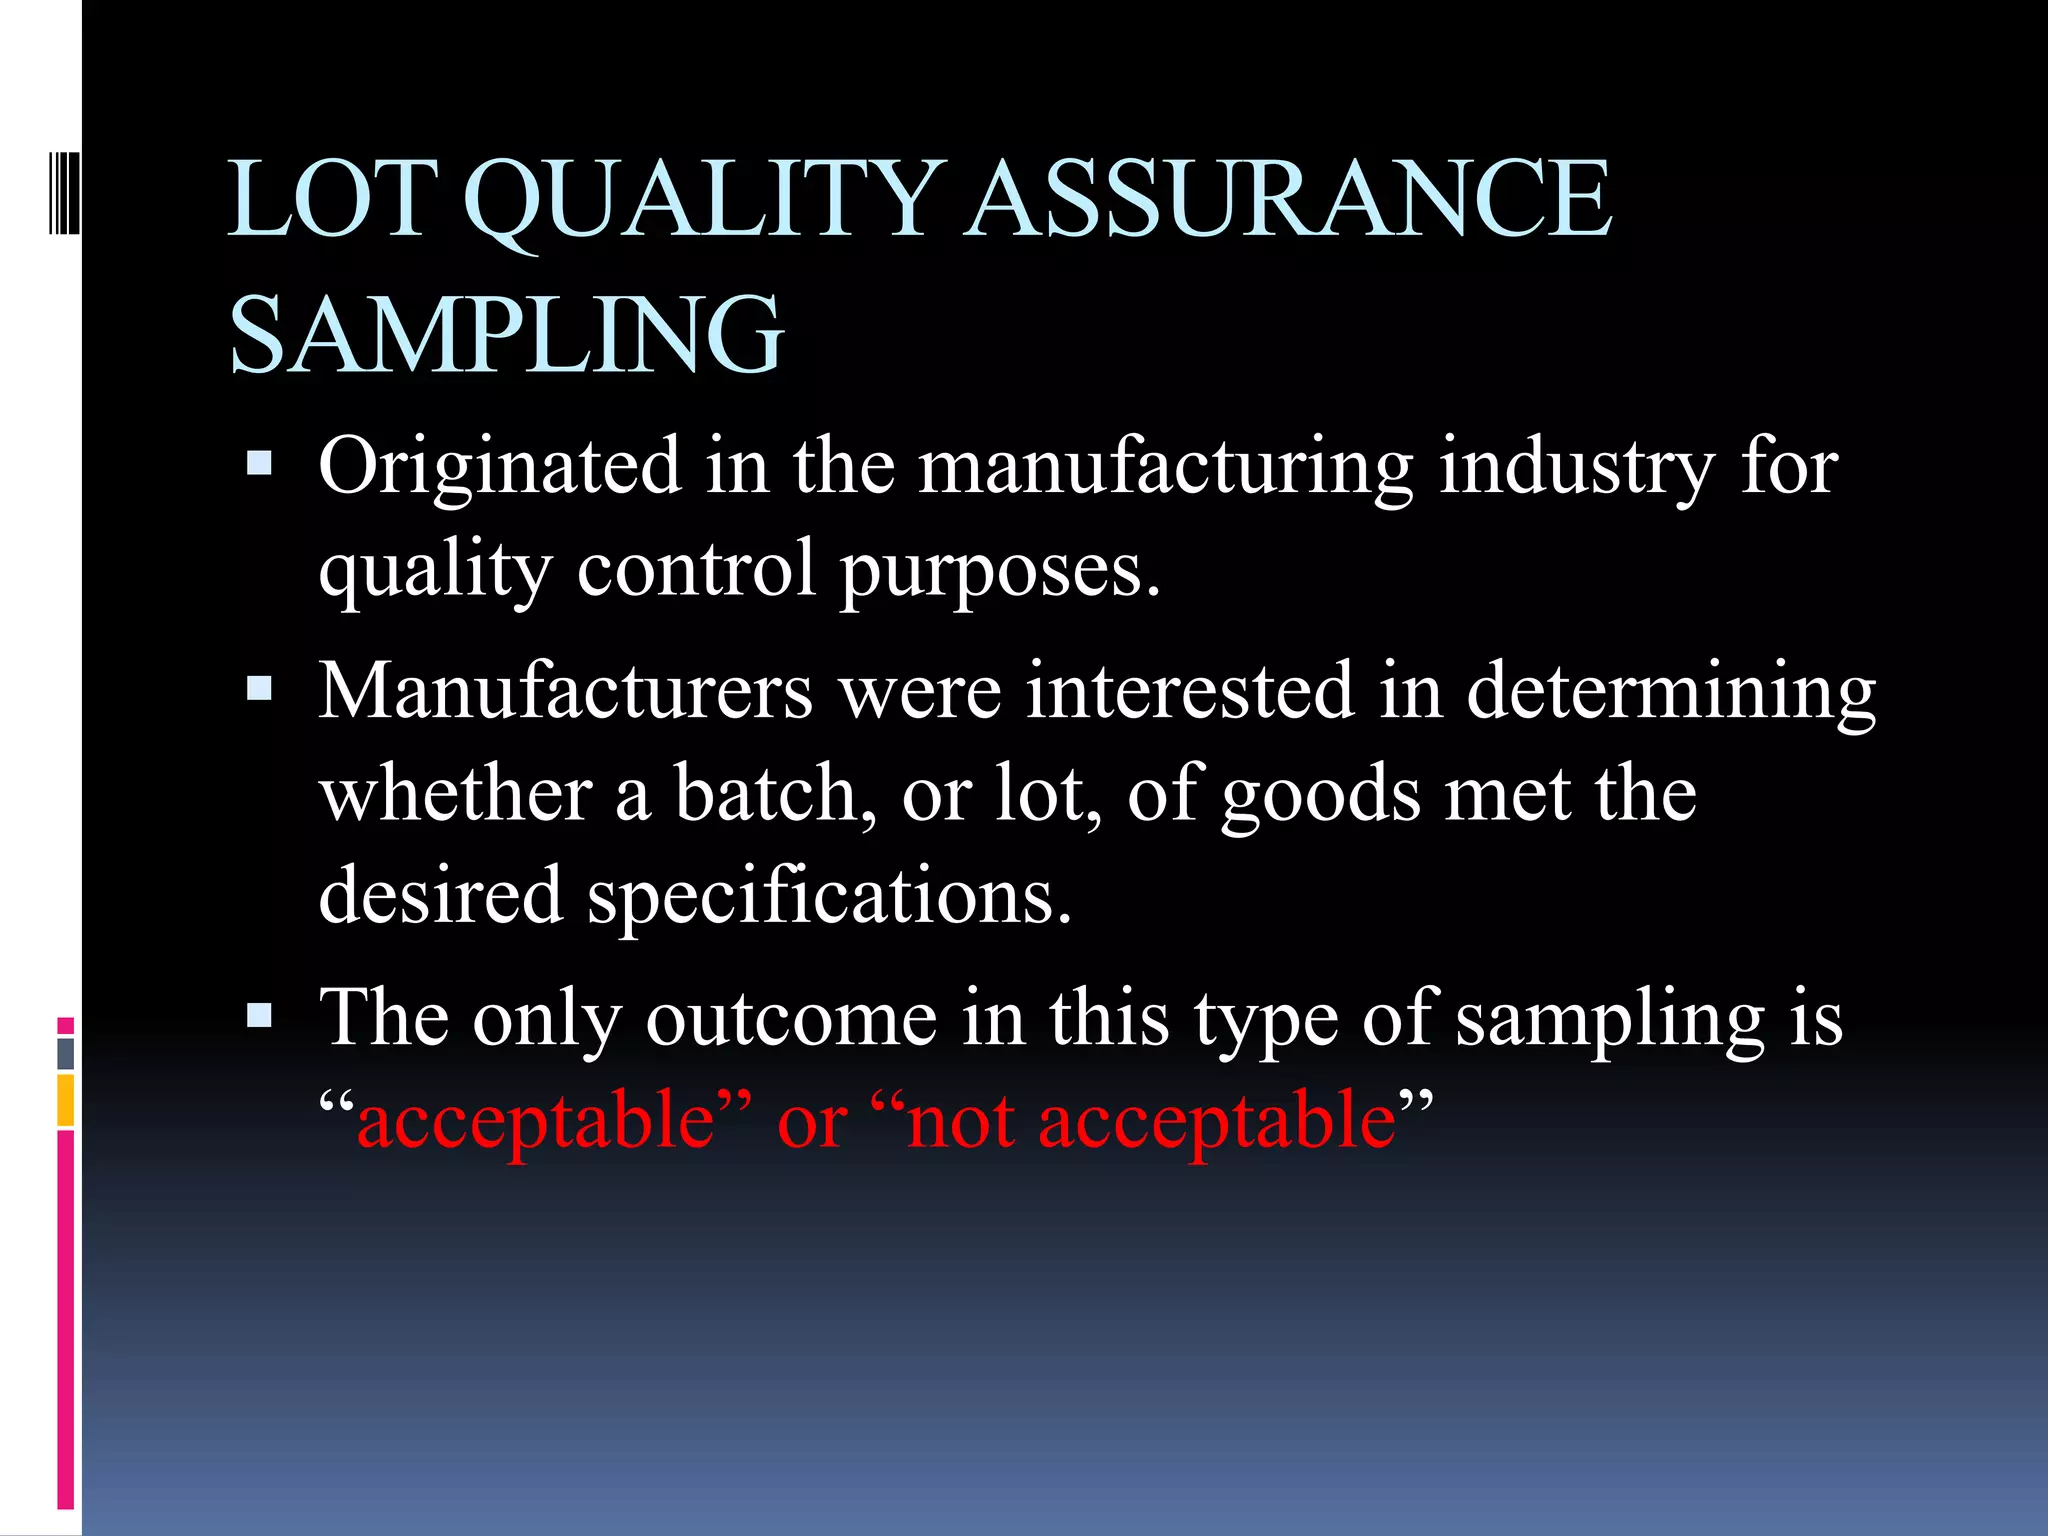
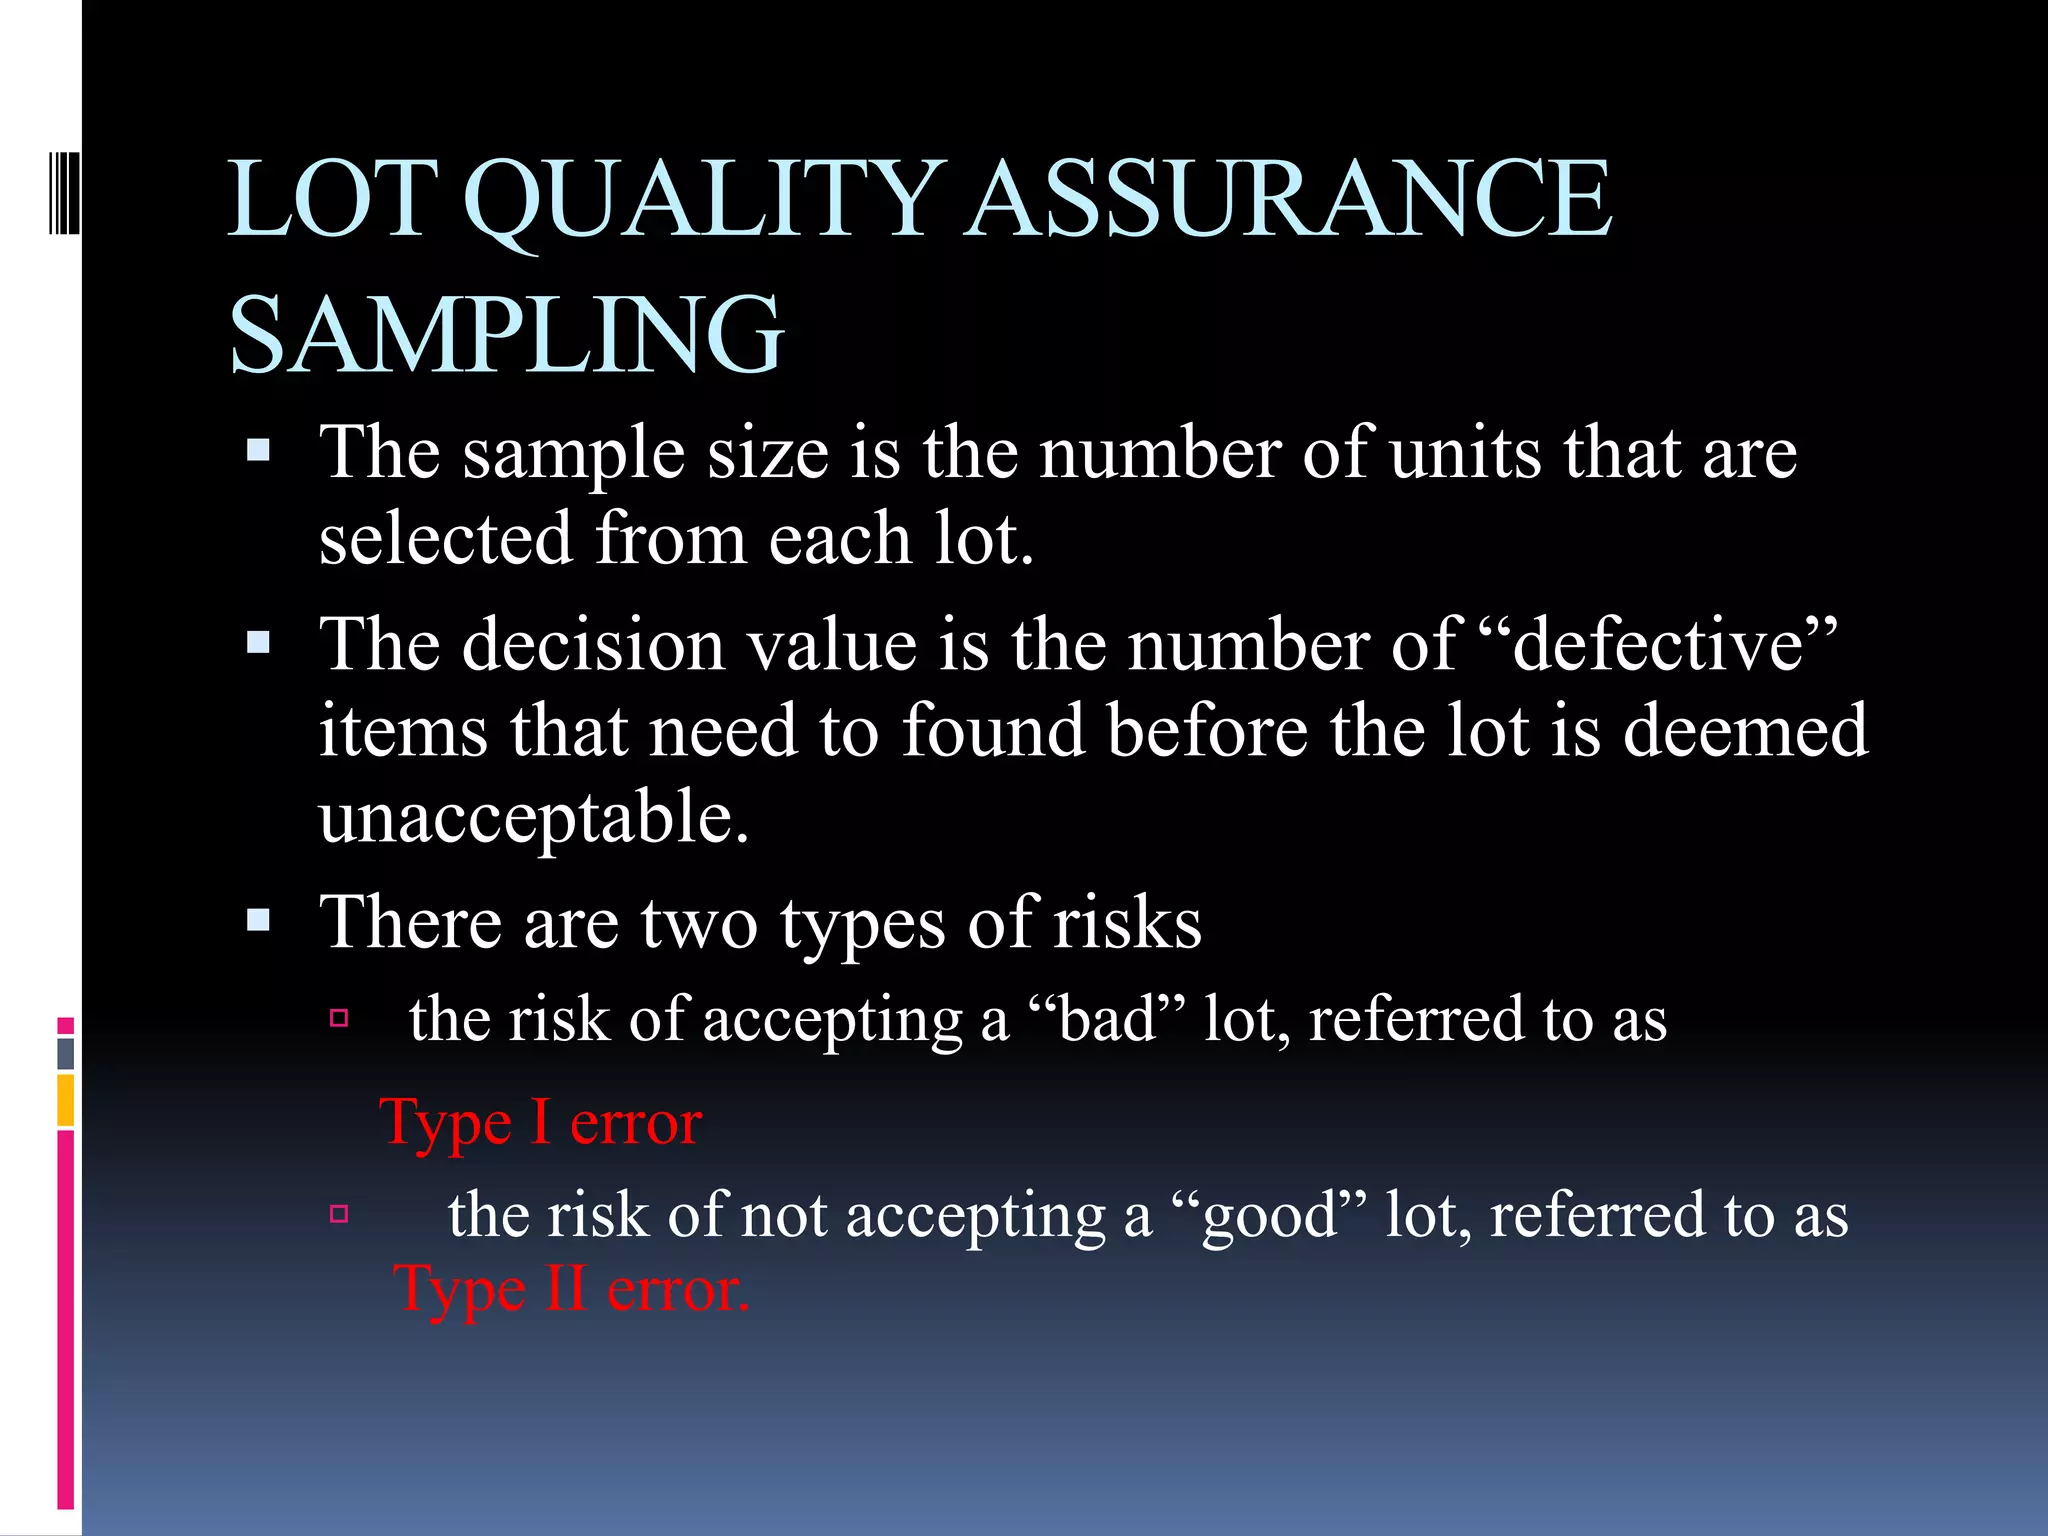
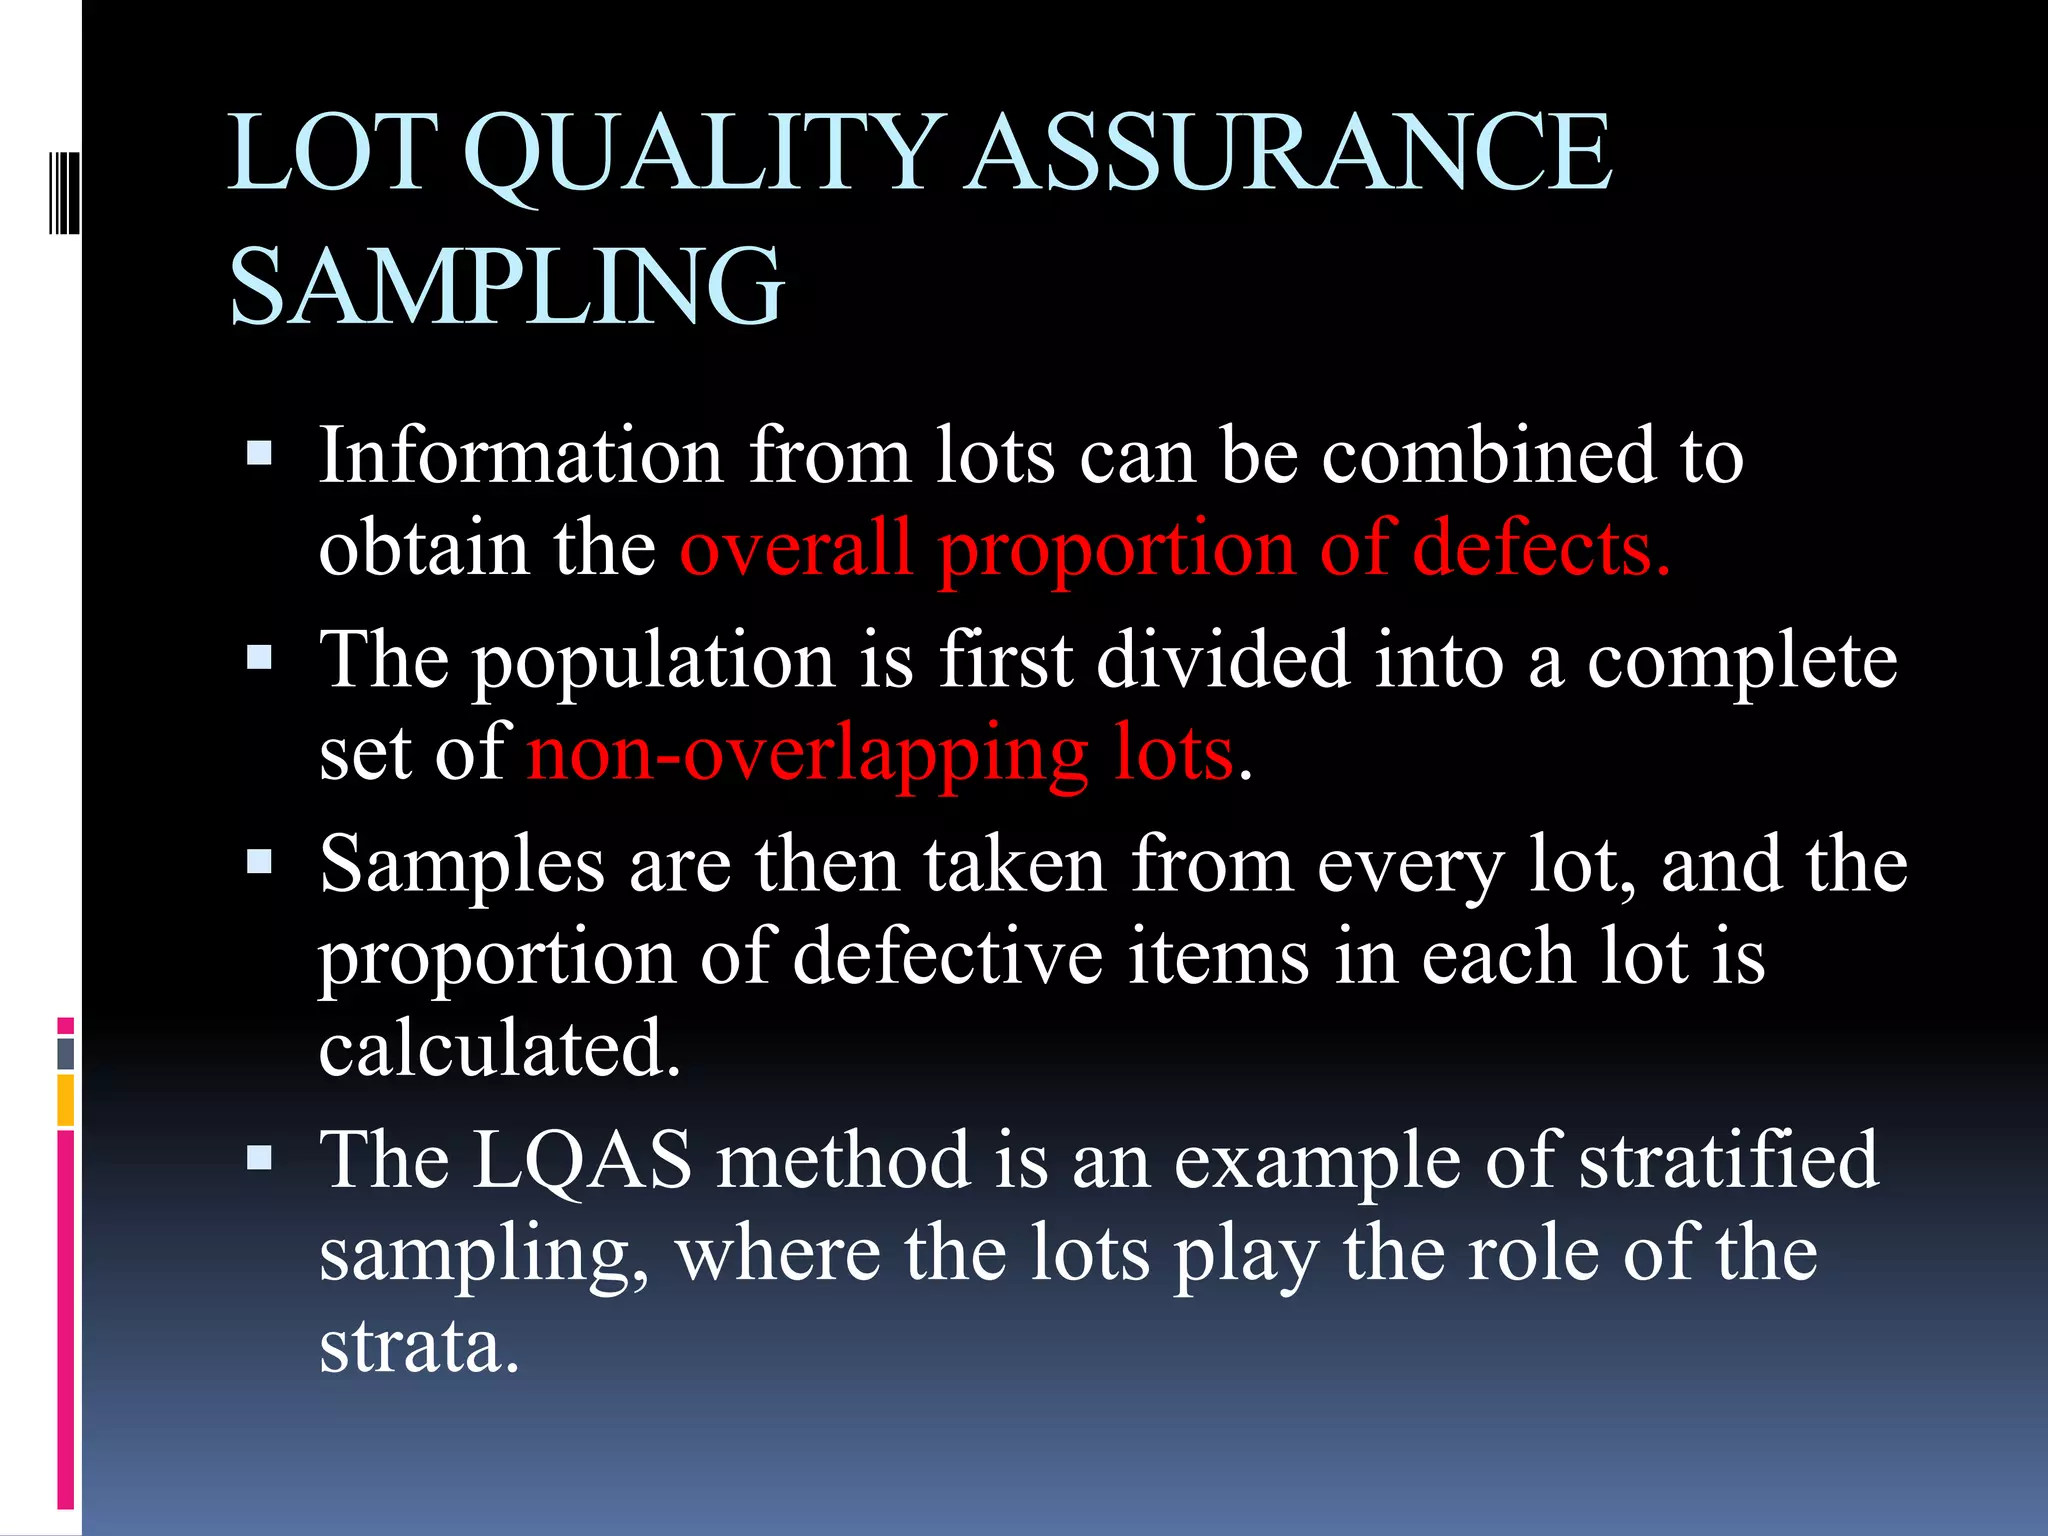
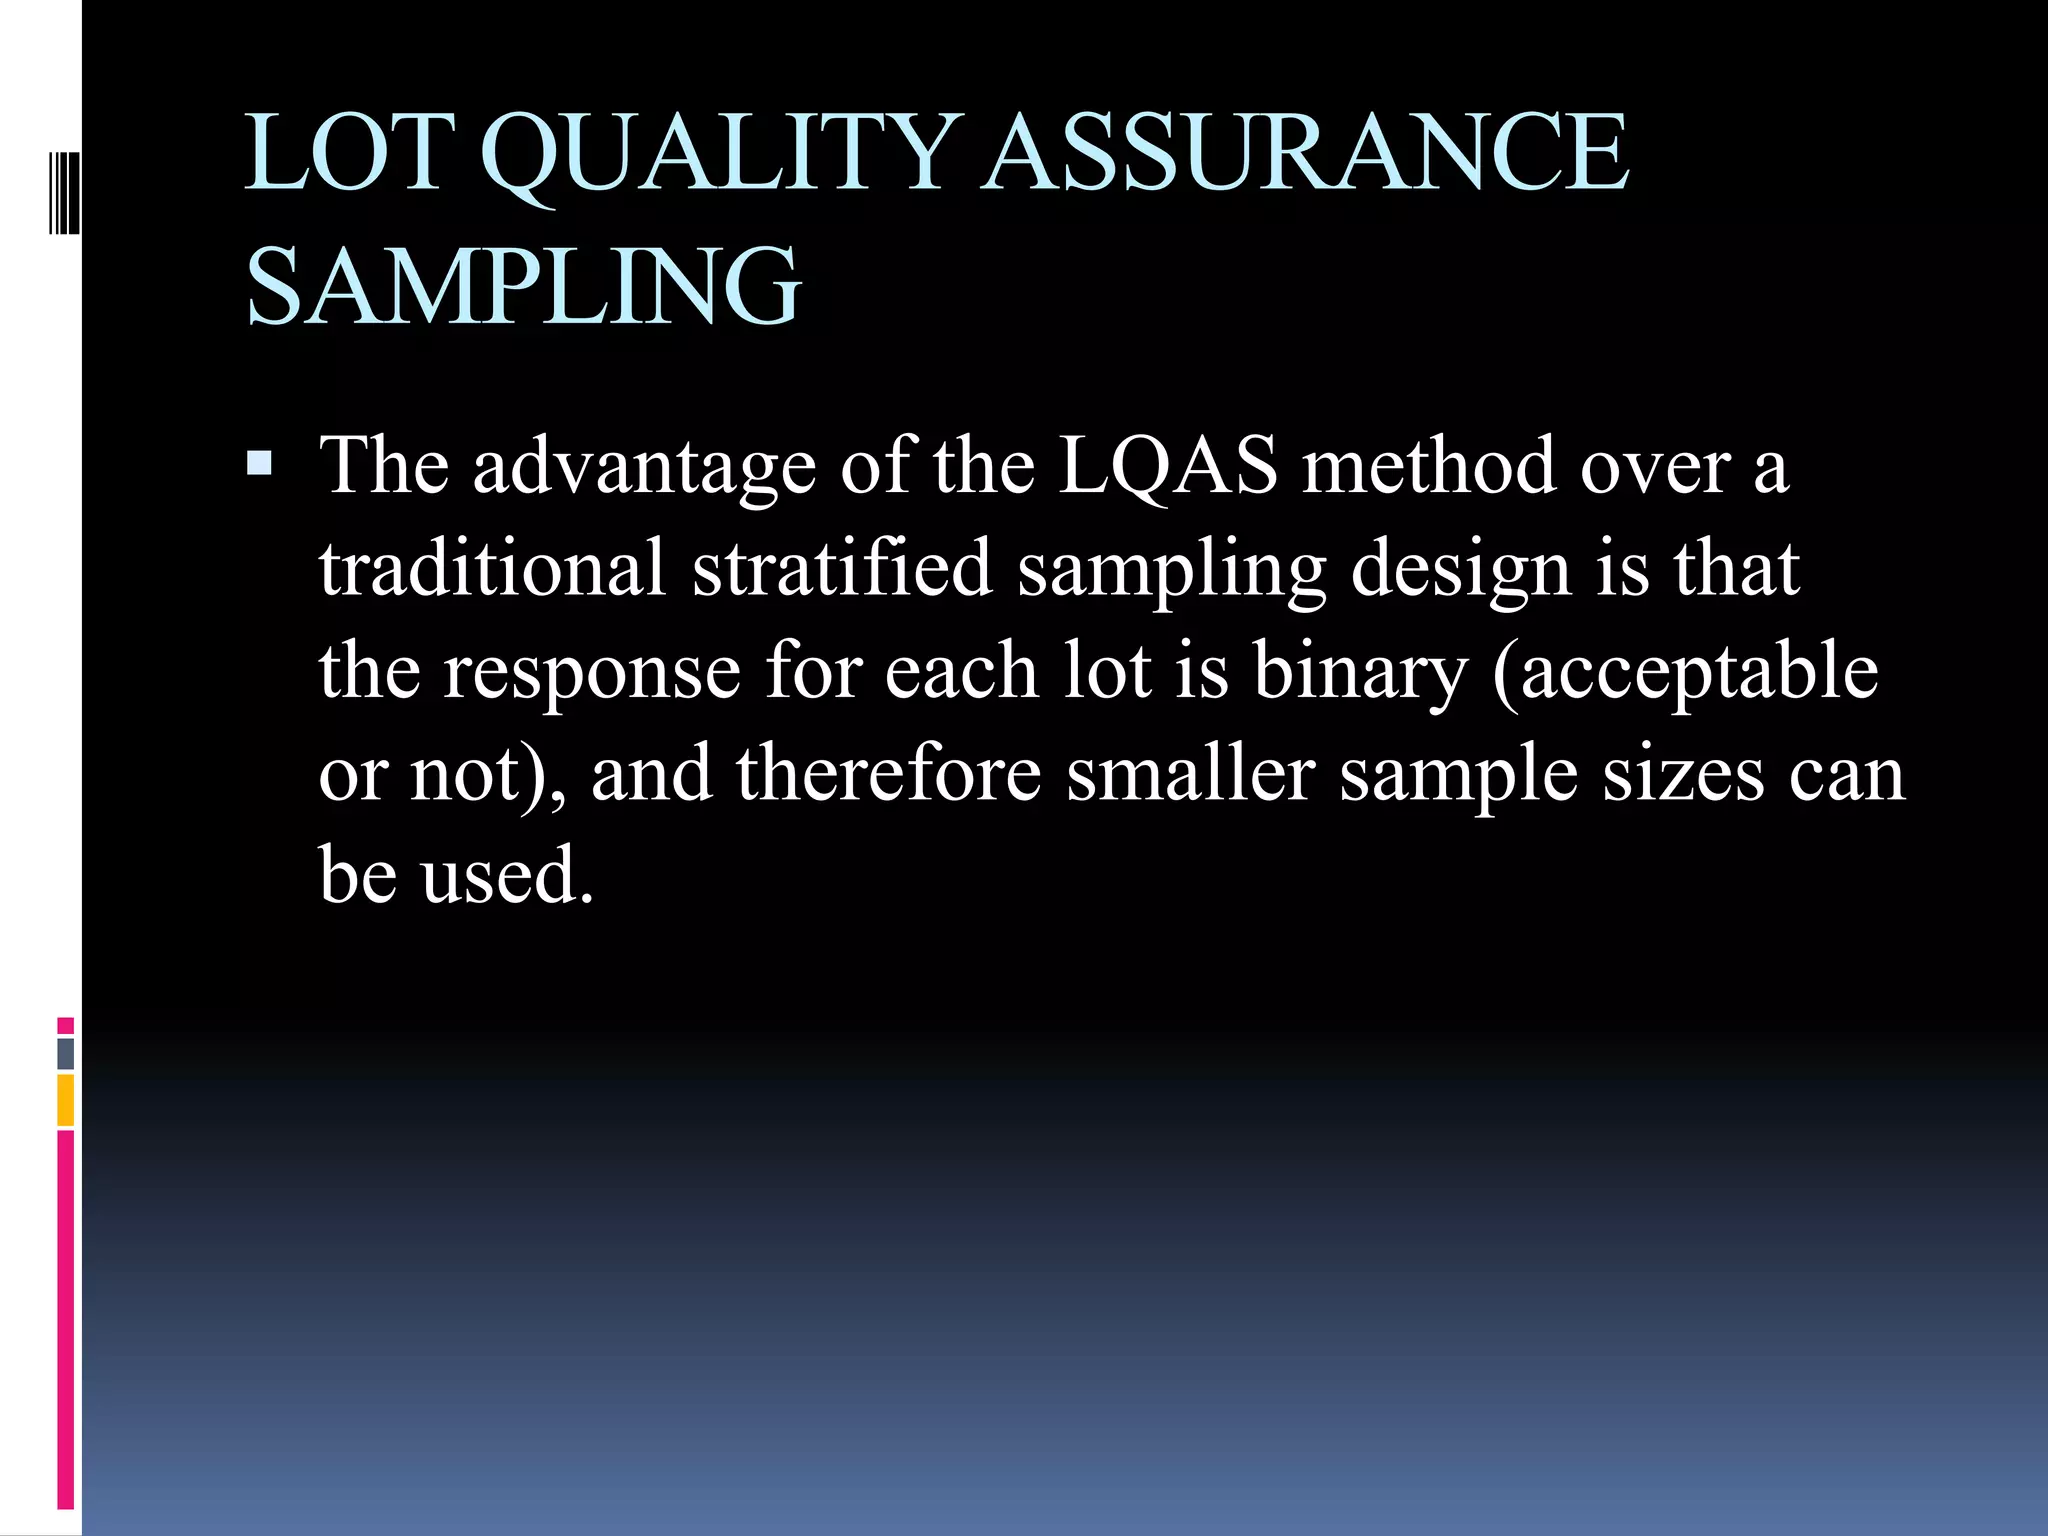
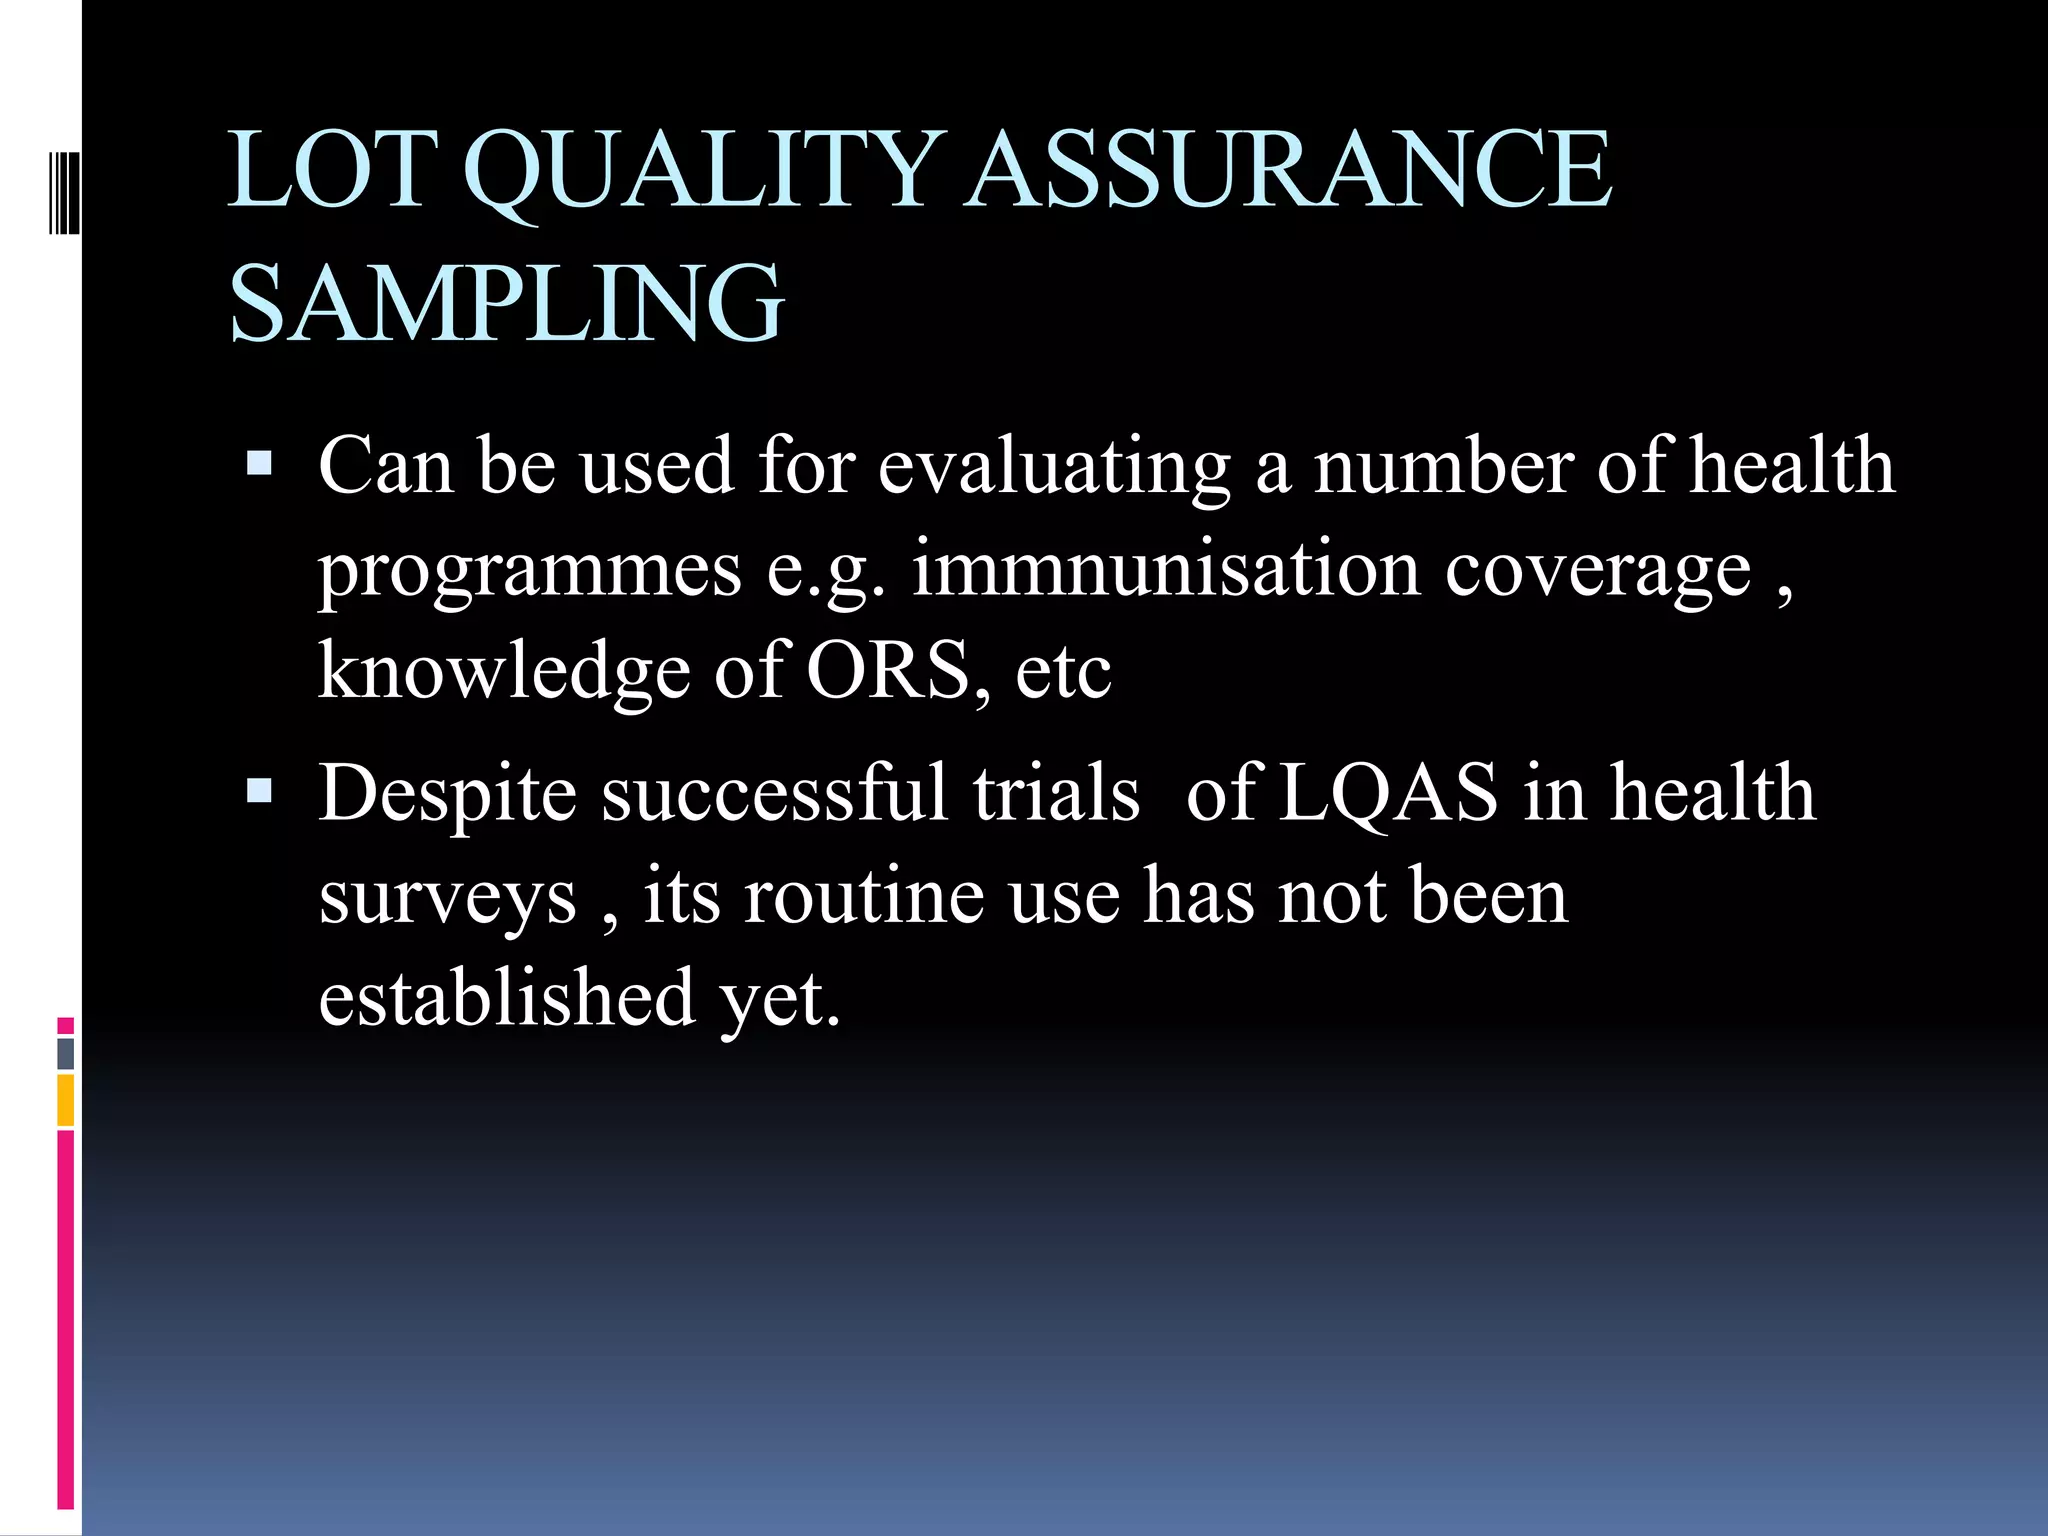
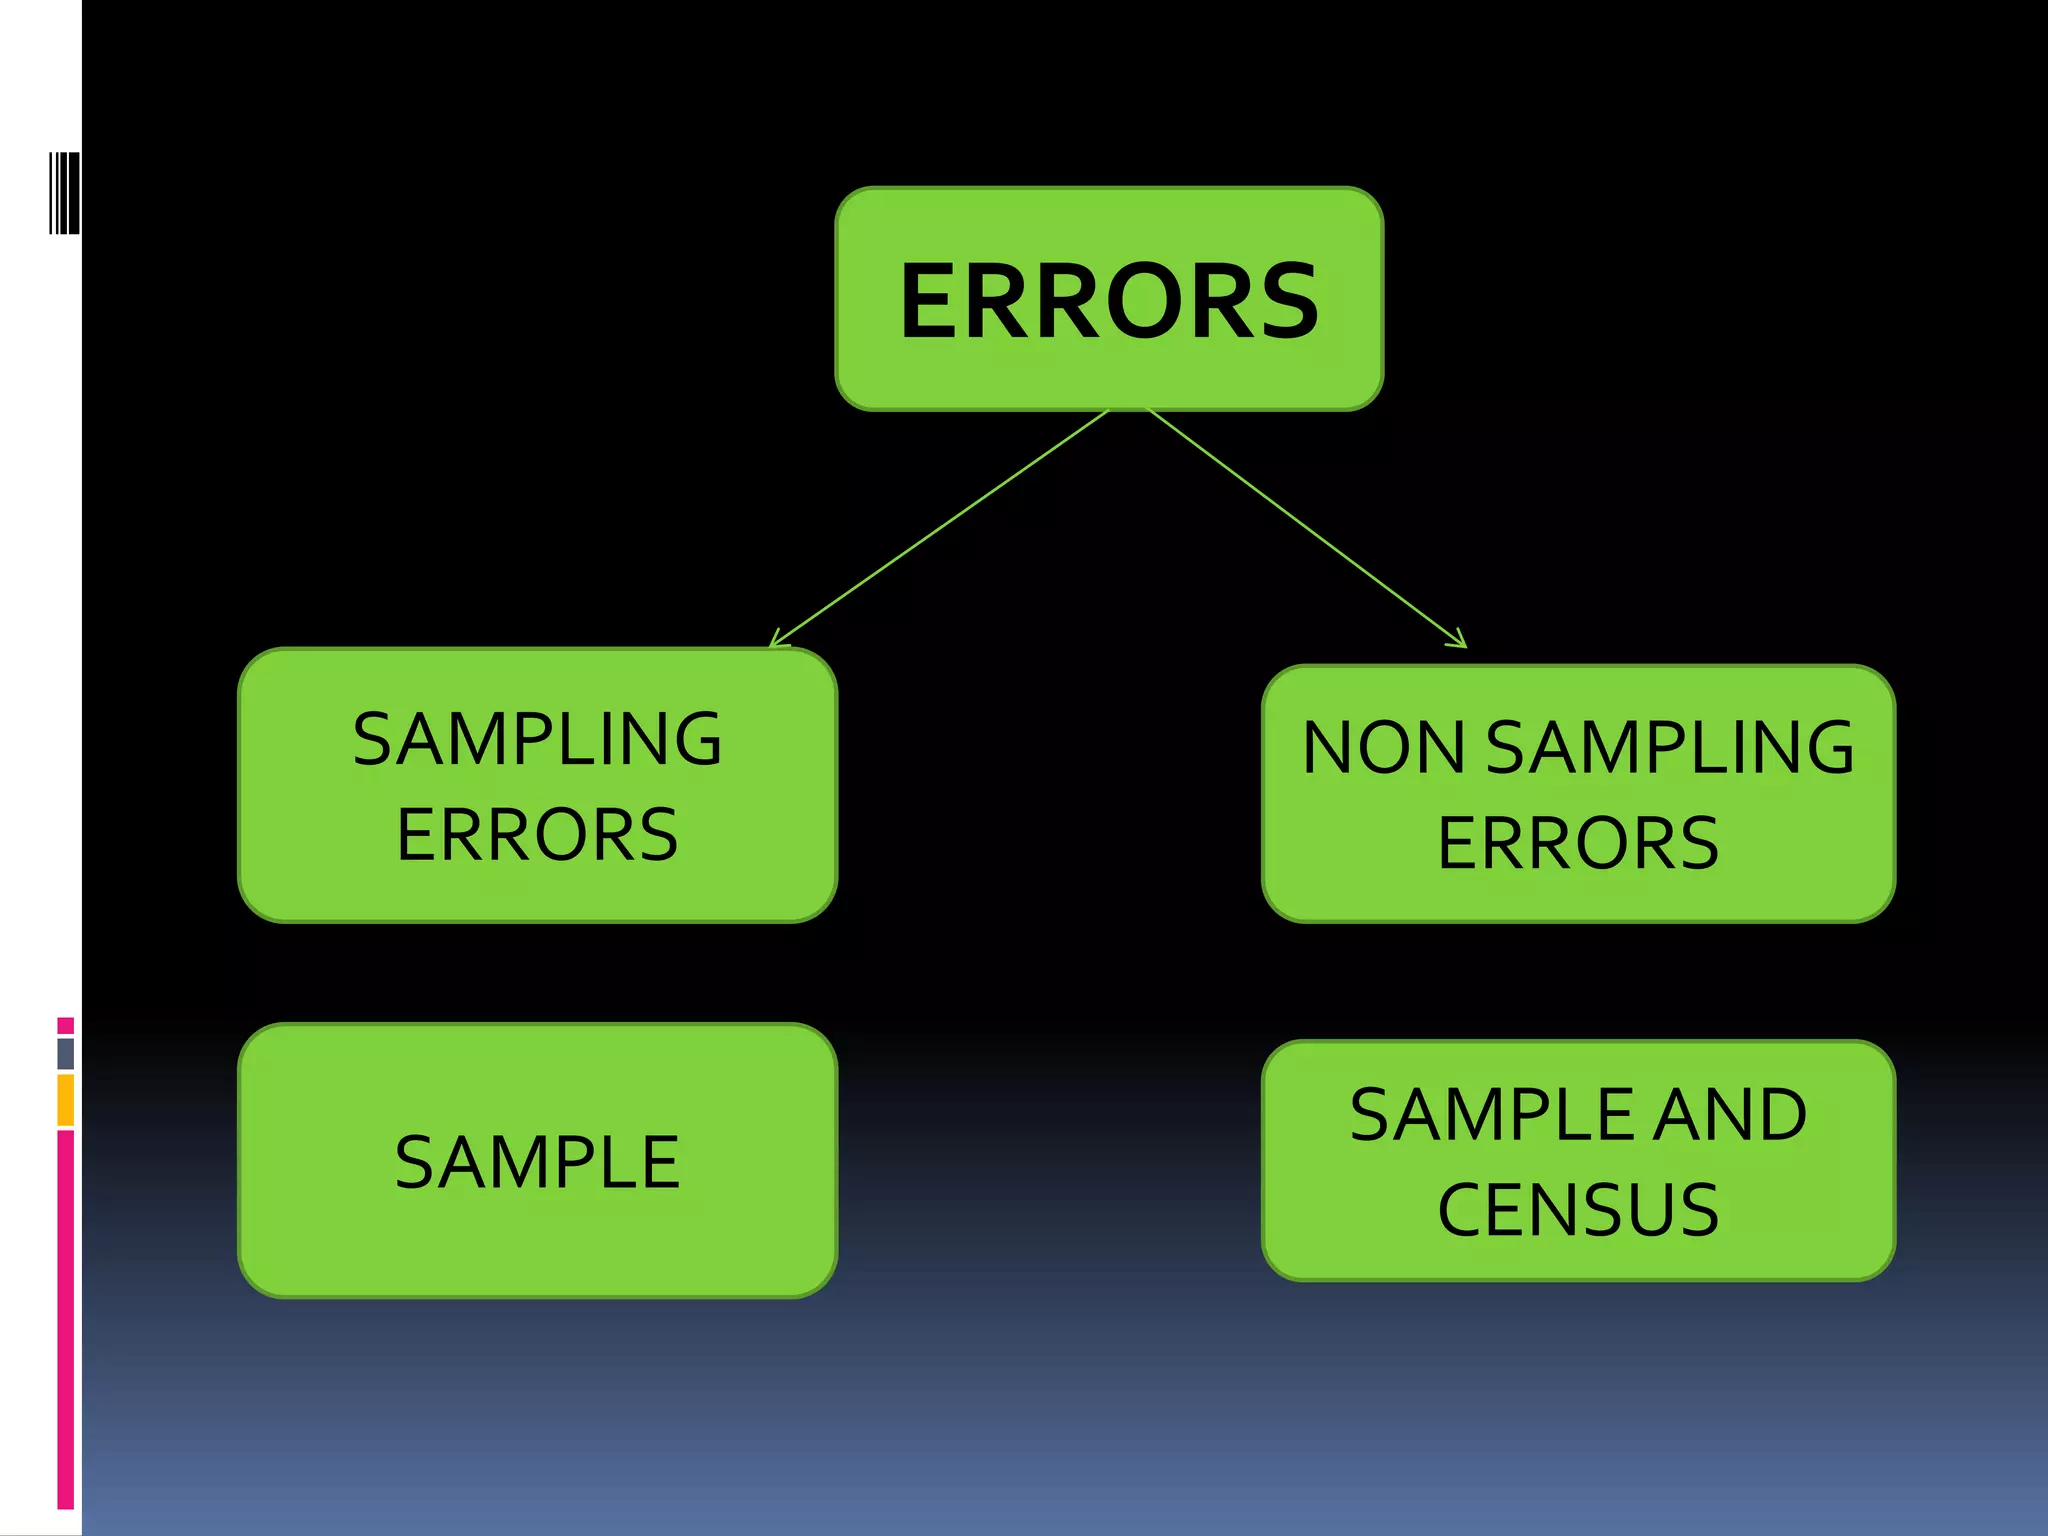
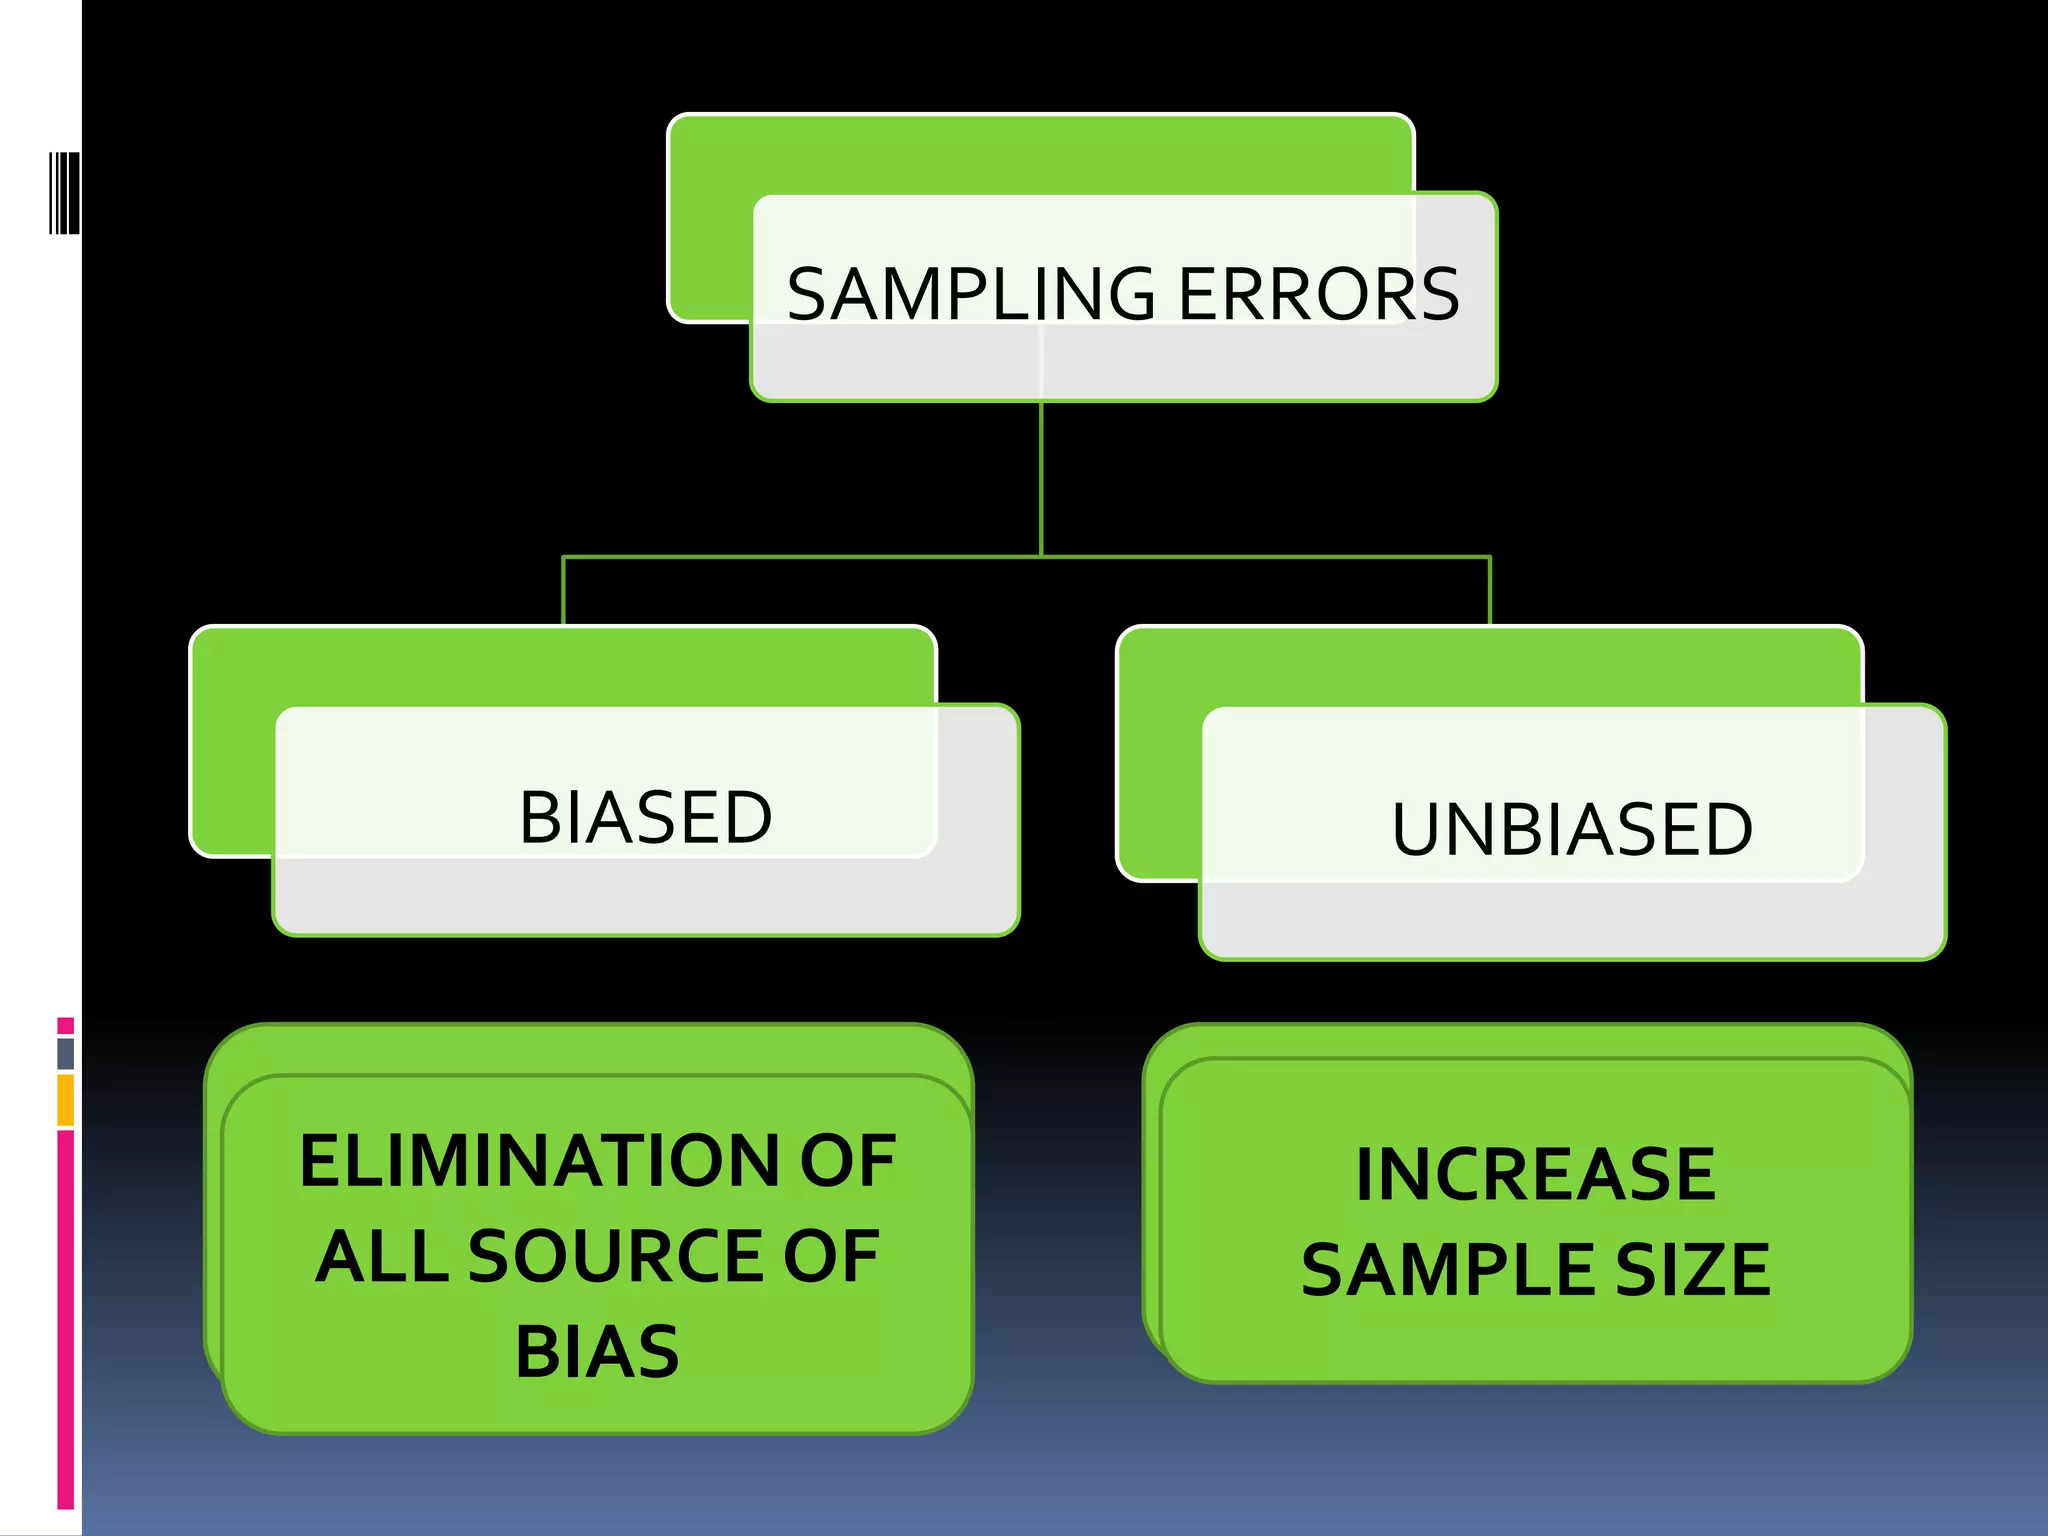
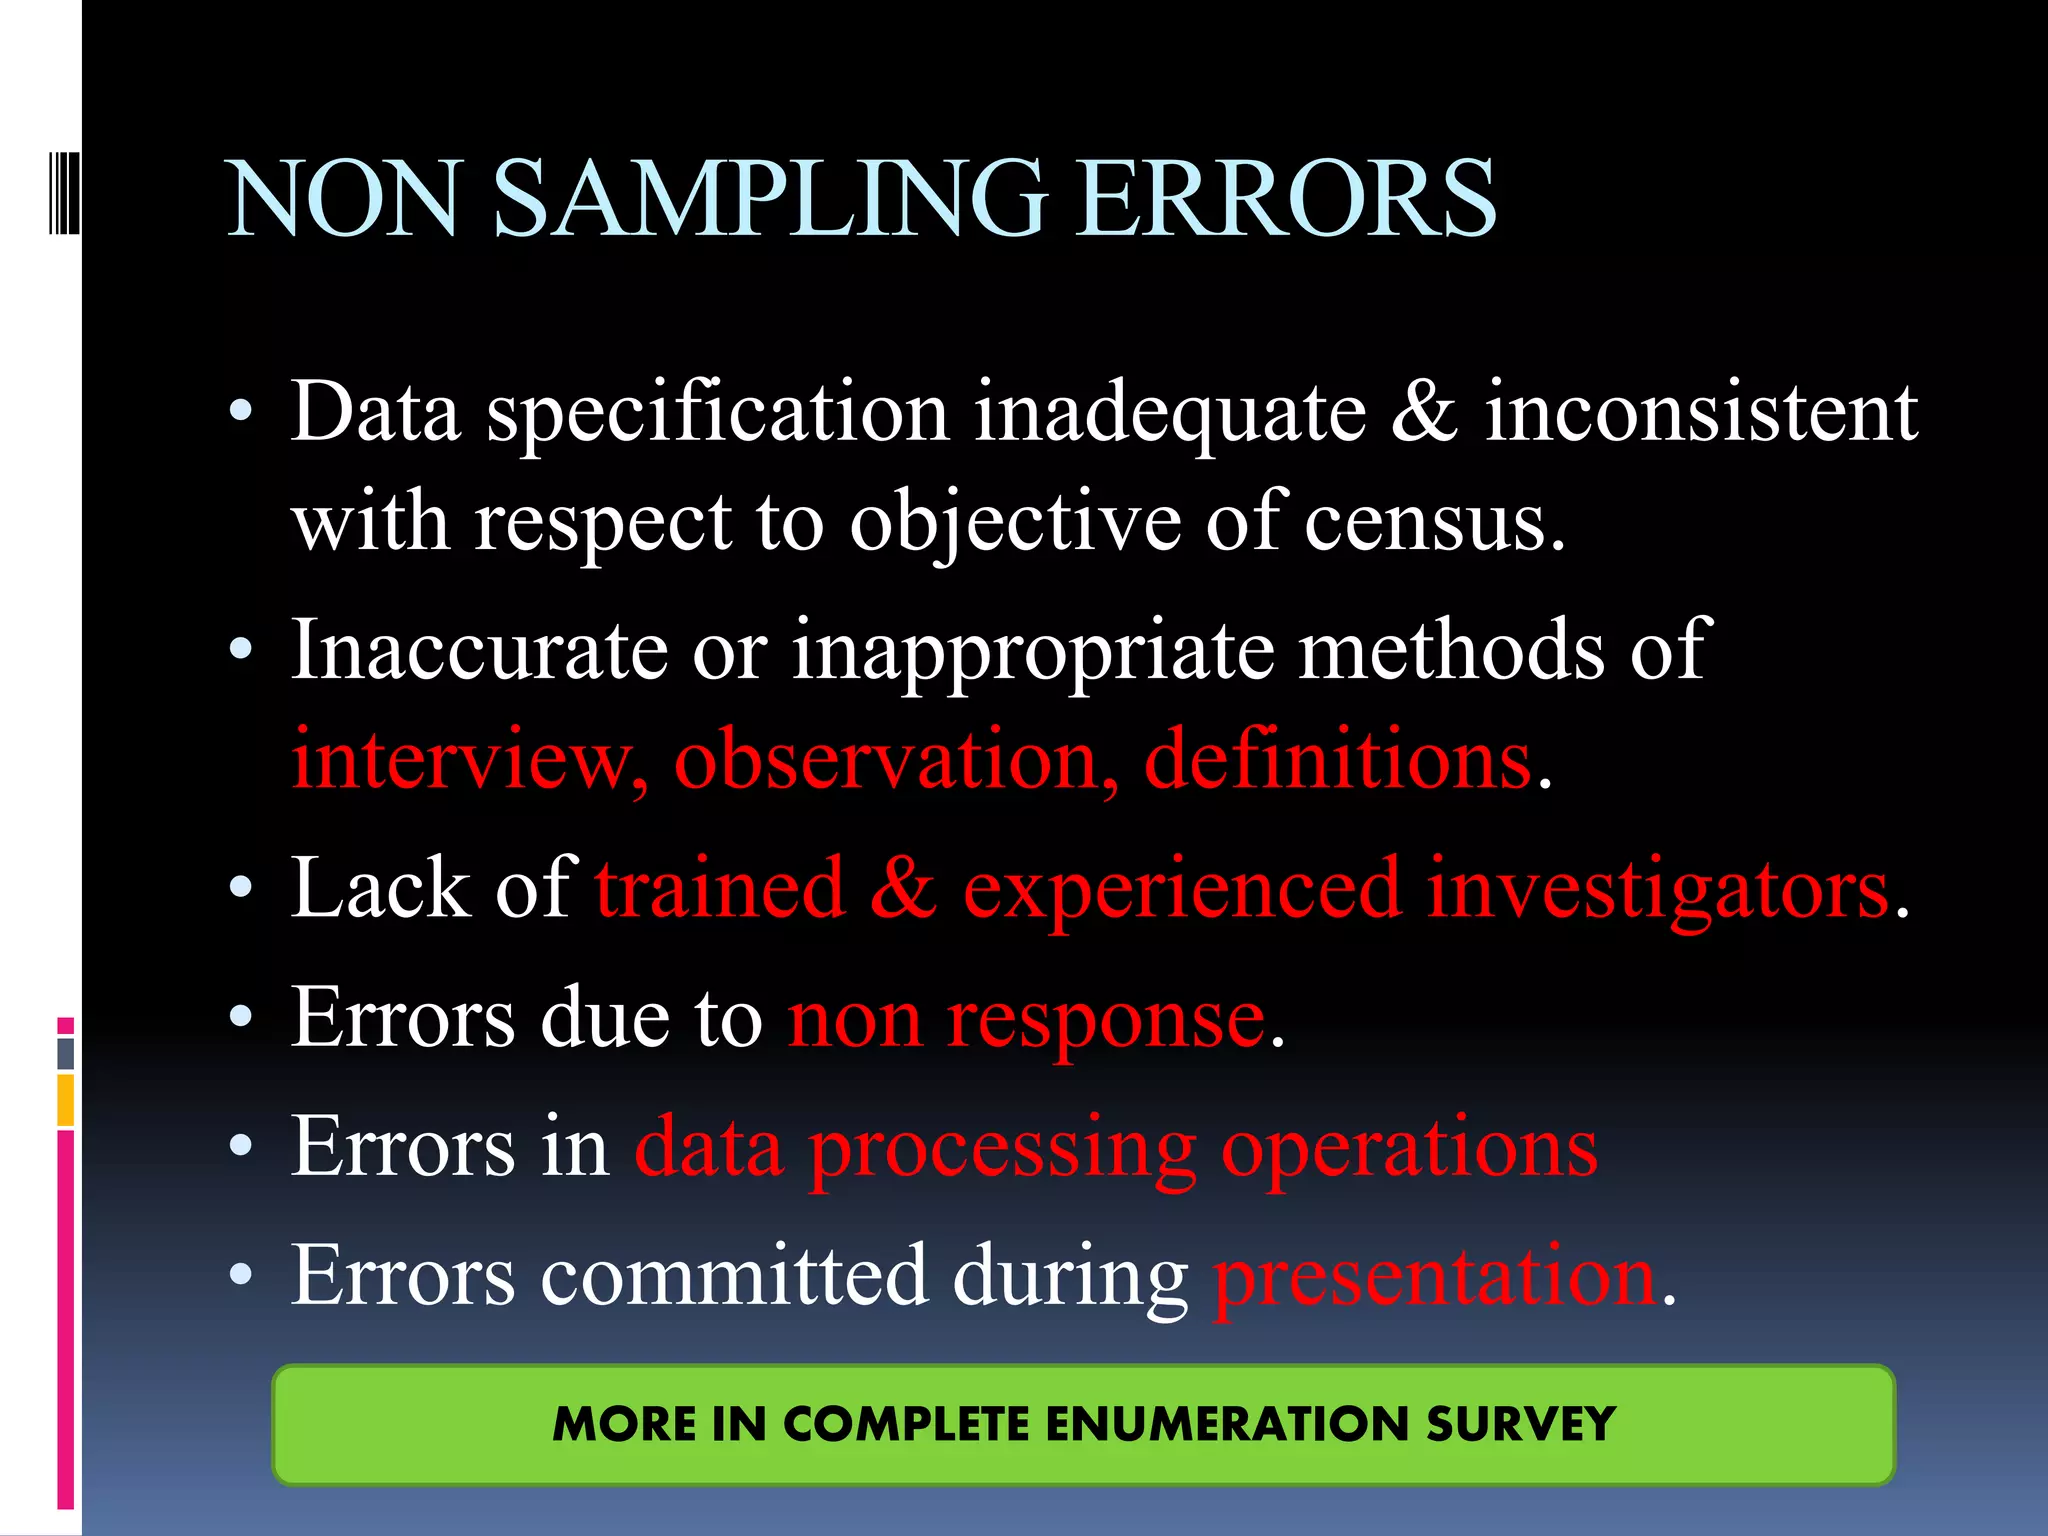


This document provides an overview of sampling techniques. It defines key sampling terms like population, sample, sampling frame, and discusses the need for sampling due to constraints of time and money for a full census. The document outlines different sampling methods like simple random sampling, stratified sampling, cluster sampling and multistage sampling. It also discusses non-probability sampling techniques like convenience sampling and snowball sampling. The document emphasizes the importance of representativeness, adequacy and independence for a good sample. It concludes by noting sources of error in sampling like sampling errors and non-sampling errors.


![sampling[1].pptx](https://cdn.slidesharecdn.com/ss_thumbnails/sampling1-220819060046-600e7719-thumbnail.jpg?width=640&height=640&fit=bounds)


![SAMPLING_POWERPOINT[1] h.pptx on popoulation](https://cdn.slidesharecdn.com/ss_thumbnails/samplingpowerpoint1h-250414080939-ebb0ef87-thumbnail.jpg?width=640&height=640&fit=bounds)


