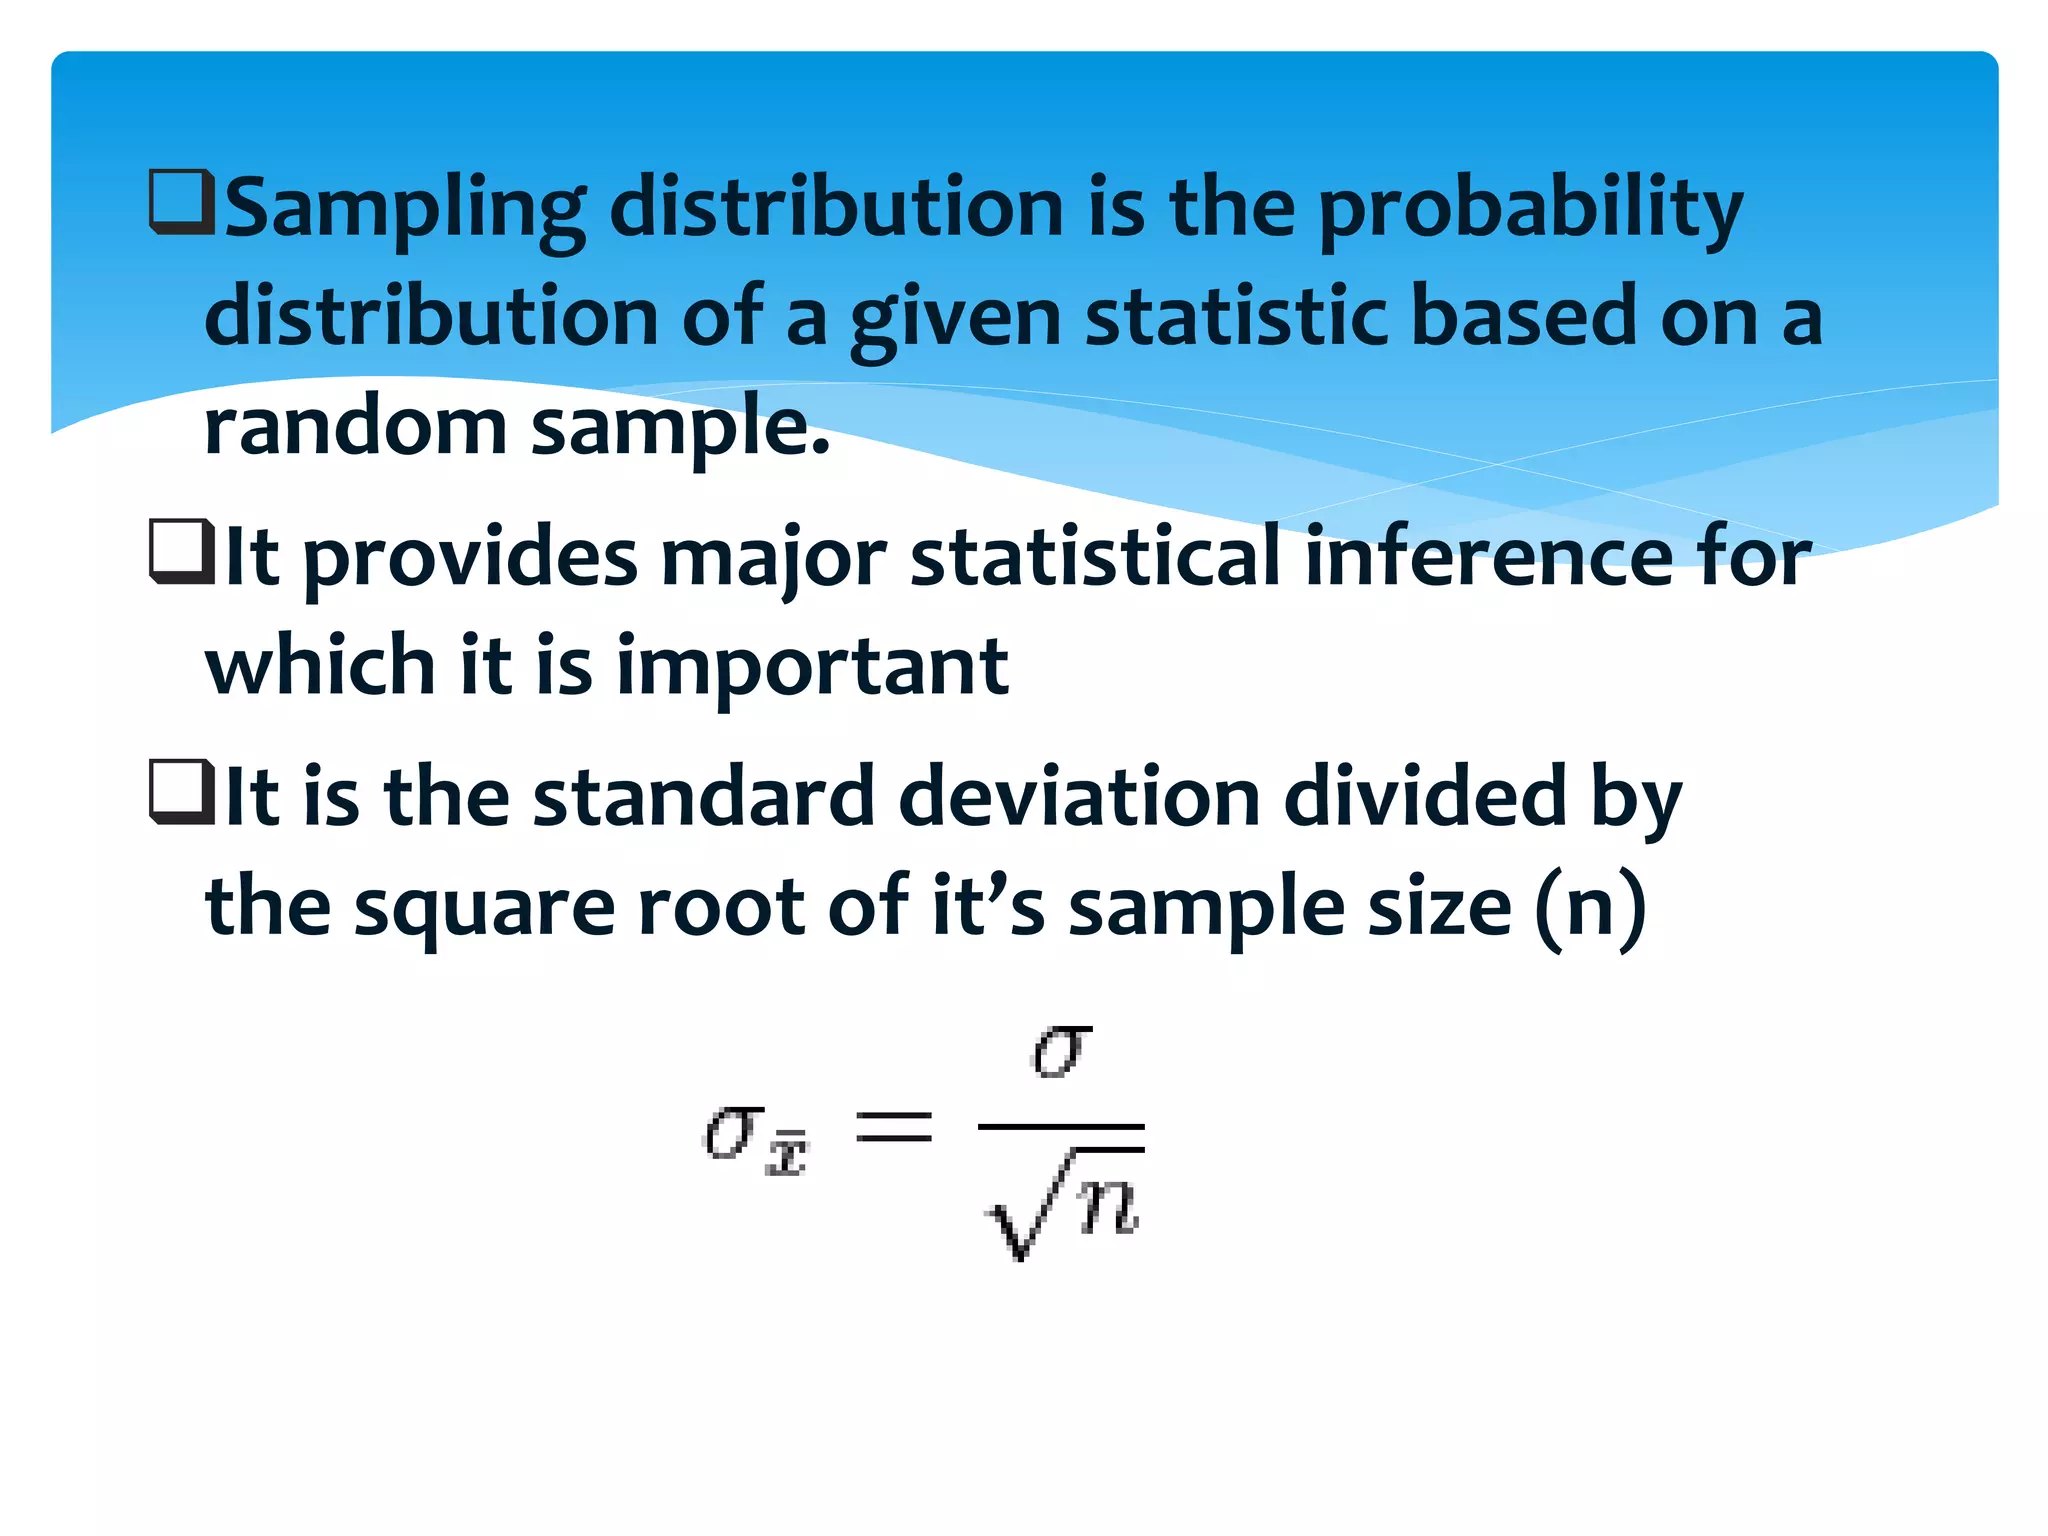
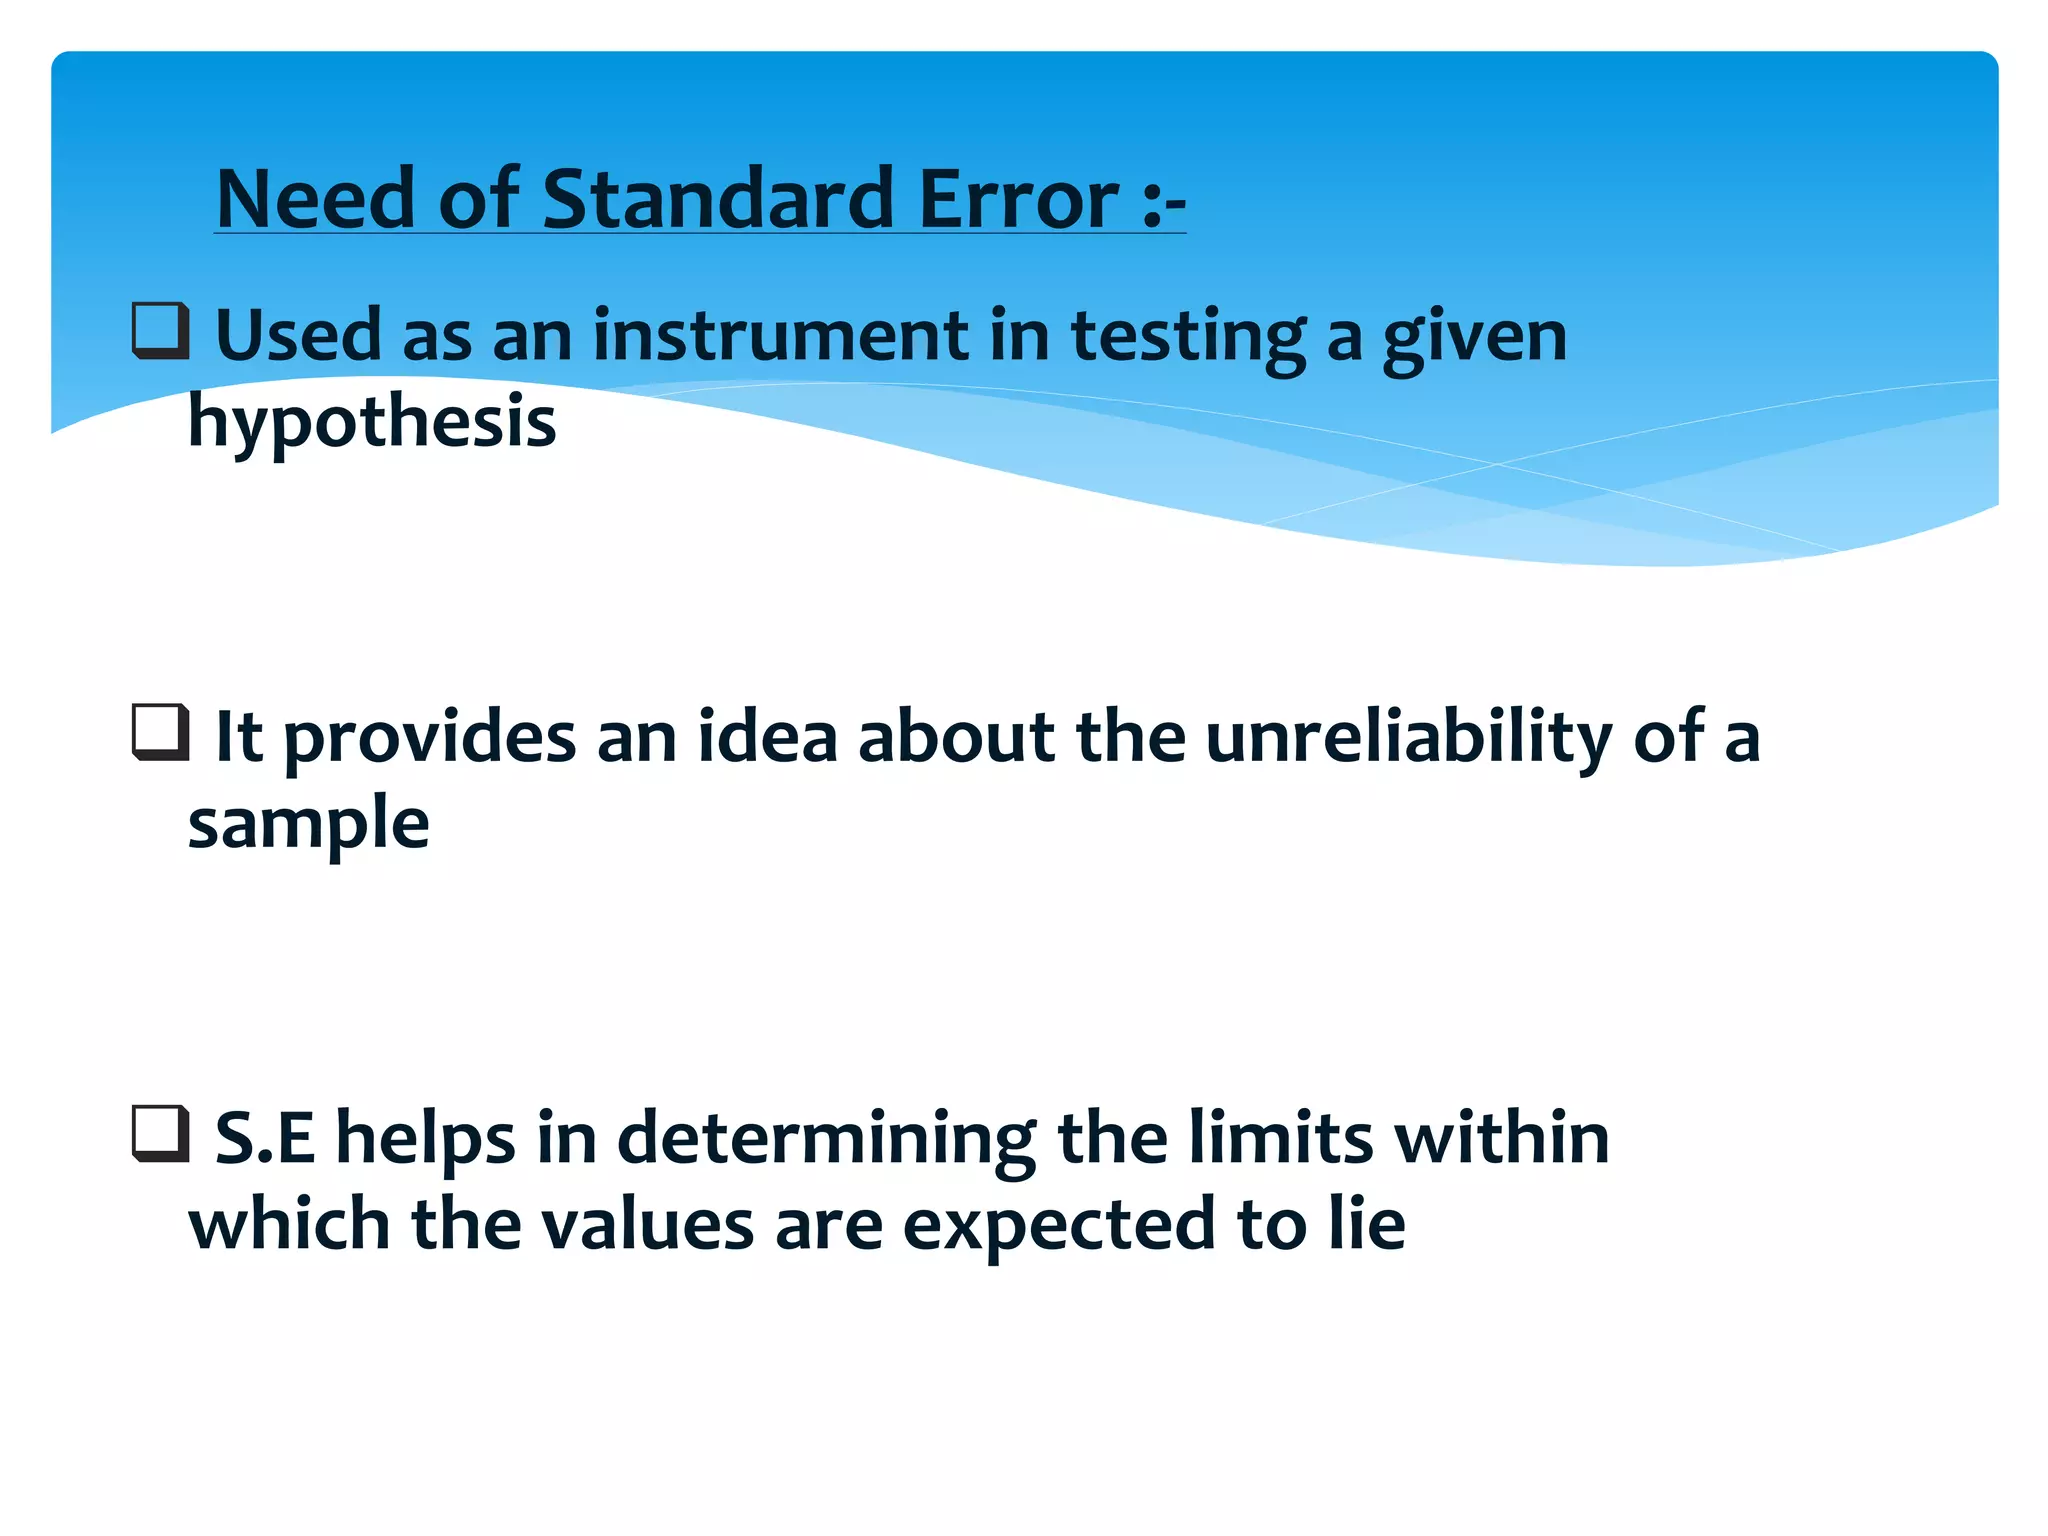
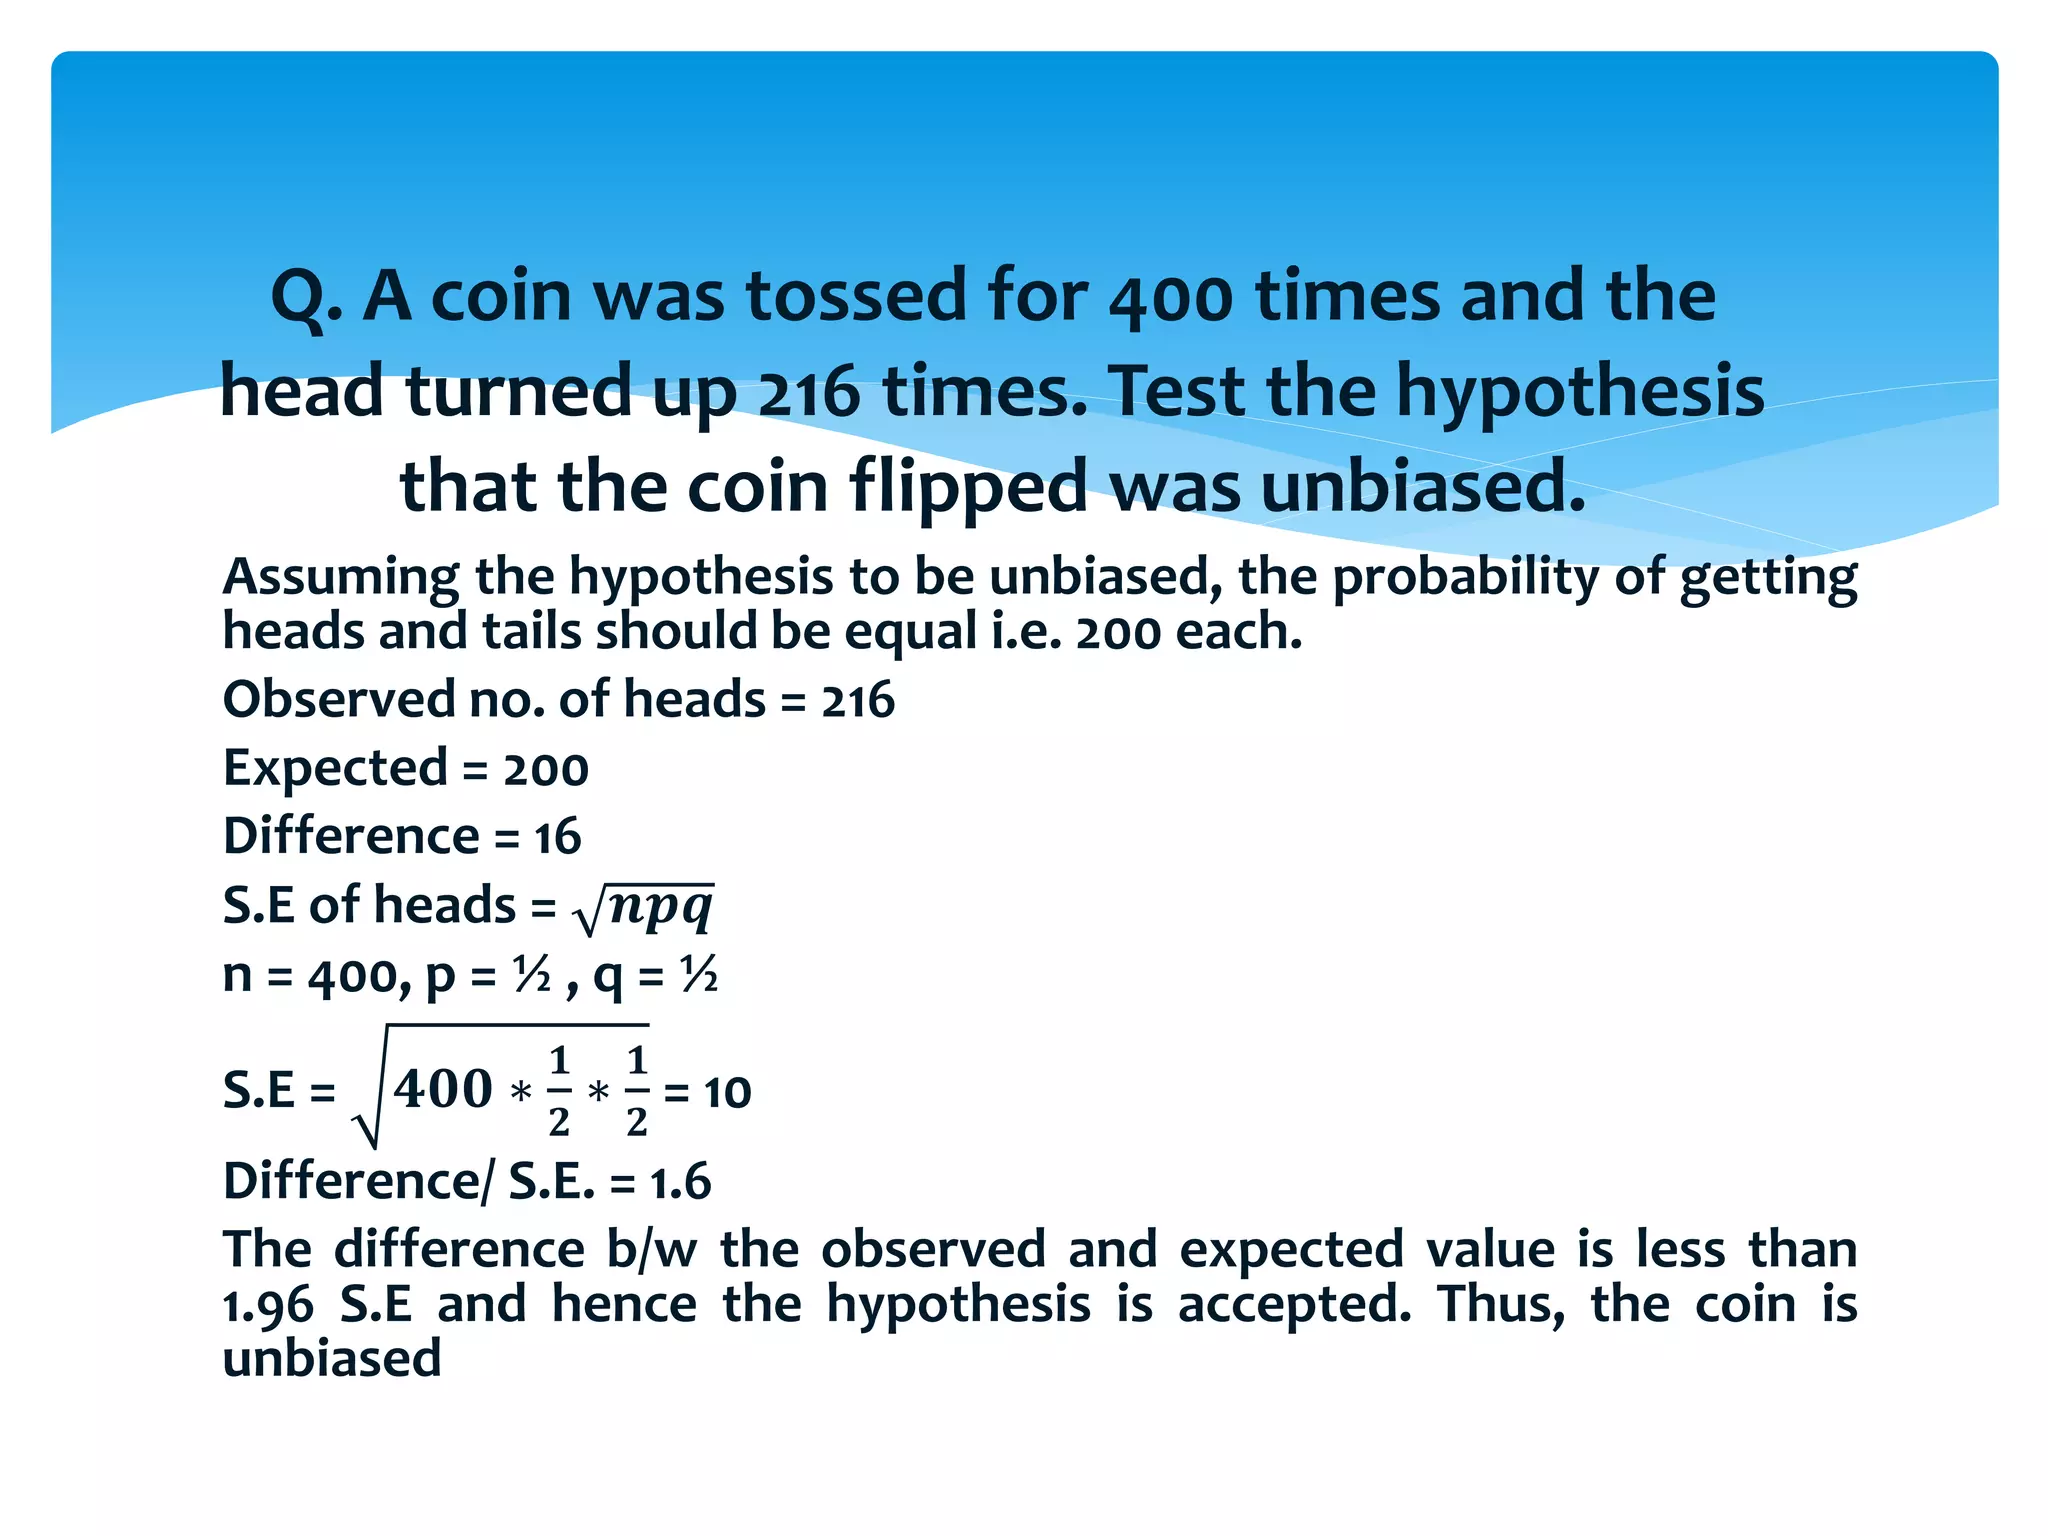
Satyaki Aparajit Mishra presented on the topic of standard error and predictability limits. Standard error is used to estimate the standard deviation from a sample. It is calculated by dividing the standard deviation by the square root of the sample size. A larger standard error means the sample mean is less reliable at estimating the population mean. Standard error helps determine how far sample estimates may be from the true population values. Mishra discussed estimating standard error from a single sample and how standard error is used to test hypotheses. He provided an example of testing if a coin flip was unbiased using the standard error of the proportion of heads observed.
![Standard error[1] :-
The standard error (SE) is the standard
deviation of the sampling distribution of
a statistical mean.
It is used to refer to an estimate of the
standard deviation, derived from a
particular sample to compute the
estimate.](https://image.slidesharecdn.com/biostatseminarsatyaki-151112150111-lva1-app6892/75/Standard-error-2-2048.jpg)
![ The standard deviation represented by the
Greek letter sigma, σ is a measure that is
used to quantify the amount of variation or
dispersion of a set of data values.
Standard deviation & Sample
distribution[1] :-](https://image.slidesharecdn.com/biostatseminarsatyaki-151112150111-lva1-app6892/75/Standard-error-3-2048.jpg)
![
Estimating Standard Error [1]:-
In actual research, we rarely have the resources
to draw multiple samples from a population to
estimate standard error.
Instead, we typically draw just one sample and
estimate the standard error from this sample.
We estimate the standard error by dividing the
standard deviation (i.e., the distribution of
observations) by the square root of the sample
size.](https://image.slidesharecdn.com/biostatseminarsatyaki-151112150111-lva1-app6892/75/Standard-error-6-2048.jpg)
![JOURNAL REVIEWS :-
Inappropriate use of standard error of the mean when reporting
variability of study samples: A critical evaluation of four selected
journals of obstetrics and gynaecology[3]](https://image.slidesharecdn.com/biostatseminarsatyaki-151112150111-lva1-app6892/75/Standard-error-10-2048.jpg)
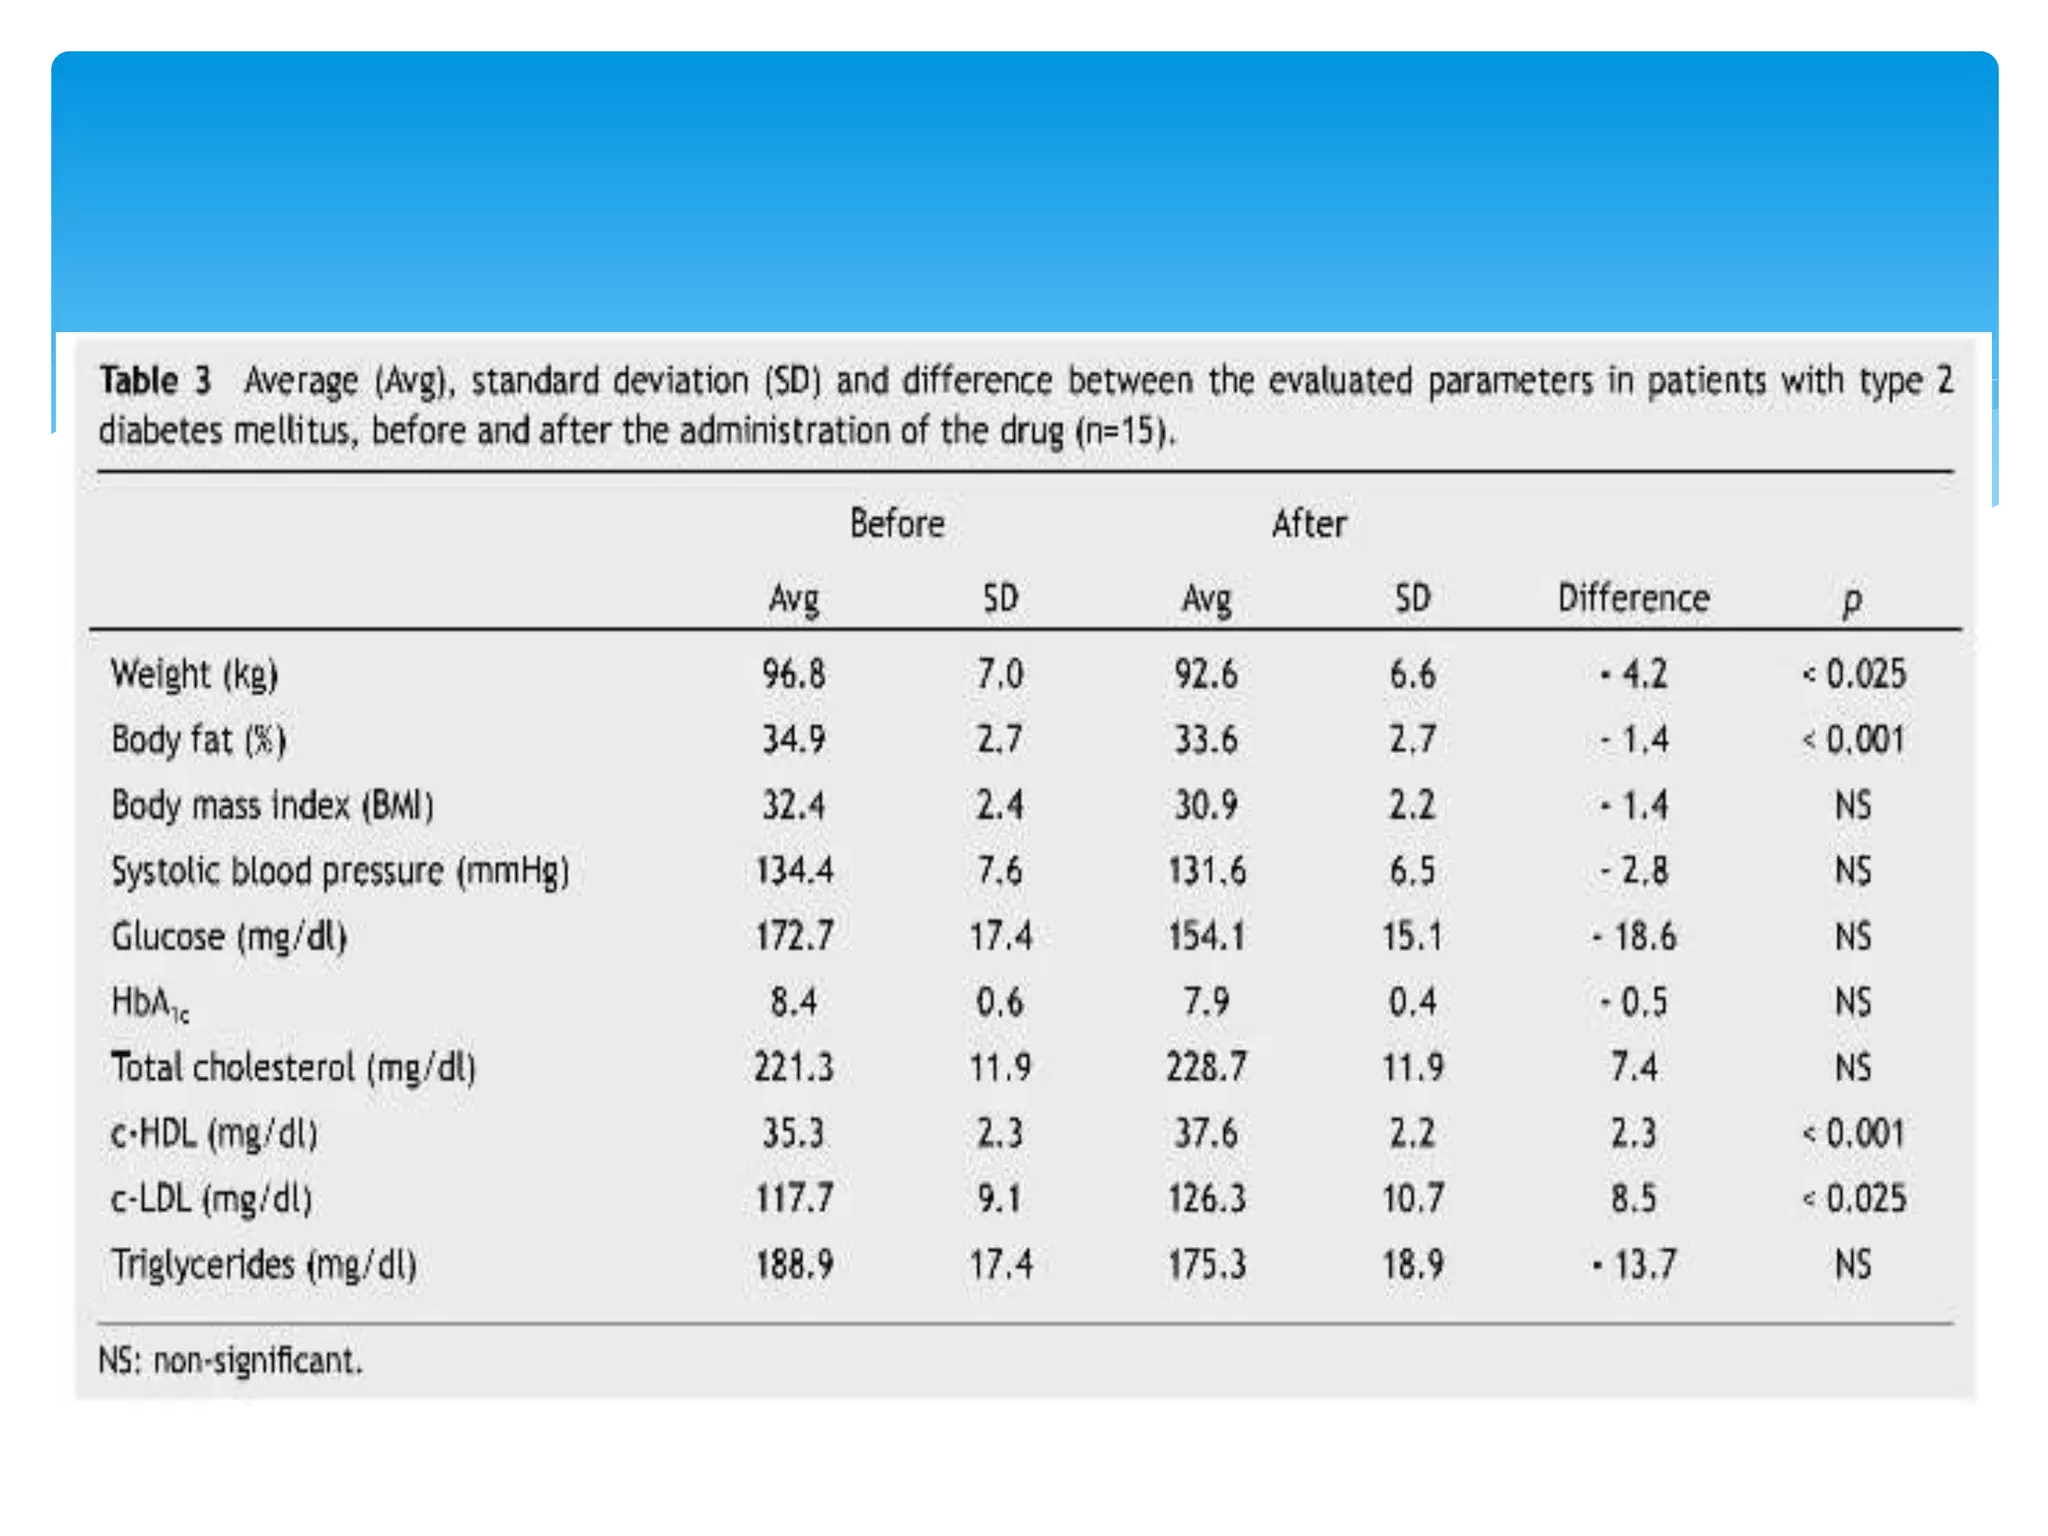
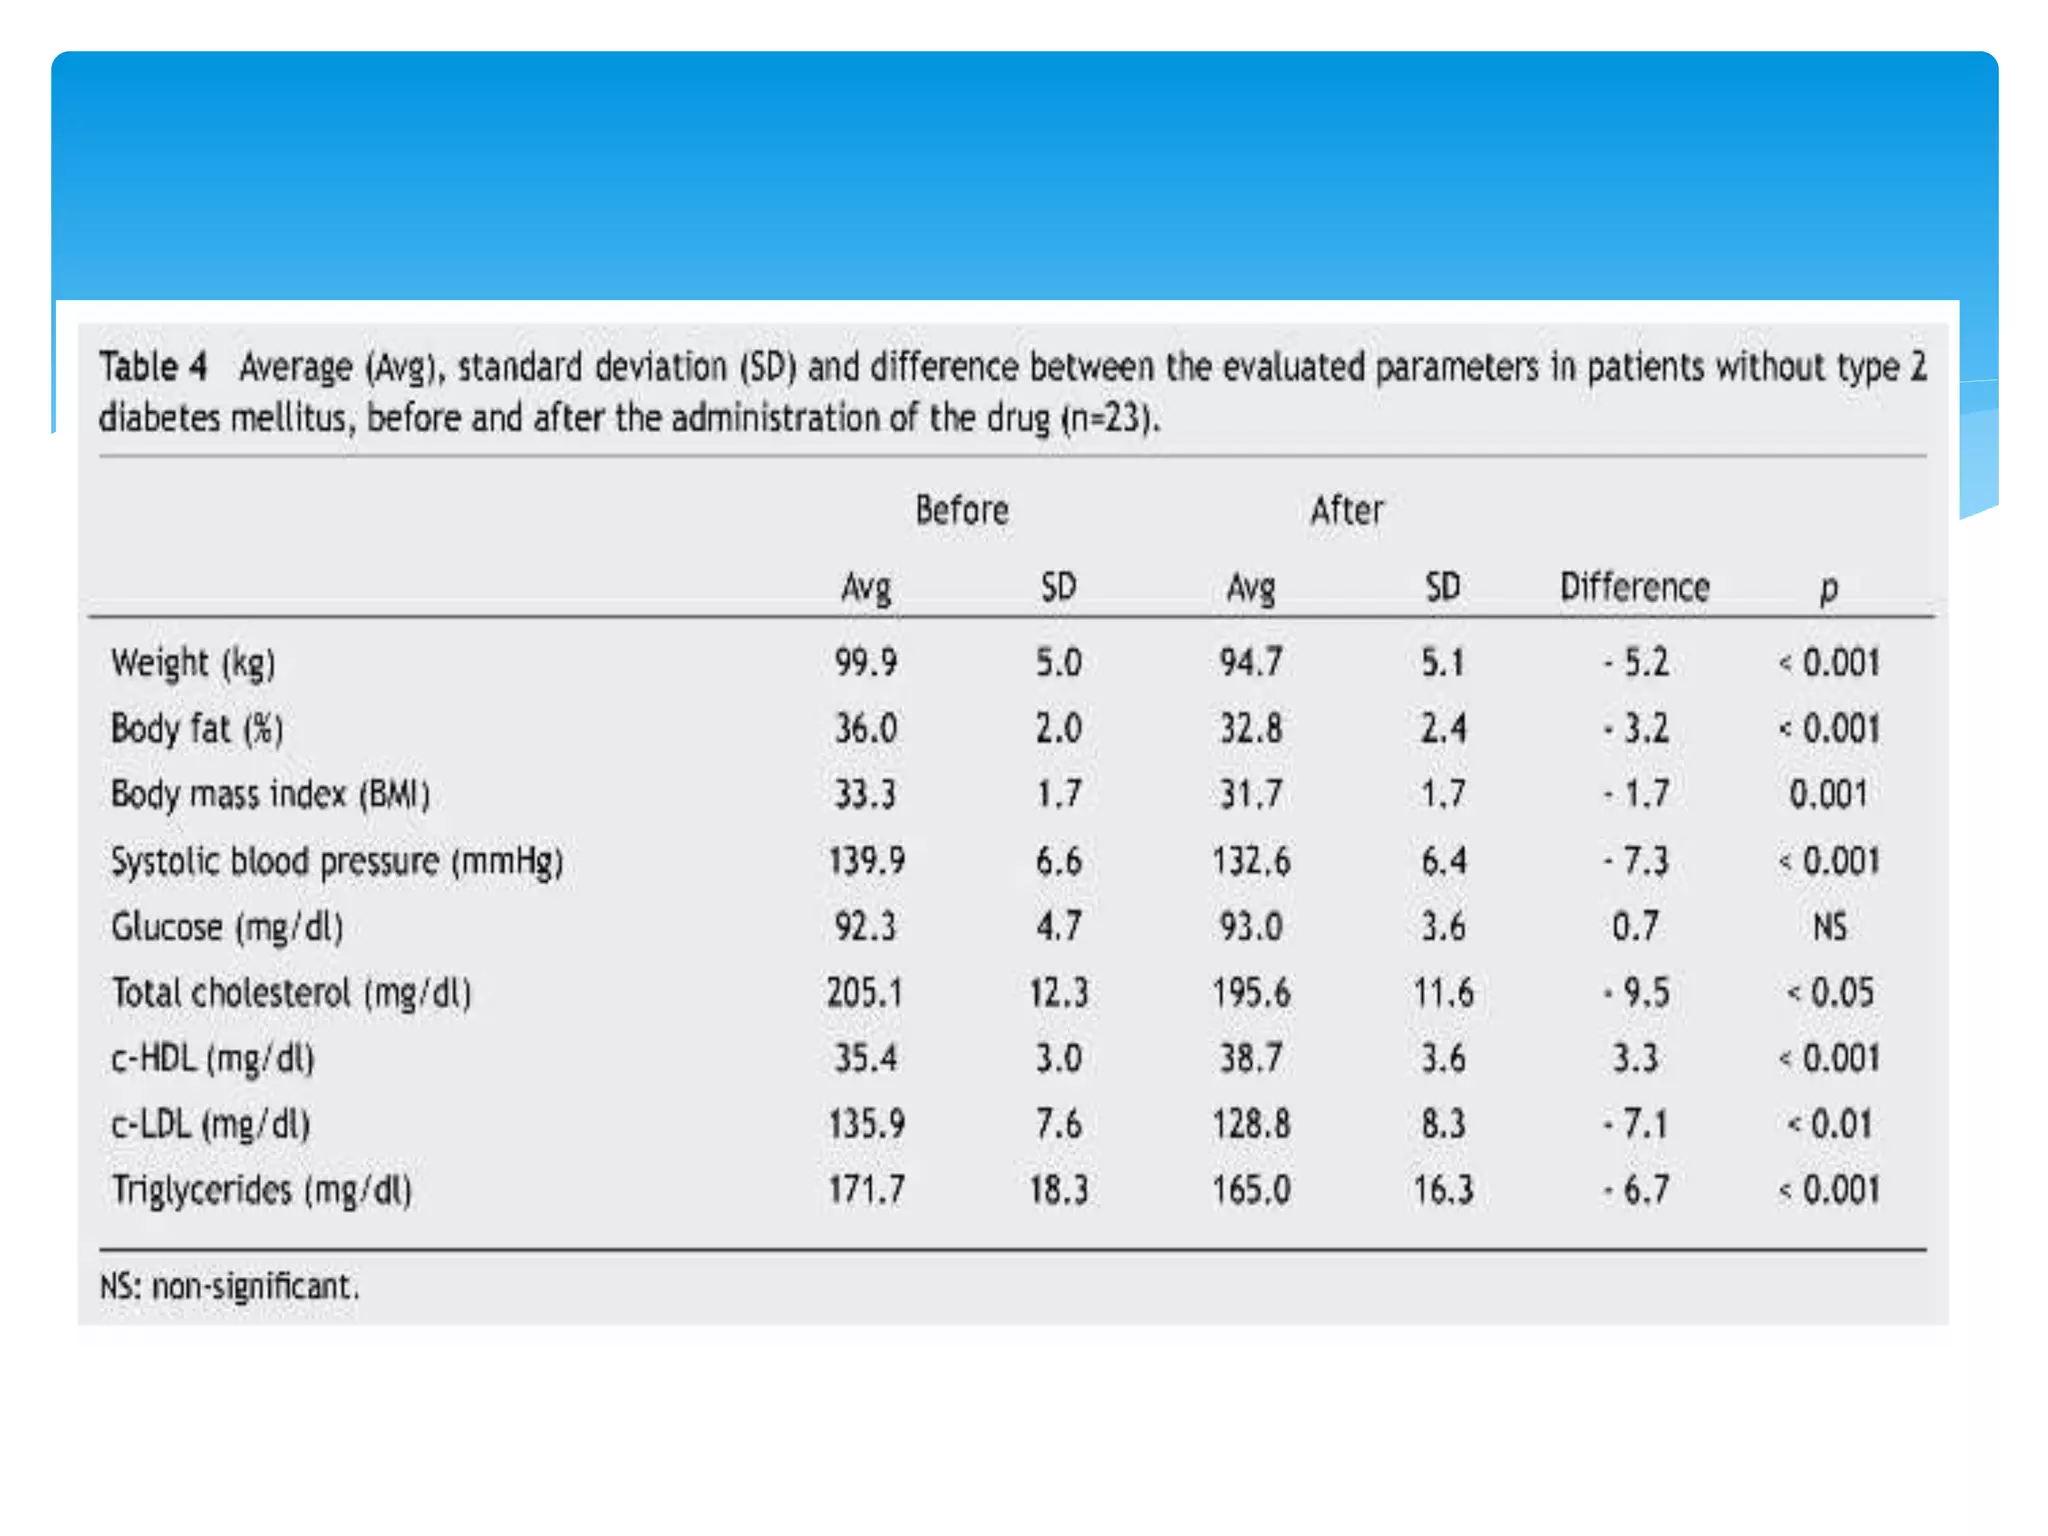
![Effects of liraglutide on weight reduction and metabolic
parameters in obese patients with and without type 2
diabetes mellitus [2]
García-Cantú E. et al](https://image.slidesharecdn.com/biostatseminarsatyaki-151112150111-lva1-app6892/75/Standard-error-11-2048.jpg)
![1. Gupta S.P. ; Statistical Methods ; 42nd Revised Edition, 2012
(Reprint 2013) Page 889-910[1]
2. García-Cantú E. A. , Alvarado-Saldaña H. H. , Támez-Pérez H.
E. , G. Rubio-Aguilar ; Medicina Universitaria; Effects of
liraglutide on weight reduction and metabolic parameters
in obese patients with and without type - 2 diabetes
mellitus ; Vol. 16 ; Núm. 63 ; June 2014 [2]
3. Wen-Ru Ko, Wei-Te Hung, Hui-Chin Chang, Long-Yau Lin ;
Inappropriate use of standard error of the mean when
reporting variability of study samples: A critical evaluation
of four selected journals of obstetrics and gynaecology ;
Taiwanese Journal of Obstetrics & Gynaecology 53 (2014)
26e29 [3]
References :-](https://image.slidesharecdn.com/biostatseminarsatyaki-151112150111-lva1-app6892/75/Standard-error-15-2048.jpg)