1. Daily Technical Outlook
11th October 2012
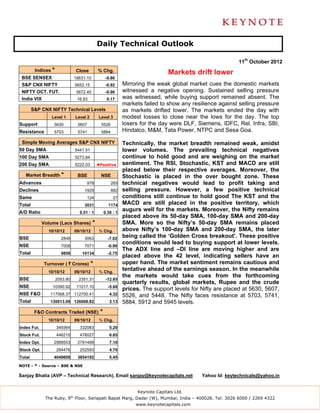
Indices * Close % Chg. Markets drift lower
BSE SENSEX 18631.10 -0.86
S&P CNX NIFTY 5652.15 -0.92 Mirroring the weak global market cues the domestic markets
NIFTY OCT. FUT. 5672.45 -0.90 witnessed a negative opening. Sustained selling pressure
India VIX 16.83 0.17 was witnessed, while buying support remained absent. The
markets failed to show any resilience against selling pressure
S&P CNX NIFTY Technical Levels as markets drifted lower. The markets ended the day with
Level 1 Level 2 Level 3 modest losses to close near the lows for the day. The top
Support 5630 5607 5526 losers for the day were DLF, Siemens, IDFC, Rel. Infra, SBI,
Resistance 5703 5741 5884 Hindalco, M&M, Tata Power, NTPC and Sesa Goa.
Simple Moving Averages S&P CNX NIFTY Technically, the market breadth remained weak, amidst
50 Day SMA 5441.51 lower volumes. The prevailing technical negatives
100 Day SMA 5273.84 continue to hold good and are weighing on the market
200 Day SMA 5222.03 ◄Positive sentiment. The RSI, Stochastic, KST and MACD are still
placed below their respective averages. Moreover, the
Market Breadth * BSE NSE Stochastic is placed in the over bought zone. These
Advances 978 265 technical negatives would lead to profit taking and
Declines 1929 882 selling pressure. However, a few positive technical
Same 124 27 conditions still continue to hold good The KST and the
Total 3031 1174 MACD are still placed in the positive territory, which
A/D Ratio 0.51 : 1 0.30 : 1
augurs well for the markets. Moreover, the Nifty remains
placed above its 50-day SMA, 100-day SMA and 200-day
Volume (Lacs Shares) * SMA. More so the Nifty’s 50-day SMA remains placed
10/10/12 09/10/12 % Chg. above Nifty’s 100-day SMA and 200-day SMA, the later
BSE 2848 3063 -7.02
being called the ‘Golden Cross breakout’. These positive
conditions would lead to buying support at lower levels.
NSE 7008 7071 -0.90
The ADX line and –DI line are moving higher and are
Total 9856 10134 -2.75
placed above the 42 level, indicating sellers have an
Turnover ( ` Crores) * upper hand. The market sentiment remains cautious and
10/10/12 09/10/12 % Chg.
tentative ahead of the earnings season. In the meanwhile
the markets would take cues from the forthcoming
BSE 2053.80 2351.31 -12.65
quarterly results, global markets, Rupee and the crude
NSE 10390.92 11017.10 -5.68
prices. The support levels for Nifty are placed at 5630, 5607,
NSE F&O 117568.37 112700.41 4.32 5526, and 5448. The Nifty faces resistance at 5703, 5741,
Total 130013.09 126068.82 3.13 5884, 5912 and 5945 levels.
F&O Contracts Traded (NSE) *
10/10/12 09/10/12 % Chg.
Index Fut. 349364 332083 5.20
Stock Fut. 446215 478027 6.65
Index Opt. 2989553 2791489 7.10
Stock Opt. 264476 252593 4.70
Total 4049608 3854192 5.45
NOTE - * - Source – BSE & NSE
Sanjay Bhatia (AVP – Technical Research), Email sanjay@keynotecapitals.net Yahoo Id: keytechnicals@yahoo.in
Keynote Capitals Ltd.
The Ruby, 9th Floor, Senapati Bapat Marg, Dadar (W), Mumbai, India – 400028. Tel: 3026 6000 / 2269 4322
www.keynotecapitals.com
2. Jaldi 5 (Short Term Technical Ideas for 5 Trading Days)
Stop
Initiation Stop Loss Target
Stock Close Action Price Loss * (%) Target (%) Remarks
TGT of 139
Achieved given
Sell @ 143.45
Allahabad Bank Fut 137.20 Sell Below 137 139.25 1.64 132 3.65 on 09/10/12
Bharti Airtel Fut 263.30 Sell Below 262 267.50 2.10 250 4.58
Hinalco Fut 116.70 Sell Below 117 120.25 3.22 110 5.58
* Stop Losses are to be considered strictly on closing basis.
Intra-day Resistance Intra-day Support
Indices Close Pivot Point R1 R2 R3 S1 S2 S3
BSE SENSEX 18631 18662 18710 18788 18915 18583 18536 18410
S&P CNX NIFTY 5652 5662 5677 5701 5741 5637 5622 5583
NIFTY OCT. FUT. 5672 5683 5700 5727 5771 5656 5640 5596
Stocks To Watch Out Today
Allahabad Bank, Apollo Tyre, BoB, BF Utilities, Bharti Airtel, CESC, Coal India, Dabur, DLF, GAIL, GMR Infra, Godrej Inds;
HDIL, Hindalco, HPCL, IB Realestate, IDBI, Idea, IDFC, IGL, Indusind Bank, LIC Hsg; NTPC, ONGC, Punj Lloyd, Raymond,
Rel. Com; Rel. Capital, Rel. Infra; SBI, Siemens, Tata Comm; Tata Power, Uco Bank, Uniphos, Unitech, Vijaya Bank, Wipro,
ZEEL
Aurobindo Pharma, FT, ITC, JSW Steel, Jubilant Food, Karnataka Bank, Tata Global, Titan
Keynote Capitals Ltd.
The Ruby, 9th Floor, Senapati Bapat Marg, Dadar (W), Mumbai, India – 400028. Tel: 3026 6000 / 2269 4322
www.keynotecapitals.com
3. NOTE:
TECHNICAL ANALYSIS ABBREVATIONS
SMA – Simple Moving Average
EMA – Exponential Moving Average
WMA – Weighted Moving Average
Disclaimer
This document is not for public distribution and has been furnished to you solely for your information and must not be
reproduced or redistributed to any other person. Persons into whose possession this document may come are
required to observe these restrictions.
This material is for the personal information of the authorized recipient, and we are not soliciting any action based
upon it. This report is not to be construed as an offer to sell or the solicitation of an offer to buy any security in any
jurisdiction where such an offer or solicitation would be illegal. It is for the general information of clients of Keynote
Capitals Ltd. It does not constitute a personal recommendation or take into account the particular investment
objectives, financial situations, or needs of individual clients.
We have reviewed the report, and in so far as it includes current or historical information, it is believed to be reliable
though its accuracy or completeness cannot be guaranteed. Neither Keynote Capitals Ltd., nor any person connected
with it, accepts any liability arising from the use of this document. The recipients of this material should rely on their
own investigations and take their own professional advice. Price and value of the investments referred to in this
material may go up or down. Past performance is not a guide for future performance. Certain transactions -including
those involving futures, options and other derivatives as well as non-investment grade securities - involve substantial
risk and are not suitable for all investors. Reports based on technical analysis centers on studying charts of a stock’s
price movement and trading volume, as opposed to focusing on a company’s fundamentals and as such, may not
match with a report on a company’s fundamentals.
Opinions expressed are our current opinions as of the date appearing on this material only. While we endeavor to
update on a reasonable basis the information discussed in this material, there may be regulatory, compliance, or
other reasons that prevent us from doing so. Prospective investors and others are cautioned that any forward-looking
statements are not predictions and may be subject to change without notice. Our proprietary trading and investment
businesses may make investment decisions that are inconsistent with the recommendations expressed herein.
We and our affiliates, officers, directors, and employees world wide may: (a) from time to time, have long or short
positions in, and buy or sell the securities thereof, of company (ies) mentioned herein or (b) be engaged in any other
transaction involving such securities and earn brokerage or other compensation or act as a market maker in the
financial instruments of the company (ies) discussed herein or act as advisor or lender / borrower to such company
(ies) or have other potential conflict of interest with respect to any recommendation and related information and
opinions.
The analyst for this report certifies that all of the views expressed in this report accurately reflect his or her personal
views about the subject company or companies and its or their securities, and no part of his or her compensation
was, is or will be, directly or indirectly related to specific recommendations or views expressed in this report.
No part of this material may be duplicated in any form and/or redistributed without Keynote Capitals Ltd’s., prior
written consent.
Keynote Capitals Ltd.
The Ruby, 9th Floor, Senapati Bapat Marg, Dadar (W), Mumbai, India – 400028. Tel: 3026 6000 / 2269 4322
www.keynotecapitals.com