Keynote technicals daily report for 191211
•
0 likes•77 views

The domestic stock markets opened flat but ended the day lower due to increased selling pressure. Key indices like the BSE Sensex and NIFTY 50 closed over 2% lower. Technical indicators suggest the markets may continue to face downward pressure in the near future. Support levels are placed at 4563, 4481 and 4353 for the Nifty, while resistance levels are at 4747, 4987 and 5037.

Recommended
Recommended
More Related Content
What's hot
What's hot (20)
Viewers also liked
Viewers also liked (20)
Similar to Keynote technicals daily report for 191211
Similar to Keynote technicals daily report for 191211 (20)
More from Keynote Capitals Ltd.
More from Keynote Capitals Ltd. (20)
Recently uploaded
Recently uploaded (20)
Keynote technicals daily report for 191211
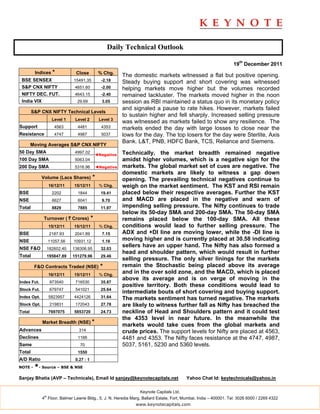
- 1. Daily Technical Outlook 19th December 2011 Indices * Close % Chg. The domestic markets witnessed a flat but positive opening. BSE SENSEX 15491.35 -2.18 Steady buying support and short covering was witnessed S&P CNX NIFTY 4651.60 -2.00 helping markets move higher but the volumes recorded NIFTY DEC. FUT. 4643.15 -2.40 remained lackluster. The markets moved higher in the noon India VIX 29.69 3.05 session as RBI maintained a status quo in its monetary policy and signaled a pause to rate hikes. However, markets failed S&P CNX NIFTY Technical Levels to sustain higher and fell sharply. Increased selling pressure Level 1 Level 2 Level 3 was witnessed as markets failed to show any resilience. The Support 4563 4481 4353 markets ended the day with large losses to close near the Resistance 4747 4987 5037 lows for the day. The top losers for the day were Sterlite, Axis Bank. L&T, PNB, HDFC Bank, TCS, Reliance and Siemens. Moving Averages S&P CNX NIFTY 50 Day SMA 4997.02 Technically, the market breadth remained negative ◄Negative 100 Day SMA 5063.04 amidst higher volumes, which is a negative sign for the 200 Day SMA 5316.96 ◄Negative markets. The global market set of cues are negative. The domestic markets are likely to witness a gap down Volume (Lacs Shares) * opening. The prevailing technical negatives continue to 16/12/11 15/12/11 % Chg. weigh on the market sentiment. The KST and RSI remain BSE 2202 1844 19.41 placed below their respective averages. Further the KST NSE 6627 6041 9.70 and MACD are placed in the negative and warn of Total 8829 7885 11.97 impending selling pressure. The Nifty continues to trade below its 50-day SMA and 200-day SMA. The 50-day SMA Turnover ( ` Crores) * remains placed below the 100-day SMA. All these 15/12/11 15/12/11 % Chg. conditions would lead to further selling pressure. The BSE 2187.93 2041.89 7.15 ADX and +DI line are moving lower, while the -DI line is NSE 11057.56 10931.12 1.16 moving higher and is currently placed at 30.58 indicating NSE F&O 182602.40 138306.95 32.03 sellers have an upper hand. The Nifty has also formed a head and shoulder pattern, which would result in further Total 195847.89 151279.96 29.46 selling pressure. The only silver linings for the markets F&O Contracts Traded (NSE) * remain the Stochastic being placed above its average 16/12/11 15/12/11 % Chg. and in the over sold zone, and the MACD, which is placed above its average and is on verge of moving in the Index Fut. 973540 716530 35.87 positive territory. Both these conditions would lead to Stock Fut. 679747 541021 25.64 intermediate bouts of short covering and buying support. Index Opt. 5823957 4424126 31.64 The markets sentiment has turned negative. The markets Stock Opt. 219831 172043 27.78 are likely to witness further fall as Nifty has breached the Total 7697075 5853720 24.73 neckline of Head and Shoulders pattern and it could test the 4353 level in near future. In the meanwhile the Market Breadth (NSE) * markets would take cues from the global markets and Advances 314 crude prices. The support levels for Nifty are placed at 4563, Declines 1166 4481 and 4353. The Nifty faces resistance at the 4747, 4987, Same 70 5037, 5161, 5230 and 5360 levels. Total 1550 A/D Ratio 0.27 : 1 NOTE - *- Source – BSE & NSE Sanjay Bhatia (AVP – Technicals), Email Id sanjay@keynotecapitals.net Yahoo Chat Id: keytechnicals@yahoo.in Keynote Capitals Ltd. th 4 Floor, Balmer Lawrie Bldg., 5, J. N. Heredia Marg, Ballard Estate, Fort, Mumbai, India – 400001. Tel: 3026 6000 / 2269 4322 www.keynotecapitals.com
- 2. Short Term Trading Ideas Based On Technical Analysis (5 - 7 Days) Stop Initiation Stop Loss Target Stock Close Action Price Loss * (%) Target (%) Remarks Arvind 69.05 Sell Below 68.50 70.10 2.34 65.00 5.11 TGT of 240 Achieved given SELL @ 261 on BHEL 240.40 Sell Below 239.00 246.75 3.24 222.00 7.11 12/12/11 Renuka Sugar 23.90 Sell Below 23.00 24.80 7.83 19.00 17.39 TGT of 260 Achieved given SELL @ 277 on Yes Bank 256.50 Sell Below 254.00 260.30 2.48 240.00 5.51 12/12/11 * Stop Losses are to be considered strictly on Closing basis. Intra-day Resistance Intra-day Support Indices Close Pivot Point R1 R2 R3 S1 S2 S3 BSE SENSEX 15491 15662 15898 16306 16949 15255 15018 14374 S&P CNX NIFTY 4652 4700 4771 4890 5081 4580 4509 4318 NIFTY DEC. FUT. 4643 4703 4781 4918 5133 4565 4487 4272 Keynote Capitals Ltd. th 4 Floor, Balmer Lawrie Bldg., 5, J. N. Heredia Marg, Ballard Estate, Fort, Mumbai, India – 400001. Tel: 3026 6000 / 2269 4322 www.keynotecapitals.com
- 3. Disclaimer This document is not for public distribution and has been furnished to you solely for your information and must not be reproduced or redistributed to any other person. Persons into whose possession this document may come are required to observe these restrictions. This material is for the personal information of the authorized recipient, and we are not soliciting any action based upon it. This report is not to be construed as an offer to sell or the solicitation of an offer to buy any security in any jurisdiction where such an offer or solicitation would be illegal. It is for the general information of clients of Keynote Capitals Ltd. It does not constitute a personal recommendation or take into account the particular investment objectives, financial situations, or needs of individual clients. We have reviewed the report, and in so far as it includes current or historical information, it is believed to be reliable though its accuracy or completeness cannot be guaranteed. Neither Keynote Capitals Ltd., nor any person connected with it, accepts any liability arising from the use of this document. The recipients of this material should rely on their own investigations and take their own professional advice. Price and value of the investments referred to in this material may go up or down. Past performance is not a guide for future performance. Certain transactions -including those involving futures, options and other derivatives as well as non-investment grade securities - involve substantial risk and are not suitable for all investors. Reports based on technical analysis centers on studying charts of a stock’s price movement and trading volume, as opposed to focusing on a company’s fundamentals and as such, may not match with a report on a company’s fundamentals. Opinions expressed are our current opinions as of the date appearing on this material only. While we endeavor to update on a reasonable basis the information discussed in this material, there may be regulatory, compliance, or other reasons that prevent us from doing so. Prospective investors and others are cautioned that any forward-looking statements are not predictions and may be subject to change without notice. Our proprietary trading and investment businesses may make investment decisions that are inconsistent with the recommendations expressed herein. We and our affiliates, officers, directors, and employees world wide may: (a) from time to time, have long or short positions in, and buy or sell the securities thereof, of company (ies) mentioned herein or (b) be engaged in any other transaction involving such securities and earn brokerage or other compensation or act as a market maker in the financial instruments of the company (ies) discussed herein or act as advisor or lender / borrower to such company (ies) or have other potential conflict of interest with respect to any recommendation and related information and opinions. The analyst for this report certifies that all of the views expressed in this report accurately reflect his or her personal views about the subject company or companies and its or their securities, and no part of his or her compensation was, is or will be, directly or indirectly related to specific recommendations or views expressed in this report. No part of this material may be duplicated in any form and/or redistributed without Keynote Capitals Ltd’s., prior written consent. Keynote Capitals Ltd. th 4 Floor, Balmer Lawrie Bldg., 5, J. N. Heredia Marg, Ballard Estate, Fort, Mumbai, India – 400001. Tel: 3026 6000 / 2269 4322 www.keynotecapitals.com