1. Daily Technical Outlook
18th October 2012
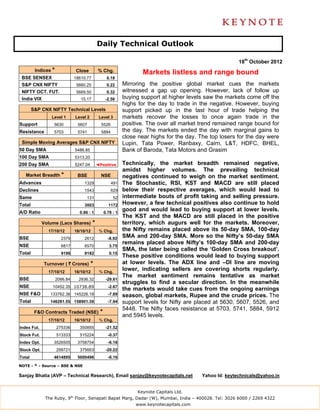
Indices * Close % Chg. Markets listless and range bound
BSE SENSEX 18610.77 0.18
S&P CNX NIFTY 5660.25 0.22 Mirroring the positive global market cues the markets
NIFTY OCT. FUT. 5669.50 0.32 witnessed a gap up opening. However, lack of follow up
India VIX 15.17 -2.56 buying support at higher levels saw the markets come off the
highs for the day to trade in the negative. However, buying
S&P CNX NIFTY Technical Levels support picked up in the last hour of trade helping the
Level 1 Level 2 Level 3 markets recover the losses to once again trade in the
Support 5630 5607 5526 positive. The over all market trend remained range bound for
Resistance 5703 5741 5884 the day. The markets ended the day with marginal gains to
close near highs for the day. The top losers for the day were
Simple Moving Averages S&P CNX NIFTY Lupin, Tata Power, Ranbaxy, Cairn, L&T, HDFC, BHEL,
50 Day SMA 5486.85 Bank of Baroda, Tata Motors and Grasim
100 Day SMA 5313.20
200 Day SMA 5247.04 ◄Positive Technically, the market breadth remained negative,
amidst higher volumes. The prevailing technical
Market Breadth * BSE NSE negatives continued to weigh on the market sentiment.
Advances 1329 491 The Stochastic, RSI, KST and MACD are still placed
Declines 1543 629 below their respective averages, which would lead to
Same 131 52 intermediate bouts of profit taking and selling pressure.
Total 3003 1172 However, a few technical positives also continue to hold
A/D Ratio 0.86 : 1 0.78 : 1
good and would lead to buying support at lower levels.
The KST and the MACD are still placed in the positive
Volume (Lacs Shares) * territory, which augurs well for the markets. Moreover,
17/10/12 16/10/12 % Chg. the Nifty remains placed above its 50-day SMA, 100-day
BSE 2379 2612 -8.92
SMA and 200-day SMA. More so the Nifty’s 50-day SMA
remains placed above Nifty’s 100-day SMA and 200-day
NSE 6817 6570 3.75
SMA, the later being called the ‘Golden Cross breakout’.
Total 9196 9182 0.15
These positive conditions would lead to buying support
Turnover ( ` Crores) * at lower levels. The ADX line and –DI line are moving
17/10/12 16/10/12 % Chg.
lower, indicating sellers are covering shorts regularly.
The market sentiment remains tentative as market
BSE 2066.84 2936.32 -29.61
struggles to find a secular direction. In the meanwhile
NSE 10452.35 10738.89 -2.67
the markets would take cues from the ongoing earnings
NSE F&O 133762.36 145226.18 -7.89 season, global markets, Rupee and the crude prices. The
Total 146281.55 158901.39 -7.94 support levels for Nifty are placed at 5630, 5607, 5526, and
5448. The Nifty faces resistance at 5703, 5741, 5884, 5912
F&O Contracts Traded (NSE) *
and 5945 levels.
17/10/12 16/10/12 % Chg.
Index Fut. 275336 350855 -21.52
Stock Fut. 513333 515224 -0.37
Index Opt. 3526505 3758754 -6.18
Stock Opt. 299721 375663 -20.22
Total 4614895 5000496 -6.16
NOTE - * - Source – BSE & NSE
Sanjay Bhatia (AVP – Technical Research), Email sanjay@keynotecapitals.net Yahoo Id: keytechnicals@yahoo.in
Keynote Capitals Ltd.
The Ruby, 9th Floor, Senapati Bapat Marg, Dadar (W), Mumbai, India – 400028. Tel: 3026 6000 / 2269 4322
www.keynotecapitals.com
2. Jaldi 5 (Short Term Technical Ideas for 5 Trading Days)
Stop
Initiation Stop Loss Target
Stock Close Action Price Loss * (%) Target (%) Remarks
Bank of India Fut 295.05 Sell Below 293.00 296.25 1.11 280 4.44
Bharat Forge 305.20 Buy Above 306.50 302.00 1.47 316 3.10
Dish TV 80.50 Buy Above 81.25 78.50 3.38 87 7.08
* Stop Losses are to be considered strictly on closing basis.
Intra-day Resistance Intra-day Support
Indices Close Pivot Point R1 R2 R3 S1 S2 S3
BSE SENSEX 18611 18617 18699 18787 18957 18529 18447 18277
S&P CNX NIFTY 5660 5660 5685 5710 5760 5635 5609 5559
NIFTY OCT. FUT. 5670 5670 5694 5719 5769 5645 5621 5571
Stocks To Watch Out Today
Bharat Forge, Bharti Airtel, Cairn India, Dish TV, Exide, Grasim, HDFC, ITC, Lupin
Ambuja Cement, Bank of India, Biocon, Crompton Greaves, Dabur, DLF, FT, GAIL, GMR Infra, Hexaware, HOECL, HPCL,
IDFC, India Cement, IRB, JSW Steel, Jubilant Foods, Kotak Bank, LIC Housing, M&M, Oil India, REC, Reliance, Renuka
Sugar, SAIL, SBI, Sterlite, TCS, VIP, Voltas
Keynote Capitals Ltd.
The Ruby, 9th Floor, Senapati Bapat Marg, Dadar (W), Mumbai, India – 400028. Tel: 3026 6000 / 2269 4322
www.keynotecapitals.com
3. NOTE:
TECHNICAL ANALYSIS ABBREVATIONS
SMA – Simple Moving Average
EMA – Exponential Moving Average
WMA – Weighted Moving Average
Disclaimer
This document is not for public distribution and has been furnished to you solely for your information and must not be
reproduced or redistributed to any other person. Persons into whose possession this document may come are
required to observe these restrictions.
This material is for the personal information of the authorized recipient, and we are not soliciting any action based
upon it. This report is not to be construed as an offer to sell or the solicitation of an offer to buy any security in any
jurisdiction where such an offer or solicitation would be illegal. It is for the general information of clients of Keynote
Capitals Ltd. It does not constitute a personal recommendation or take into account the particular investment
objectives, financial situations, or needs of individual clients.
We have reviewed the report, and in so far as it includes current or historical information, it is believed to be reliable
though its accuracy or completeness cannot be guaranteed. Neither Keynote Capitals Ltd., nor any person connected
with it, accepts any liability arising from the use of this document. The recipients of this material should rely on their
own investigations and take their own professional advice. Price and value of the investments referred to in this
material may go up or down. Past performance is not a guide for future performance. Certain transactions -including
those involving futures, options and other derivatives as well as non-investment grade securities - involve substantial
risk and are not suitable for all investors. Reports based on technical analysis centers on studying charts of a stock’s
price movement and trading volume, as opposed to focusing on a company’s fundamentals and as such, may not
match with a report on a company’s fundamentals.
Opinions expressed are our current opinions as of the date appearing on this material only. While we endeavor to
update on a reasonable basis the information discussed in this material, there may be regulatory, compliance, or
other reasons that prevent us from doing so. Prospective investors and others are cautioned that any forward-looking
statements are not predictions and may be subject to change without notice. Our proprietary trading and investment
businesses may make investment decisions that are inconsistent with the recommendations expressed herein.
We and our affiliates, officers, directors, and employees world wide may: (a) from time to time, have long or short
positions in, and buy or sell the securities thereof, of company (ies) mentioned herein or (b) be engaged in any other
transaction involving such securities and earn brokerage or other compensation or act as a market maker in the
financial instruments of the company (ies) discussed herein or act as advisor or lender / borrower to such company
(ies) or have other potential conflict of interest with respect to any recommendation and related information and
opinions.
The analyst for this report certifies that all of the views expressed in this report accurately reflect his or her personal
views about the subject company or companies and its or their securities, and no part of his or her compensation
was, is or will be, directly or indirectly related to specific recommendations or views expressed in this report.
No part of this material may be duplicated in any form and/or redistributed without Keynote Capitals Ltd’s., prior
written consent.
Keynote Capitals Ltd.
The Ruby, 9th Floor, Senapati Bapat Marg, Dadar (W), Mumbai, India – 400028. Tel: 3026 6000 / 2269 4322
www.keynotecapitals.com