Downloaded 102 times


![Applications Of Colorimeter
• Estimation of biochemical compounds in blood, plasma,
serum, CSF, urine, etc.:
– Glucose
– Urea
– Creatinine
– Uric Acid
– Bilirubin
– Lipids
– Total Proteins
– Enzymes [e.g. ALT, AST, ALP]
– Minerals [Calcium, Phosphorus etc.] etc….](https://image.slidesharecdn.com/colorimetryclass2-161110120518/75/Colorimetry-class-46-2048.jpg)


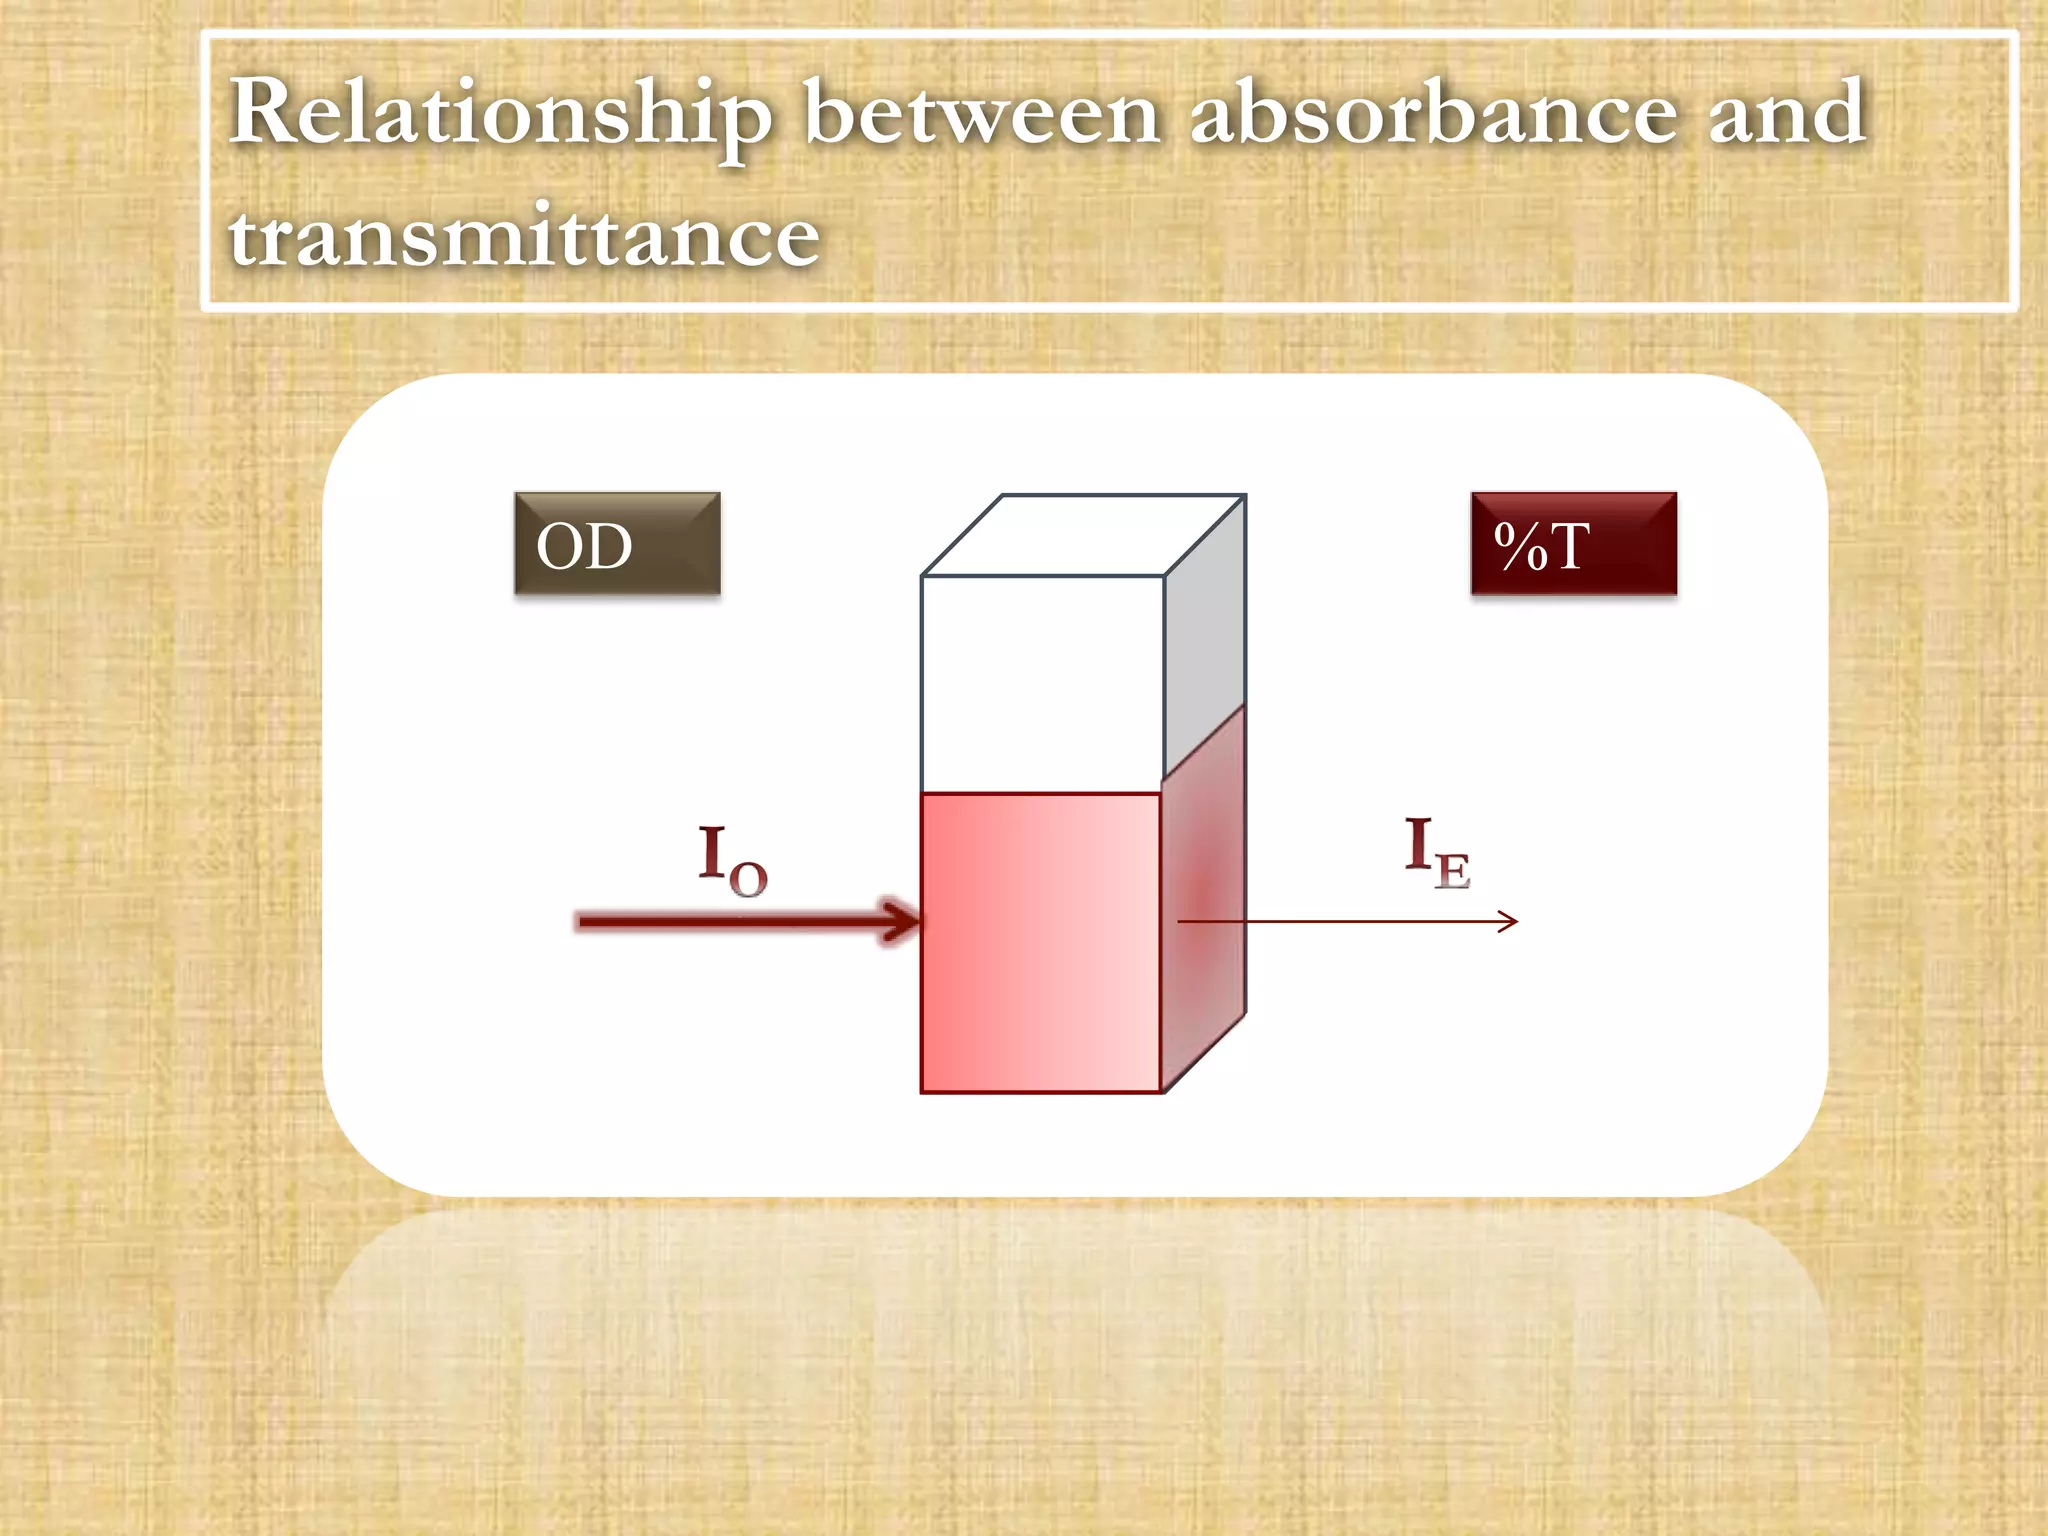
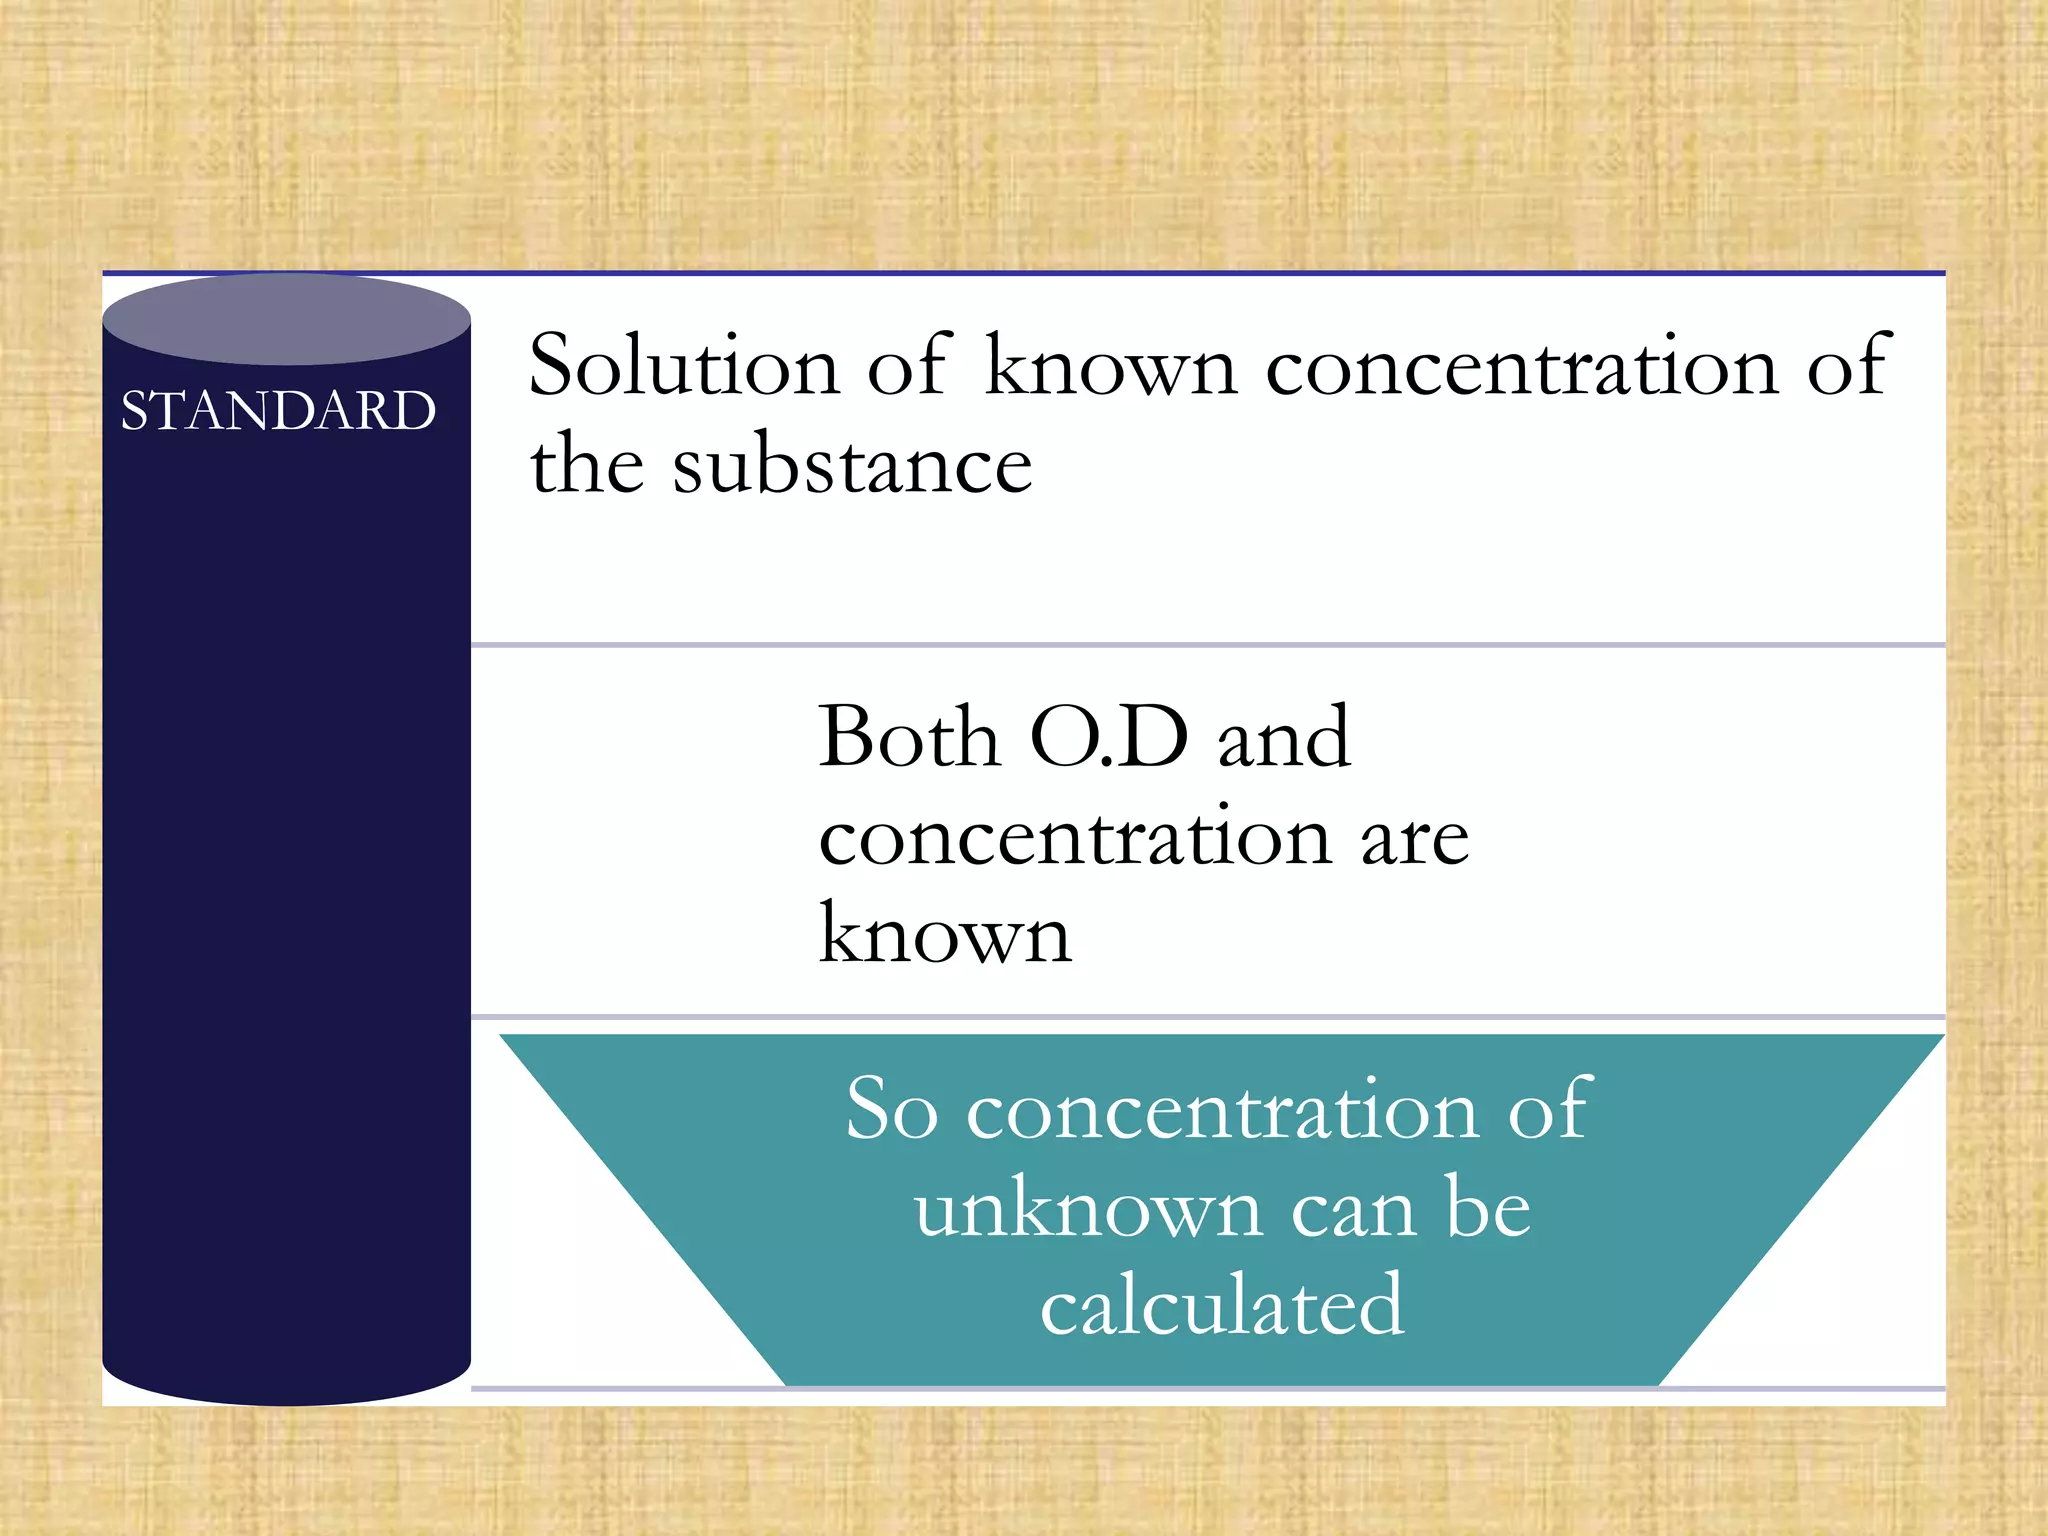
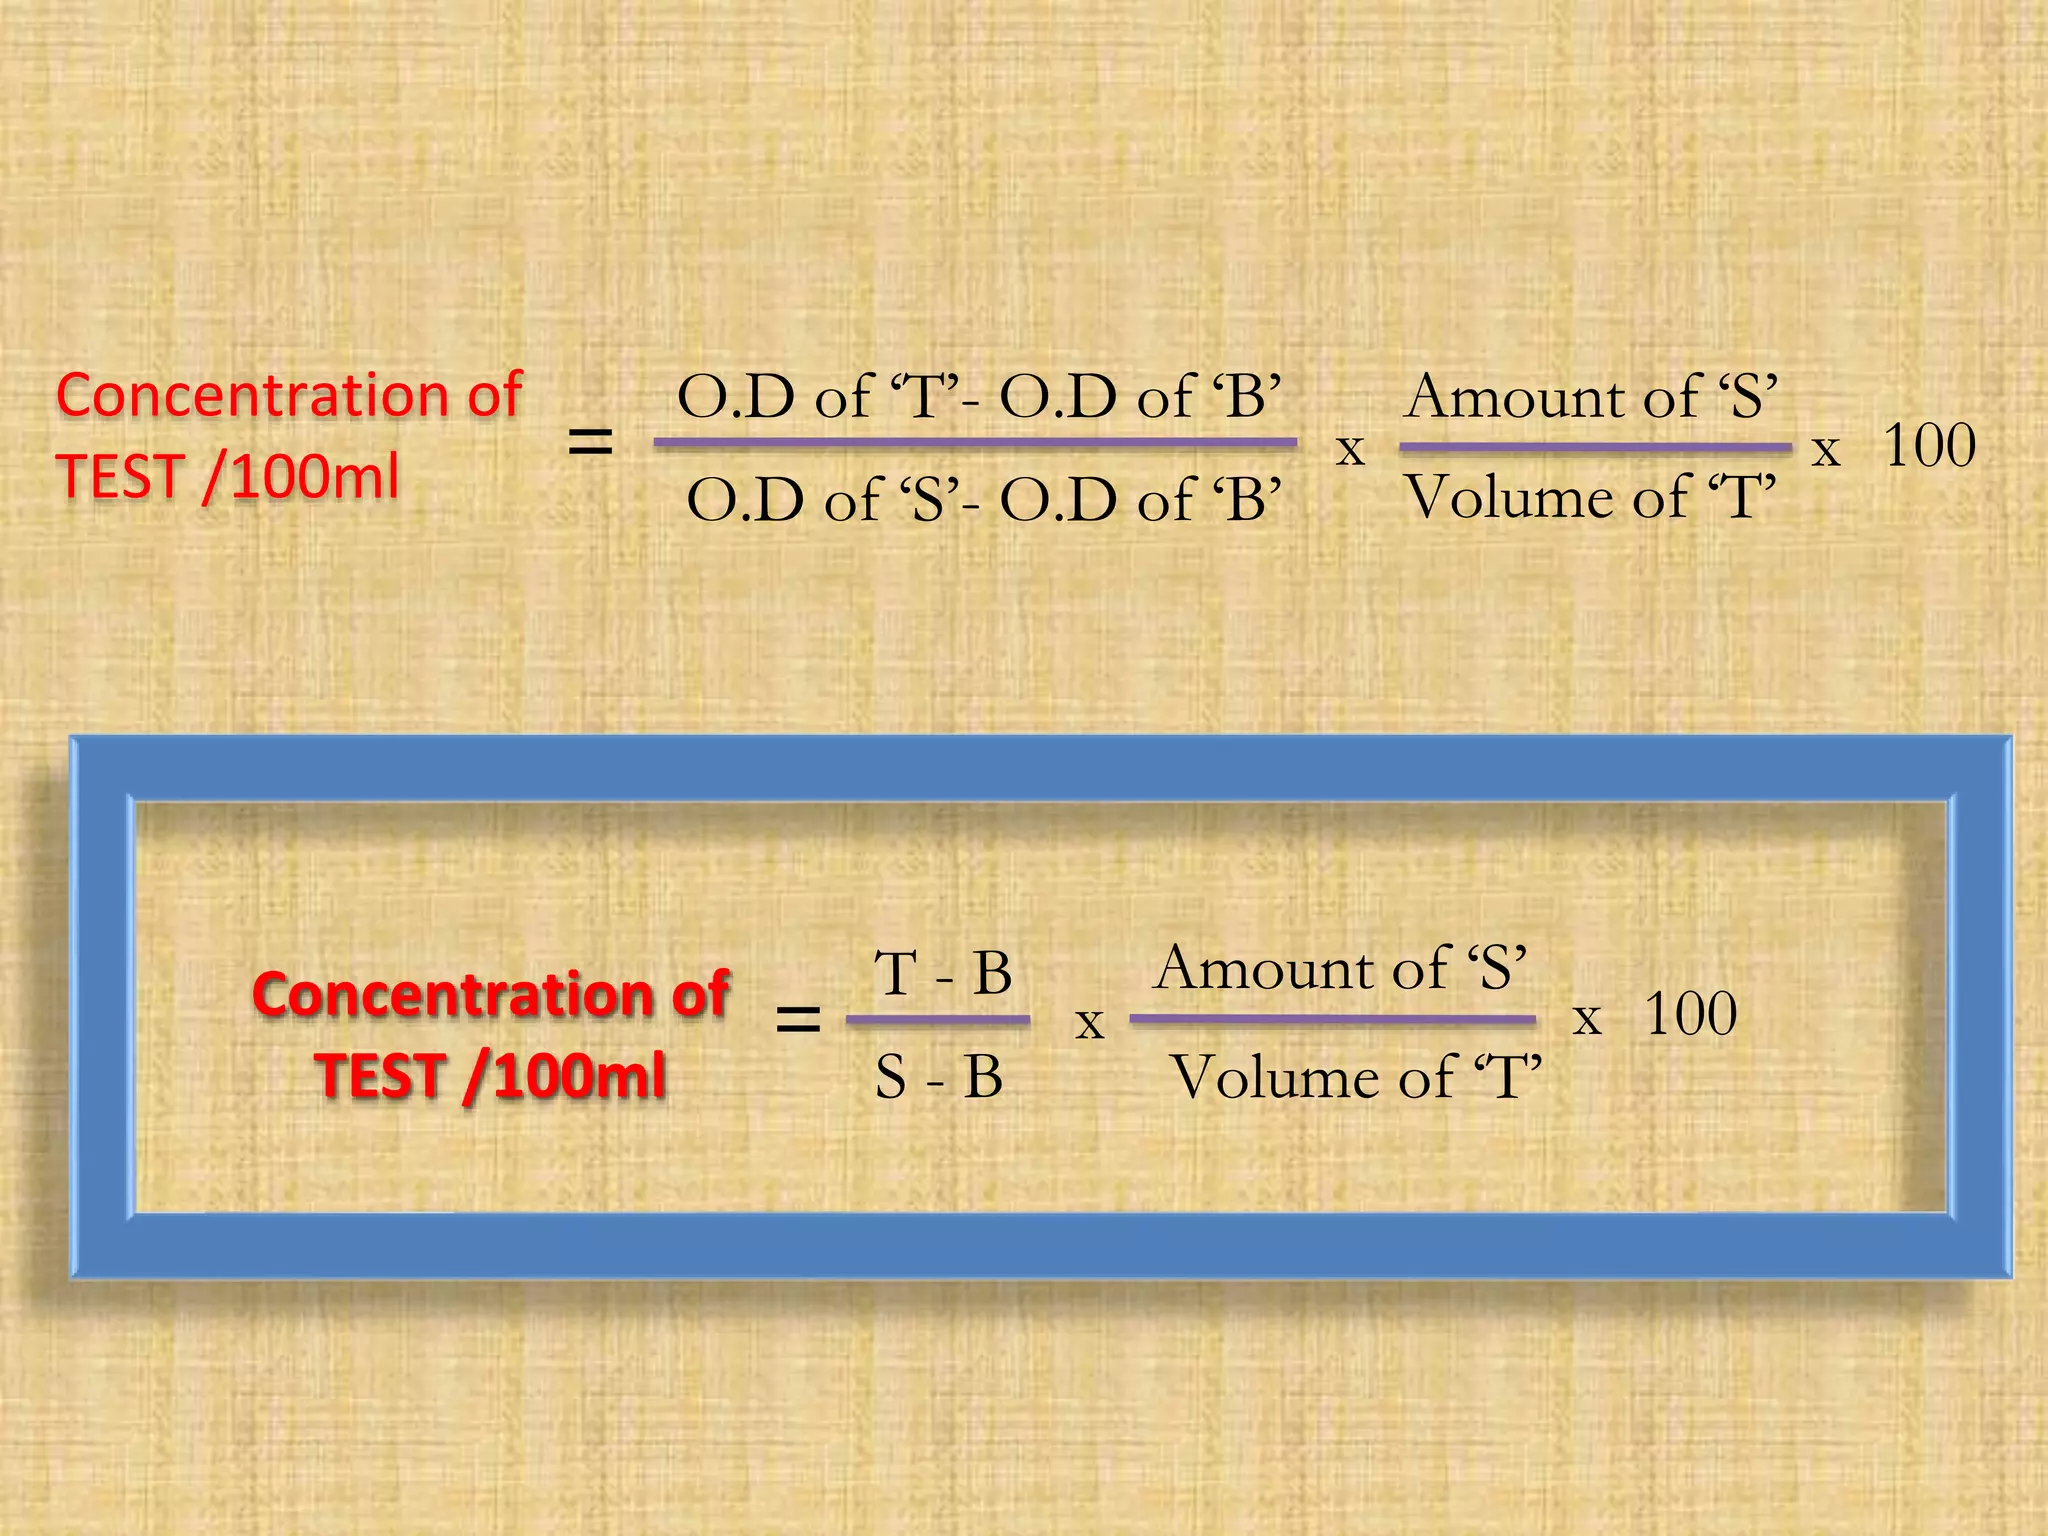
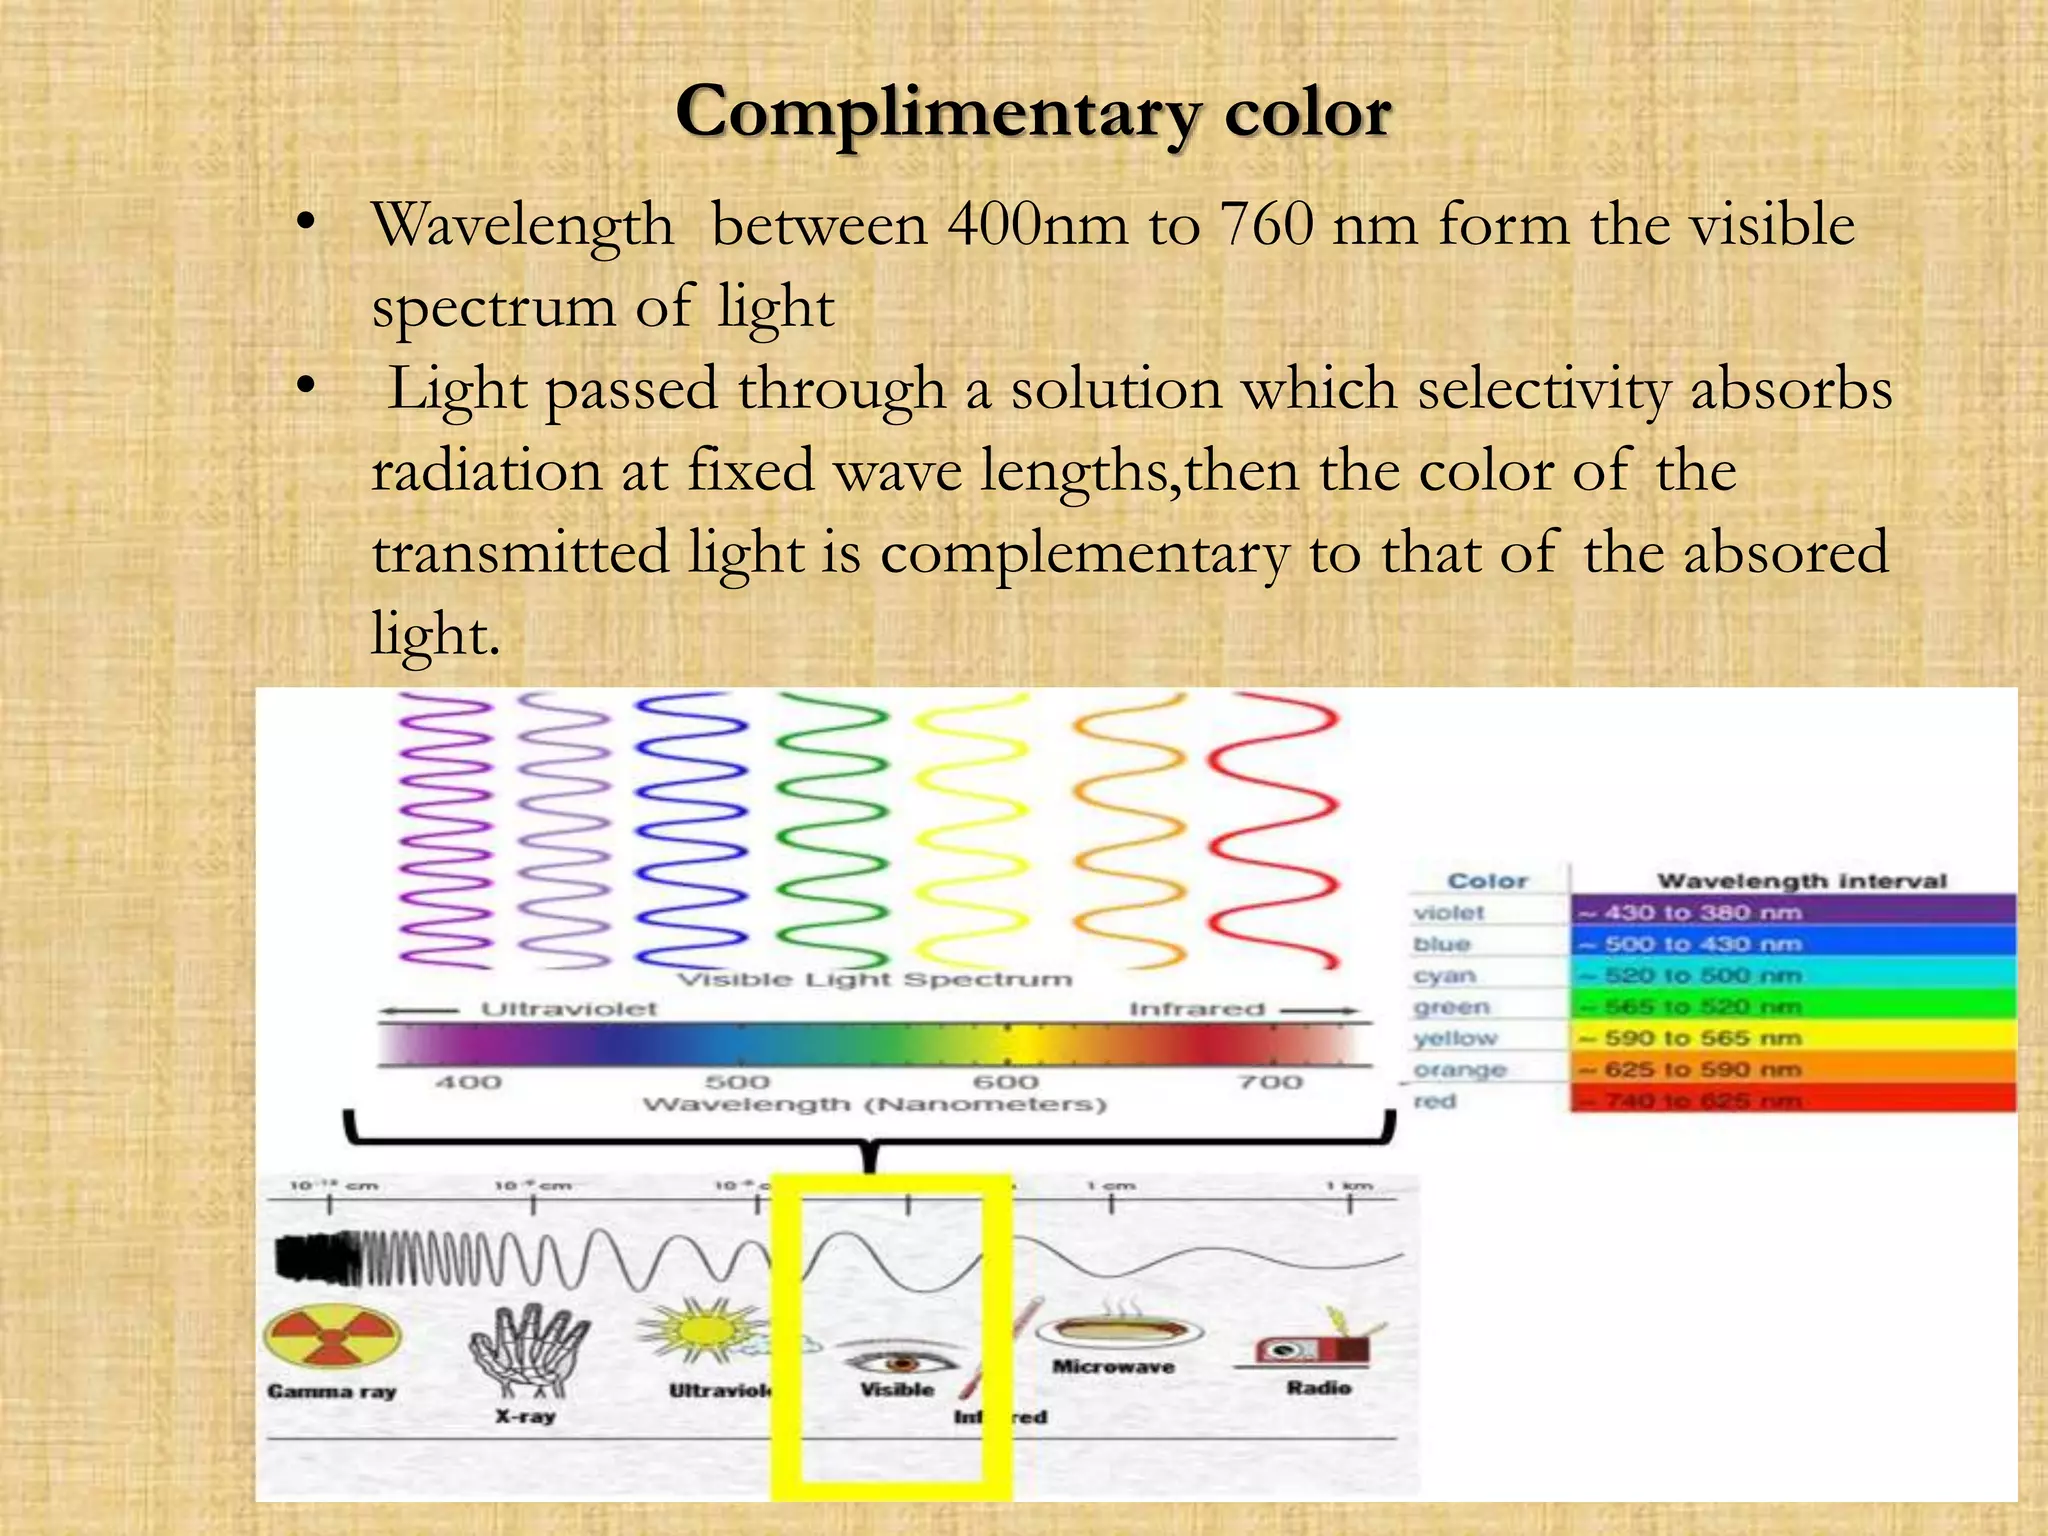
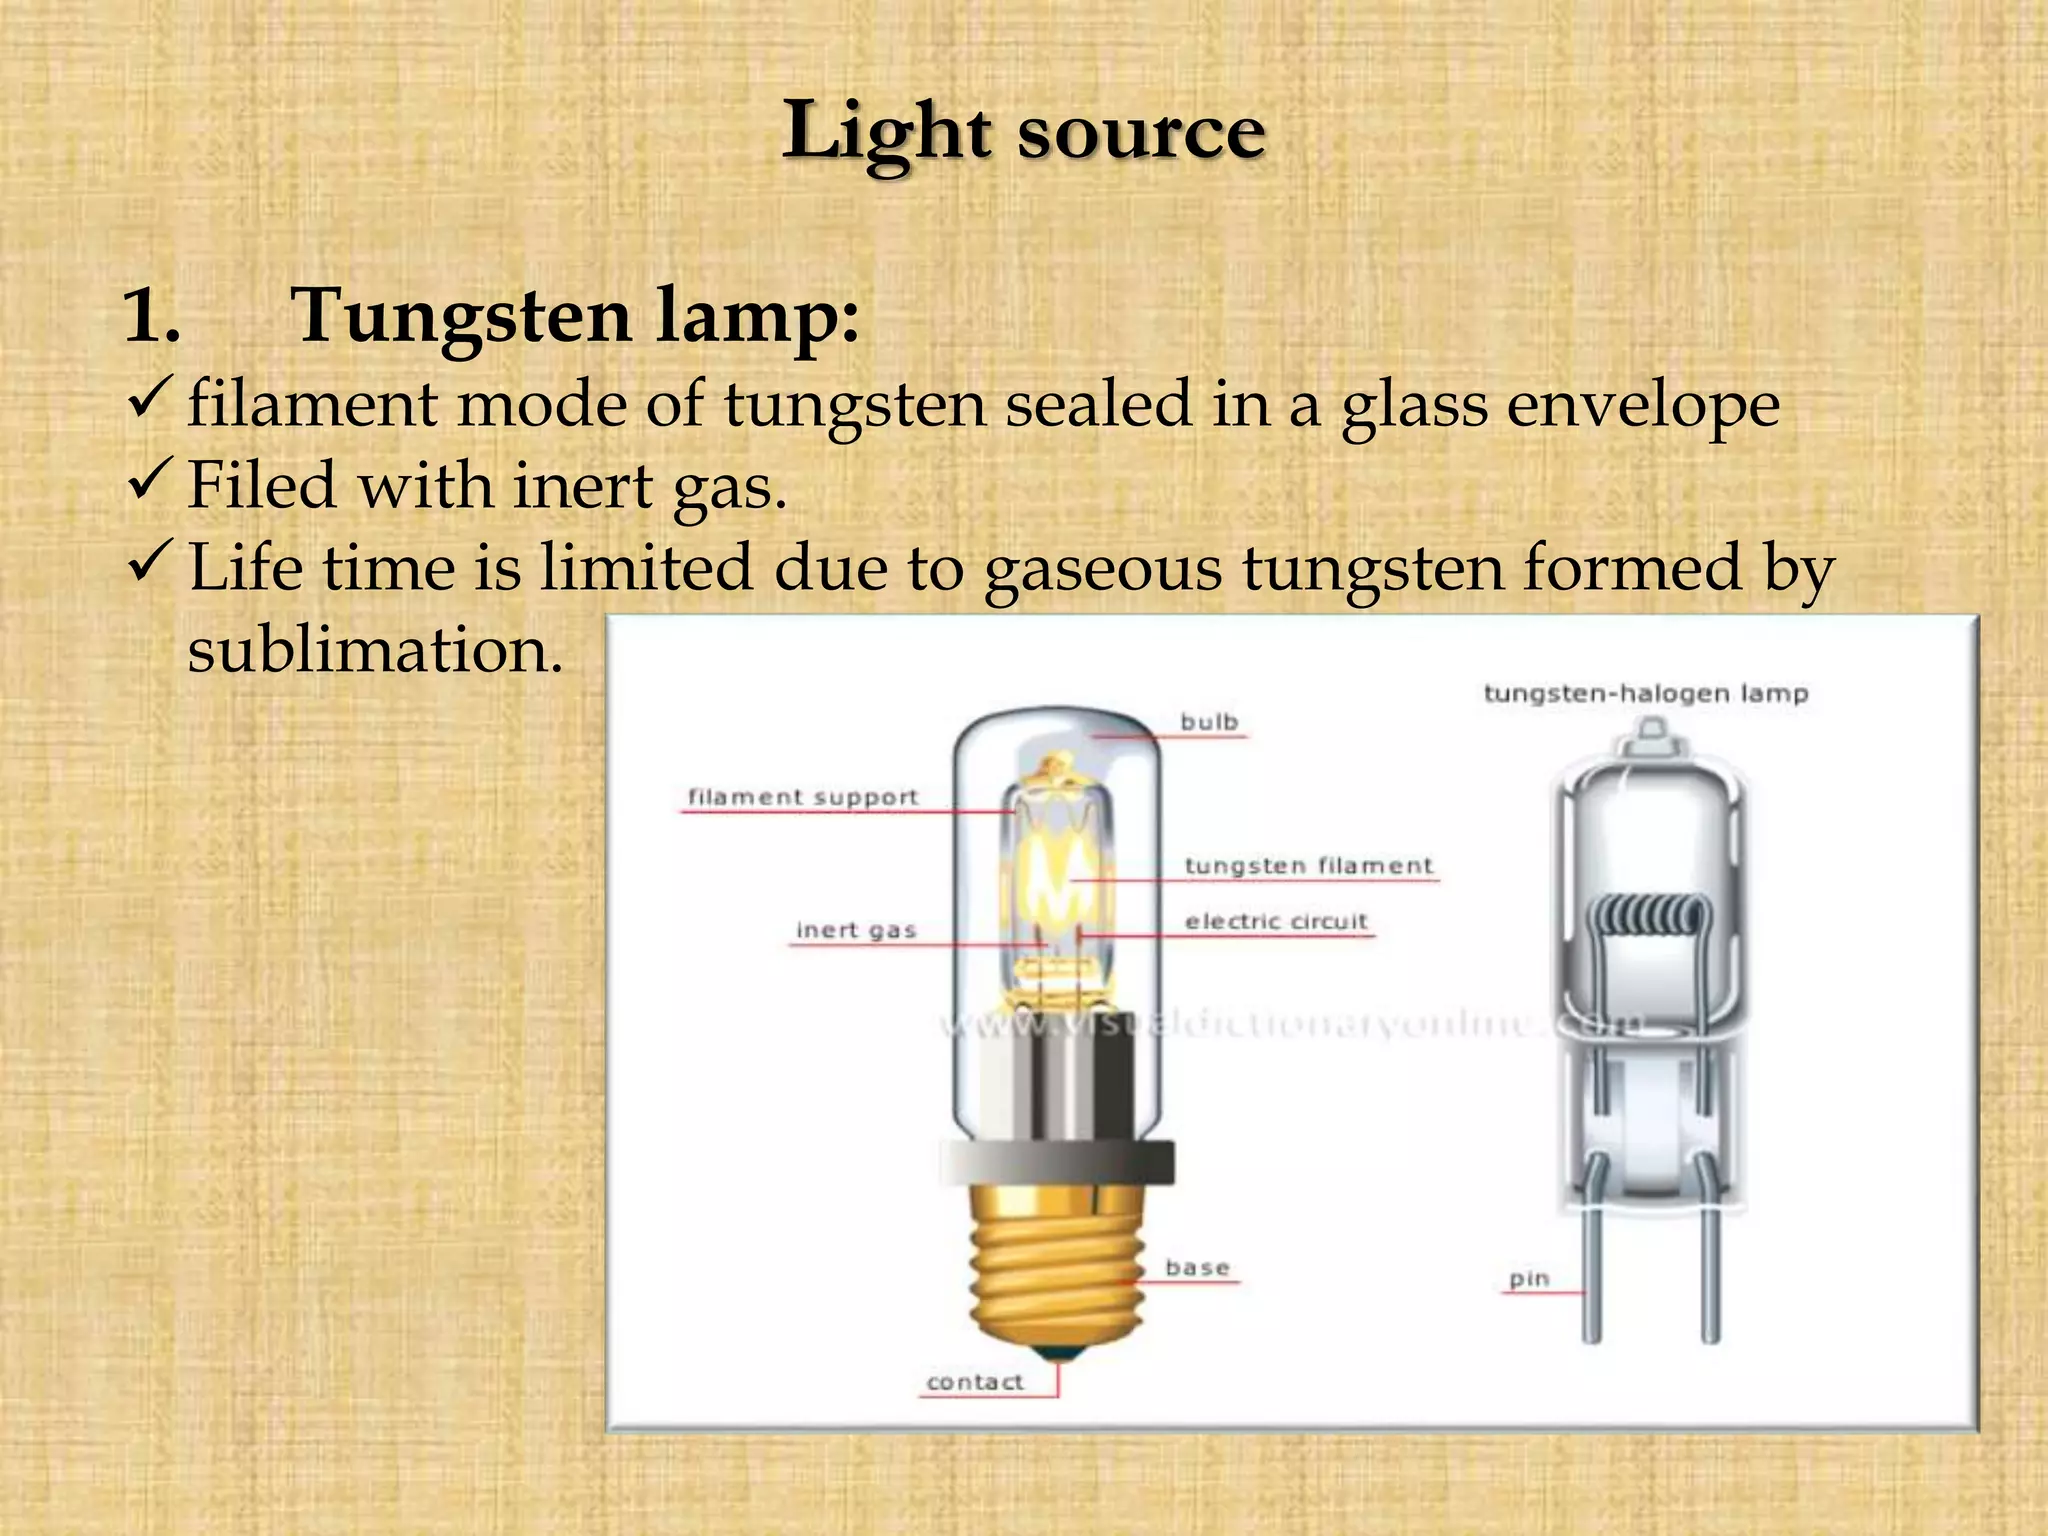
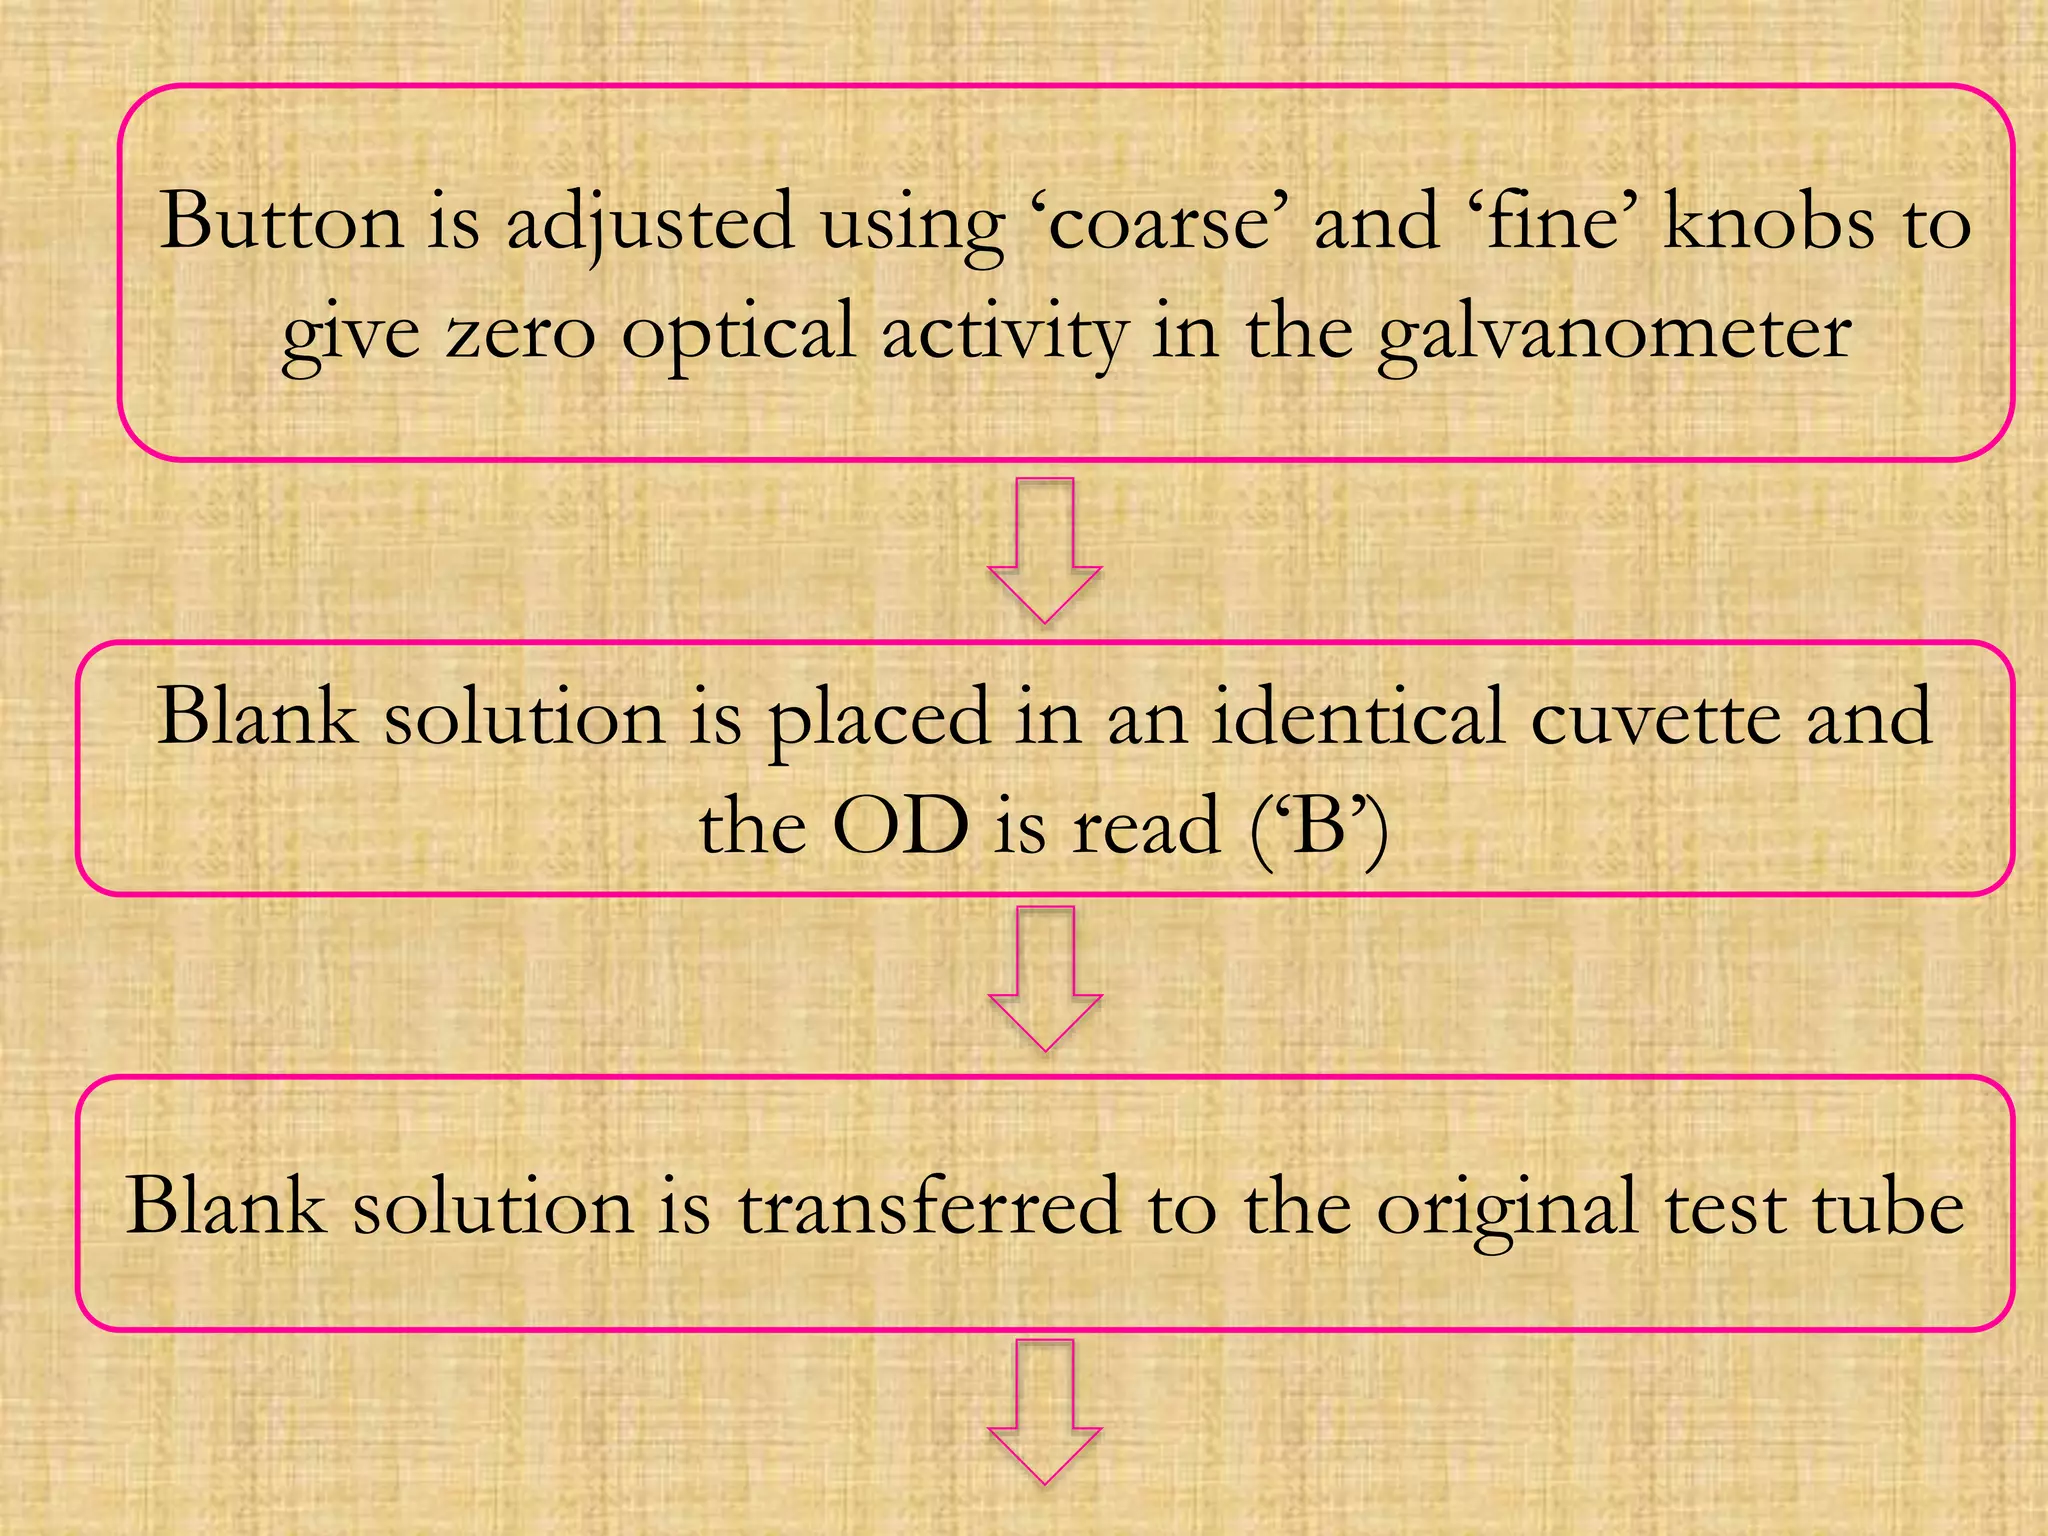
Photometry techniques like colorimetry, spectrophotometry, and turbidometry measure the intensity of light absorbed or transmitted by a solution. Colorimeters contain a light source, monochromators/filters to select wavelengths, a sample holder (cuvette), photodetectors, and readout devices. The amount of light absorbed follows Beer's and Lambert's laws - absorption increases exponentially with concentration and path length. A colorimeter is used to quantify compounds in biological samples like blood and urine by measuring absorbance and relating it to a standard curve using the Beer-Lambert law. Colorimeters provide a simple and inexpensive way to perform quantitative analysis of colored compounds.


![Smart packaging for connected food (l)inks [compatibility mode]](https://cdn.slidesharecdn.com/ss_thumbnails/smartpackagingforconnectedfoodlinkscompatibilitymode-131129070350-phpapp01-thumbnail.jpg?width=640&height=640&fit=bounds)


