1. 1QFY2011 Result Update | Agrichemical
July 23, 2010
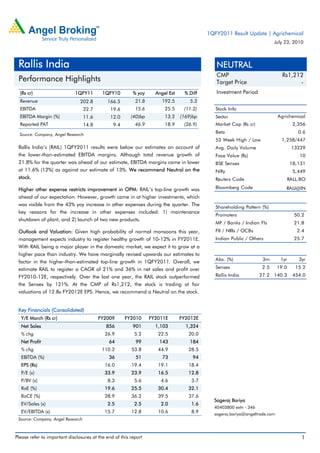
Rallis India NEUTRAL
CMP Rs1,212
Performance Highlights Target Price -
(Rs cr) 1QFY11 1QFY10 % yoy Angel Est % Diff Investment Period
Revenue 202.8 166.5 21.8 192.5 5.3
EBITDA 22.7 19.6 15.6 25.5 (11.2) Stock Info
EBITDA Margin (%) 11.6 12.0 (40)bp 13.2 (169)bp Sector Agrichemical
Reported PAT 14.8 9.4 46.9 18.9 (26.9) Market Cap (Rs cr) 2,356
Source: Company, Angel Research
Beta 0.6
52 Week High / Low 1,258/447
Rallis India’s (RAIL) 1QFY2011 results were below our estimates on account of Avg. Daily Volume 13229
the lower-than-estimated EBITDA margins. Although total revenue growth of Face Value (Rs) 10
21.8% for the quarter was ahead of our estimate, EBITDA margins came in lower BSE Sensex 18,131
at 11.6% (12%) as against our estimate of 13%. We recommend Neutral on the Nifty 5,449
stock. Reuters Code RALL.BO
Higher other expense restricts improvement in OPM: RAIL’s top-line growth was Bloomberg Code RALI@IN
ahead of our expectation. However, growth came in at higher investments, which
was visible from the 43% yoy increase in other expenses during the quarter. The
Shareholding Pattern (%)
key reasons for the increase in other expenses included: 1) maintenance
Promoters 50.2
shutdown of plant, and 2) launch of two new products.
MF / Banks / Indian Fls 21.8
Outlook and Valuation: Given high probability of normal monsoons this year, FII / NRIs / OCBs 2.4
management expects industry to register healthy growth of 10-12% in FY2011E. Indian Public / Others 25.7
With RAIL being a major player in the domestic market, we expect it to grow at a
higher pace than industry. We have marginally revised upwards our estimates to
Abs. (%) 3m 1yr 3yr
factor in the higher-than-estimated top-line growth in 1QFY2011. Overall, we
estimate RAIL to register a CAGR of 21% and 36% in net sales and profit over Sensex 2.5 19.0 15.2
FY2010-12E, respectively. Over the last one year, the RAIL stock outperformed Rallis India 27.2 140.3 454.0
the Sensex by 121%. At the CMP of Rs1,212, the stock is trading at fair
valuations of 12.8x FY2012E EPS. Hence, we recommend a Neutral on the stock.
Key Financials (Consolidated)
Y/E March (Rs cr) FY2009 FY2010 FY2011E FY2012E
Net Sales 856 901 1,103 1,324
% chg 26.9 5.2 22.5 20.0
Net Profit 64 99 143 184
% chg 110.2 53.8 44.9 28.5
EBITDA (%) 36 51 73 94
EPS (Rs) 16.0 19.4 19.1 18.4
P/E (x) 33.9 23.9 16.5 12.8
P/BV (x) 8.3 5.6 4.6 3.7
RoE (%) 19.6 25.5 30.4 32.1
RoCE (%) 28.9 36.2 39.5 37.6
Sageraj Bariya
EV/Sales (x) 2.5 2.5 2.0 1.6
40403800 extn - 346
EV/EBITDA (x) 15.7 12.8 10.6 8.9 sageraj.bariya@angeltrade.com
Source: Company, Angel Research
Please refer to important disclosures at the end of this report 1
2. Rallis India|1QFY2011 Result Update
Exhibit 1: Quarterly performance
Y/E March (Rs cr) 1QFY11 1QFY10 % chg FY2010 FY2009 % chg
Net Revenues 203 166 21.8 901 856 5.2
Raw material cost 122 101 20.6 506 507 (0.3)
Gross Profit 81 65 23.8 395 349 13.2
Gross margin 40 39 44 41
Employee Expenses 18 18 67 67
as % of sales 1 1 1 1
Other expenditure 40 28 153 145
as % of sales 2 2 17 17
Total Expenditure 180 147 726 719
Operating Profit 23 20 15.6 175 137 28.0
OPM (%) 11.6 12.0 19 16
Depreciation 4 4 18 23
EBIT 19 16 157 114
EBIT (%) 9 10 17 13
Other income 2 1 7 3
Interest (1) 0 5 11
PBT (excl of Ext items) 22 17 27.7 158 106 49.5
Ext items 0 2 (8) (6)
PBT (incl of Ext items) 22 15 150 100
Tax 7 6 51 35
Reported PAT 15 9 57.5 99 64 53.8
Adj PAT 15 12 99 64
Report EPS (Rs) 7.6 4.8 57.5 50.7 35.7 41.9
Adj EPS (Rs) 7.6 5.9 29.0 50.7 35.7 41.9
Source: Company, Angel Research
Sales growth ahead of estimates
RAIL posted strong top-line growth of 21.8% to Rs203cr, which was ahead of
our estimate of Rs193cr. This healthy growth in top-line was driven by the
company’s robust performance in the domestic market that witnessed strong
demand for pesticides along with revival in exports. RAIL’s domestic business
growth was driven by the two new product launches during the quarter.
July 23, 2010 2
3. Rallis India|1QFY2011 Result Update
Exhibit 2: Sales performance
350 22 25
300 20
13 14
250 15
200 10
Rs cr
%
150 5
100 (3) 0
(5)
50 (5)
0 (10)
1Q2010 2Q2010 3Q2010 4Q2010 1Q2011
Total Revenue % YoY
Source: Company, Angel Research
Higher other expense restricts improvement in OPM
RAIL’s top-line growth of 21.8% was ahead of our expectation due to strong
performance in the domestic business and revival in exports. However, the
domestic growth came in at higher investments, which was evident from the 43%
yoy increase in other expenses for the quarter.
Exhibit 3: Other expenses trend Exhibit 4: Margin trend
60 50
52
48
50 40
43 44 43
40 39 40
40 30
28 30
%
Rs cr
30
20
24
21 21
20
10
12 12
10
0
0 1Q2010 2Q2010 3Q2010 4Q2010 1Q2011
1Q2010 2Q2010 3Q2010 4Q2010 1Q2011
Gross margin EBITDA Margin
Source: Company, Angel Research Source: Company, Angel Research
Key reasons for increase in other expenses:
1) Maintenance shutdown of plant – Given that 1Q is normally off-season for the
agrichemical companies, RAIL took a maintenance shut down for its plant that led
to lower capacity utilisation coupled with higher costs.
2) Launch of two new products – RAIL launched two new products during the
quarter namely, Tarak - a post emergence herbicide for rice/paddy, and Ralligold -
a plant growth nutrient for crops like cotton, groundnut, paddy, vegetables,
soybean and pulses.
July 23, 2010 3
4. Rallis India|1QFY2011 Result Update
Earnings growth below estimate
Total reported PAT for the quarter came in at Rs15cr (Rs9cr), a yoy growth of
57.5%. However, it was below our estimate of Rs18.9cr mainly on account of
higher other expenses.
Exhibit 5: PAT trend
50 46 160
40
120
30 25
24
Rs cr
80
%
20 15
9 40
10
0 0
1Q2010 2Q2010 3Q2010 4Q2010 1Q2011
PAT % YoY
Source: Company, Angel Research
Management meet - Key takeaways
Even though in the current year the south-west monsoons have come on time,
there is 14% deficit at the country level. Management expects normal
monsoons to prevail (Source: Indian Metrological Department) prediction
during the year leading to higher consumption of pesticides in the country.
Sowing across the country has been good, but for few crops like maize and
sunflower, which have witnessed decline in area.
An extended winter in America has impacted consumption of herbicides, while
late winter rains have impacted the crops in Canada. Similarly, Europe has
been impacted by adverse weather and grain production is likely to be
impacted. Latin America and the Asia-pacific region are better placed on
account of higher output of lower inventory in LATAM markets, higher soya
bean production in Brazil.
During the quarter, RAIL also signed a co-operation agreement with Syngenta
for its fungicide, viz. Azoxystrobin (AZ). RAIL would source the product from
Syngenta and sell under its own brand name. AZ is the world’s best selling
fungicide and is estimated to have total market size of US $1bn. RAIL has
exclusive global rights for the specific combination of AZ. RAIL would also be
supplying Hexaconazola to Syngenta as part of the deal.
RAIL’s Dahej plant is near completion and would be inaugurated on July 29,
2010 post which the trial runs would commence. Commercial production is
likely to start by October 2010.
July 23, 2010 4
5. Rallis India|1QFY2011 Result Update
Some of the key agricultural states that had a high share of migrant workers
have been witnessing good demand for herbicides. It may be noted here that
after the introduction of the National Rural Employment Guarantee Scheme
(NREG), the availability of cost-effective labour has been reducing. This has in
turn increased the demand for herbicides. RAIL has traditionally been a strong
player in insecticides and fungicides. Going ahead, it plans to focus strongly
on herbicides to take advantage of the rising opportunity. Management has
also shown keen interest to further augment its seeds business (0.5% of
FY2010 revenue)
July 23, 2010 5
6. Rallis India|1QFY2011 Result Update
Annual Report snippets
Increasing food demand-supply gap, a crisis in making: Post the Green Revolution,
India’s crop productivity has been stagnant. However, the current economic
development and increasing disposable income along with spend, is likely to see
strong demand for food. This along with stagnate food production has been
leading to heightened risks in food security. This could lead to demand
outstripping supply by a huge factor. The ICRIER working paper, Demand-Supply
Trends and Projections of Food in India, authored by Surabhi Mittal in March
2008, reveals that India might face shortages of close to 24mn tonnes in pulses,
18mn tonnes in edible oils and 3mn tonnes in cereals by 2021.
Exhibit 6: Food items - Demand-supply gap (mn metric tonnes)
Food Items 2011 2021 2026
Rice 1.3 9.0 9.1
Wheat 21.2 27.3 32.0
Total Cereals 21.2 (2.9) (17.0)
Pulse (8.1) (24.9) (39.3)
Edible oil (6.7) (17.7) (27.0)
Sugar (4.3) (39.7) (74.1)
Source: Company, Angel research
Farmer database: Amongst all the agrichemical companies, Rallis (RAIL) has the
largest distribution network across the country. In its efforts to develop its brand,
RAIL has been interacting with the farmers at various levels. One such program,
Rallis Kisan Kutumba (RKK), the farmers are enrolled and given adequate support
to achieve better yields from their farmland. During FY2010, RAIL conducted
8,000 demonstrations (events/seminars) under RKK across villages, with each
event attended on an average by 20-25 farmers, translating into 160,000-
200,000 farmers. At the end of FY2010, more than 3 lakh farmers were enrolled
with RKK whose data have mostly been digitised. RAIL plans to cover more than
five lakh farmers under RKK by March 2011.
Bringing technology to the farmer: RAIL conducted a pilot study for ‘advisory
services’ in Gujarat and Punjab. With the help of the ‘Tata Business Support
Service Ltd’, a helpline number was given to the farmers to consult experts. On
similar lines, RAIL initiated a pilot service of advisory on mobile in Maharashtra.
General business: The company’s domestic formulation business registered a
growth of 21%. Exports registered a decline of 34% in FY2010 due to high
inventory levels in the key markets (USA and Latin America) and sharp correction
in agrichemical prices. Adverse weather conditions in Africa and Australia also
contributed to the overall decrease in sales. Exports contributed 22% of total
revenues as against 35% last year.
July 23, 2010 6
7. Rallis India|1QFY2011 Result Update
Exhibit 7: Revenue mix
100%
80%
60%
40%
20%
0%
FY06 FY07 FY08 FY09 FY10
Domestic Export
Source: Company, Angel Research
Strong new product pipeline
In our IC report, we had mentioned about RAIL’s eight new molecule (Fungicide
category) pipeline under the New Millennium India Technology Leadership
Initiative. RAIL and the Council of Scientific and Industrial Research (CSIR), New
Delhi jointly hold commercial rights of these molecules, as this project is initiated
under the Public-Private-Partnership (PPP) scheme. As per the company’s latest
annual report, four of the initial eight molecules have shown promising results and
are currently undergoing further field trials – a provisional patent for joint
ownership has been granted.
New product launches has been a key strategy behind RAIL's turnaround
performance. On an average, the company has been registering 5-6 products and
launching 3-4 products every year. Pertinently, new product launches were
possible due to RAIL's strong reach and goodwill among the farmers and the Tata
brand associated with it which has enabled it to conduct the field trials. In FY2010,
RAIL obtained registration for two new products and launched three products.
Exhibit 8: Product pipeline
8
7
6
5
4
3
2
1 3 6 6 3 3 4 3 3
0
FY2003
FY2004
FY2005
FY2006
FY2007
FY2008
FY2009
FY2010
Product Launch Product Registration
Source: Company, Angel Research
RAIL has identified several new products to be developed during the next 10 years.
The company’s innovation index (sales of new products launched over the past 4-5
years) has been maintaining its historic average and contributed 31% to total
revenue (FY2010).
July 23, 2010 7
9. Rallis India|1QFY2011 Result Update
Investment Arguments
Set to seize rising opportunities in the domestic pesticides market: India's overall
pesticides consumption is one of the lowest in the world, and we believe that RAIL
is well-placed to seize this opportunity on the back of its wide distribution network,
strong brands and robust new product pipeline. According to industry estimates,
the unorganised market accounts for another 50% of the industry. Nonetheless, we
believe that RAIL is in a position to wrest market share as well as charge a
premium for its products.
Exports to register steady growth: Closing down of capacity in China before the
Olympics 2008 and MNCs diversifying their base to India had resulted in the
company’s exports spiking 80% in FY2009 to Rs295cr. The scenario has however
changed post the Olympics and many closed capacities have come on stream and
commodities prices have strong corrected due to which export decline by 35% in
FY2010. Against this backdrop, we estimate RAIL to post a CAGR of 40% in
exports over FY2010-12E.
Contract manufacturing to be next growth driver: RAIL plans to focus on CM for
Exports and selectively target and supply to the top players. To facilitate the same,
the company is setting up a new plant at Dahej. Overall, RAIL targets to achieve
cumulative Revenues of Rs1,000cr over the next five years from this segment alone
Outlook and Valuation
Given the high probability of normal monsoons in the current year, management
expects industry to register healthy growth of 10-12% in FY2011E. With RAIL being
a major player in the domestic market, we expect it to grow at a higher pace than
industry. We have marginally revised upwards our estimates to factor in the
higher-than-estimated top-line growth in 1QFY2011.
Exhibit 10: Change in estimates
Old New % chg
Parameter (Rs cr)
FY11E FY12E FY11E FY12E FY11E FY12E
Sales 1061 1272 1103 1324 4 4
EBITDA 203 234 211 244 4 4
EBITDA margin (%) 19 18 19 18
PAT 137 176 143 184 4 5
Source: Company, Angel Research
Overall, we estimate RAIL to register a CAGR of 21% and 36% in net sales and
profit over FY2010-12E, respectively. Over the last one year, the RAIL stock has
outperformed the Sensex by 121%. At the CMP of Rs1,212, the stock is trading at
fair valuations of 12.8x FY2012E EPS. Hence, we recommend a Neutral on the
stock.
July 23, 2010 9
10. Rallis India|1QFY2011 Result Update
Exhibit 11: Key Assumptions
FY2011E FY2012E Comment
Domestic growth (%) 18.0 15.0 Robust volume growth on account of normal monsoon
Export growth (%) 46.0 35.0 Revival in export market, lower inventory in LAT-AM markets
Total revenue growth (%) 22.8 20.0
Gross margins (%) 39.7 38.8 Marginal reduction for higher volumes
EBITDA margin 19.1 18.4 Higher contribution from low margin contract manufacturing business
Tax rate (%) 32.2 23.4 Lower rate due to SEZ benefit
Source: Company, Angel Research
Exhibit 12: Peer Valuation
Company Reco Mcap CMP TP Upside P/E (x) EV/Sales (x) EV/EBITDA (x) RoE (%) CAGR (%)
(Rs cr) (Rs) (Rs) (%) FY11E FY12E FY11E FY12E FY11E FY12E FY11E FY12E Sales PAT
Rallis Neutral 2,363 1,212 - - 16.5 12.8 2.0 1.6 10.6 8.9 30.4 32.1 21.3 36.5
Bayer CropScience Neutral 3,280 830 - - 18.6 16.0 1.6 1.3 12.4 10.3 27.7 25.5 15.3 22.9
United Phosphorus Buy 7,934 181 228 26 12.4 10.3 1.5 1.4 8.0 6.8 19.1 19.7 11.2 17.7
Nagarjuna Agrichem NR 499 335 - - 7.5 6.1 0.7 0.6 3.9 3.1 29.0 28.0 13.8 17.0
Source: Company, Angel Research; Note: NR – Not Rated
July 23, 2010 10
16. Rallis India|1QFY2011 Result Update
Research Team Tel: 022 - 4040 3800 E-mail: research@angeltrade.com Website: www.angeltrade.com
DISCLAIMER
This document is solely for the personal information of the recipient, and must not be singularly used as the basis of any investment
decision. Nothing in this document should be construed as investment or financial advice. Each recipient of this document should make
such investigations as they deem necessary to arrive at an independent evaluation of an investment in the securities of the companies
referred to in this document (including the merits and risks involved), and should consult their own advisors to determine the merits and
risks of such an investment.
Angel Broking Limited, its affiliates, directors, its proprietary trading and investment businesses may, from time to time, make
investment decisions that are inconsistent with or contradictory to the recommendations expressed herein. The views contained in this
document are those of the analyst, and the company may or may not subscribe to all the views expressed within.
Reports based on technical and derivative analysis center on studying charts of a stock's price movement, outstanding positions and
trading volume, as opposed to focusing on a company's fundamentals and, as such, may not match with a report on a company's
fundamentals.
The information in this document has been printed on the basis of publicly available information, internal data and other reliable
sources believed to be true, but we do not represent that it is accurate or complete and it should not be relied on as such, as this
document is for general guidance only. Angel Broking Limited or any of its affiliates/ group companies shall not be in any way
responsible for any loss or damage that may arise to any person from any inadvertent error in the information contained in this report.
Angel Broking Limited has not independently verified all the information contained within this document. Accordingly, we cannot testify,
nor make any representation or warranty, express or implied, to the accuracy, contents or data contained within this document. While
Angel Broking Limited endeavours to update on a reasonable basis the information discussed in this material, there may be regulatory,
compliance, or other reasons that prevent us from doing so.
This document is being supplied to you solely for your information, and its contents, information or data may not be reproduced,
redistributed or passed on, directly or indirectly.
Angel Broking Limited and its affiliates may seek to provide or have engaged in providing corporate finance, investment banking or
other advisory services in a merger or specific transaction to the companies referred to in this report, as on the date of this report or in
the past.
Neither Angel Broking Limited, nor its directors, employees or affiliates shall be liable for any loss or damage that may arise from or in
connection with the use of this information.
Note: Please refer to the important `Stock Holding Disclosure' report on the Angel website (Research Section). Also, please
refer to the latest update on respective stocks for the disclosure status in respect of those stocks. Angel Broking Limited and
its affiliates may have investment positions in the stocks recommended in this report.
Disclosure of Interest Statement Rallis India
1. Analyst ownership of the stock No
2. Angel and its Group companies ownership of the stock No
3. Angel and its Group companies' Directors ownership of the stock No
4. Broking relationship with company covered No
Note: We have not considered any Exposure below Rs 1 lakh for Angel, its Group companies and Directors.
Ratings (Returns) : Buy (> 15%) Accumulate (5% to 15%) Neutral (-5 to 5%)
Reduce (-5% to 15%) Sell (< -15%)
July 23, 2010 16