1. Derivative Report
India Research
May 25, 2010
Comments
Nifty Vs OI
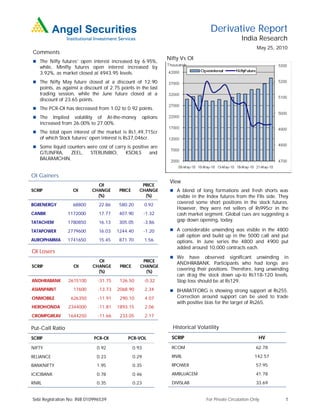
The Nifty futures’ open interest increased by 6.95%,
while, Minifty futures open interest increased by
3.92%, as market closed at 4943.95 levels.
The Nifty May future closed at a discount of 12.90
points, as against a discount of 2.75 points in the last
trading session, while the June future closed at a
discount of 23.65 points.
The PCR-OI has decreased from 1.02 to 0.92 points.
The Implied volatility of At-the-money options
increased from 26.00% to 27.00%.
The total open interest of the market is Rs1,49,715cr
of which Stock futures’ open interest is Rs37,046cr.
Some liquid counters were cost of carry is positive are
GTLINFRA, ZEEL, STERLINBIO, KSOILS and
BALRAMCHIN.
OI Gainers
View
OI PRICE
SCRIP OI CHANGE PRICE CHANGE A blend of long formations and fresh shorts was
(%) (%) visible in the Index futures from the FIIs side. They
BGRENERGY 68800 22.86 580.20 0.92
covered some short positions in the stock futures.
However, they were net sellers of Rs995cr in the
CANBK 1172000 17.77 407.90 -1.32 cash market segment. Global cues are suggesting a
TATACHEM 1780850 16.13 305.05 -3.86
gap down opening, today.
TATAPOWER 2779600 16.03 1244.40 -1.20 A considerable unwinding was visible in the 4800
call option and build up in the 5000 call and put
AUROPHARMA 1741650 15.45 871.70 1.56 options. In June series the 4800 and 4900 put
added around 10,000 contracts each.
OI Losers
We have observed significant unwinding in
OI PRICE
ANDHRABANK. Participants who had longs are
SCRIP OI CHANGE PRICE CHANGE
(%) (%)
covering their positions. Therefore, long unwinding
can drag the stock down up-to Rs118-120 levels.
ANDHRABANK 2615100 -31.75 126.50 -0.32 Stop loss should be at Rs129.
ASIANPAINT 17600 -13.73 2068.90 2.34 BHARATFORG is showing strong support at Rs255.
ONMOBILE 626350 -11.91 290.10 4.07 Correction around support can be used to trade
with positive bias for the target of Rs265.
HEROHONDA 2344000 -11.81 1893.15 2.06
CROMPGREAV 1644250 -11.66 233.05 2.17
Put-Call Ratio Historical Volatility
SCRIP PCR-OI PCR-VOL SCRIP HV
NIFTY 0.92 0.93 RCOM 62.78
RELIANCE 0.23 0.29 RNRL 142.57
BANKNIFTY 1.95 0.35 RPOWER 57.95
ICICIBANK 0.78 0.46 AMBUJACEM 41.78
RNRL 0.35 0.23 DIVISLAB 33.69
Sebi Registration No: INB 010996539 For Private Circulation Only 1
2. Derivative Report | India Research
FII Statistics for 24-May-2010 Turnover on 24-May-2010
Open Interest
No. of Turnover Change
Detail Buy Sell Net Instrument
Contracts (Rs. in cr.) (%)
Contracts Value Change
(Rs. in cr.) (%)
INDEX Index Futures 936647 21924.46 0.83
5285.56 5005.47 280.08 724708 17815.98 9.00
FUTURES
INDEX Stock Futures 915334 26413.41 15.79
6361.98 5644.14 717.84 2076701 51302.90 2.69
OPTIONS
STOCK Index Options 2641352 66332.23 -8.01
6600.04 5772.16 827.88 1052856 29314.21 -0.14
FUTURES
STOCK Stock Options 121193 3854.23 -5.04
275.27 285.55 (10.27) 52595 1601.97 -1.06
OPTIONS
TOTAL 18522.85 16707.32 1,815.53 3906860 100035.06 2.96 Total 4614526 118524.33 -1.82
Nifty Spot = 4943.95 Lot Size = 50
Bull-Call Spreads Bear-Put Spreads
Action Strike Price Risk Reward BEP Action Strike Price Risk Reward BEP
Buy 5000 21.35 Buy 4900 37.65
17.75 82.25 5017.75 24.90 75.10 4875.10
Sell 5100 3.60 Sell 4800 12.75
Buy 5000 21.35 Buy 4900 37.65
20.15 179.85 5020.15 33.75 166.25 4866.25
Sell 5200 1.20 Sell 4700 3.90
Buy 5100 3.60 Buy 4800 12.75
2.40 97.60 5102.40 8.85 91.15 4791.15
Sell 5200 1.20 Sell 4700 3.90
Note: Above mentioned Bullish or Bearish Spreads in Nifty (May Series) are given as an information and not as a recommendation
Nifty Put-Call Analysis
For Private Circulation Only Sebi Registration No: INB 010996539 2
3. Derivative Report | India Research
Strategy Date Scrip Strategy Status
30-04-2010 RELCAPITAL Long Call Ladder Continue
30-04-2010 NAGARFERT Long Call Continue
08-05-2010 HINDUNILVR Short Strangle Profit booked on 21-05-2010
17-May-2010 CAIRN Long Put Profit booked on 20-05-2010
24-May-2010 MARUTI Long Call Continue
24-May-2010 STER Long Call Continue
DISCLAIMER:
This document is not for public distribution and has been furnished to you solely for your information and must not be reproduced or redistributed to any other person.
Persons into whose possession this document may come are required to observe these restrictions.
Opinion expressed is our current opinion as of the date appearing on this material only. While we endeavor to update on a reasonable basis the information discussed in
this material, there may be regulatory, compliance, or other reasons that prevent us from doing so. Prospective investors and others are cautioned that any forward-
looking statements are not predictions and may be subject to change without notice. Our proprietary trading and investment businesses may make investment decisions
that are inconsistent with the recommendations expressed herein.
The information in this document has been printed on the basis of publicly available information, internal data and other reliable sources believed to be true and are for
general guidance only. While every effort is made to ensure the accuracy and completeness of information contained, the company takes no guarantee and assumes no
liability for any errors or omissions of the information. No one can use the information as the basis for any claim, demand or cause of action.
Recipients of this material should rely on their own investigations and take their own professional advice. Each recipient of this document should make such investigations
as it deems necessary to arrive at an independent evaluation of an investment in the securities of companies referred to in this document (including the merits and risks
involved), and should consult their own advisors to determine the merits and risks of such an investment. Price and value of the investments referred to in this material may
go up or down. Past performance is not a guide for future performance.
Certain transactions - futures, options and other derivatives as well as non-investment grade securities - involve substantial risks and are not suitable for all investors.
Reports based on technical analysis centers on studying charts of a stock's price movement and trading volume, as opposed to focusing on a company's fundamentals and
as such, may not match with a report on a company's fundamentals.
We do not undertake to advise you as to any change of our views expressed in this document. While we would endeavor to update the information herein on a reasonable
basis, Angel Broking, its subsidiaries and associated companies, their directors and employees are under no obligation to update or keep the information current. Also
there may be regulatory, compliance, or other reasons that may prevent Angel Broking and affiliates from doing so. Prospective investors and others are cautioned that
any forward-looking statements are not predictions and may be subject to change without notice.
Angel Broking Limited and affiliates, including the analyst who has issued this report, may, on the date of this report, and from time to time, have long or short positions
in, and buy or sell the securities of the companies mentioned herein or engage in any other transaction involving such securities and earn brokerage or compensation or
act as advisor or have other potential conflict of interest with respect to company/ies mentioned herein or inconsistent with any recommendation and related information
and opinions.
Angel Broking Limited and affiliates may seek to provide or have engaged in providing corporate finance, investment banking or other advisory services in a merger or
specific transaction to the companies referred to in this report, as on the date of this report or in the past.
Sebi Registration No.: INB 010996539
Derivative Research Team derivatives.desk@angeltrade.com
For Private Circulation Only Sebi Registration No: INB 010996539 3