Call Girls In Noida 959961⊹3876 Independent Escort Service Noida
Derivatives report 04 june-2010
1. Derivative Report
India Research
June 04, 2010
Comments
Nifty Vs OI
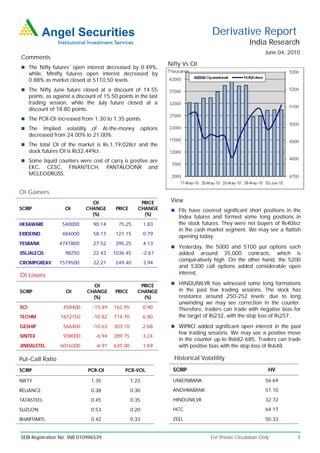
The Nifty futures’ open interest decreased by 0.49%,
while, Minifty futures open interest decreased by
0.88% as market closed at 5110.50 levels.
The Nifty June future closed at a discount of 14.55
points, as against a discount of 15.50 points in the last
trading session, while the July future closed at a
discount of 18.80 points.
The PCR-OI increased from 1.30 to 1.35 points.
The Implied volatility of At-the-money options
decreased from 24.00% to 21.00%.
The total OI of the market is Rs.1,19,028cr and the
stock futures OI is Rs32,449cr.
Some liquid counters were cost of carry is positive are
EKC, CESC, FINANTECH, PANTALOONR and
MCLEODRUSS.
OI Gainers
OI PRICE View
SCRIP OI CHANGE PRICE CHANGE FIIs have covered significant short positions in the
(%) (%)
Index futures and formed some long positions in
HEXAWARE 540000 90.14 75.25 1.83 the stock futures. They were net buyers of Rs406cr
in the cash market segment. We may see a flattish
EXIDEIND 484000 58.17 121.15 0.79
opening today.
YESBANK 4747800 27.52 295.25 4.13
Yesterday, the 5000 and 5100 put options each
JISLJALEQS 98250 22.43 1036.45 -2.61 added around 35,000 contracts, which is
comparatively high. On the other hand, the 5200
CROMPGREAV 1579500 22.21 249.40 3.94
and 5300 call options added considerable open
OI Losers interest.
OI PRICE HINDUNILVR has witnessed some long formations
SCRIP OI CHANGE PRICE CHANGE in the past few trading sessions. The stock has
(%) (%) resistance around 250-252 levels; due to long
unwinding we may see correction in the counter.
SCI 458400 -15.49 162.95 0.90 Therefore, traders can trade with negative bias for
TECHM 1672150 -10.82 714.70 6.80 the target of Rs232, with the stop loss of Rs257.
GESHIP 566400 -10.63 303.10 2.68 WIPRO added significant open interest in the past
few trading sessions. We may see a positive move
SINTEX 938000 -6.94 289.75 3.24
in the counter up-to Rs682-685. Traders can trade
JINDALSTEL 6016300 -6.91 635.00 1.69 with positive bias with the stop loss of Rs648.
Put-Call Ratio Historical Volatility
SCRIP PCR-OI PCR-VOL SCRIP HV
NIFTY 1.35 1.23 UNIONBANK 56.69
RELIANCE 0.38 0.30 ANDHRABANK 51.10
TATASTEEL 0.45 0.35 HINDUNILVR 32.72
SUZLON 0.53 0.20 HCC 64.17
BHARTIARTL 0.42 0.33 ZEEL 50.33
SEBI Registration No: INB 010996539 For Private Circulation Only 1
2. Derivative Report | India Research
FII Statistics for 03-June-2010 Turnover on 03-June-2010
Open Interest
No. of Turnover Change
Detail Buy Sell Net Instrument
Contracts (Rs. in cr.) (%)
Contracts Value Change
(Rs. in cr.) (%)
INDEX Index Futures 609009 14326.71 -16.95
2688.11 906.04 1,782.06 511665 12960.79 -2.97
FUTURES
INDEX Stock Futures 469016 14301.32 -6.12
5063.78 5132.07 (68.30) 1732030 44244.16 2.95
OPTIONS
STOCK Index Options 1805422 45777.37 19.89
1195.43 721.41 474.01 916980 26216.27 0.73
FUTURES
STOCK Stock Options 85702 2583.18 -9.08
144.13 182.08 (37.95) 28124 891.41 5.04
OPTIONS
TOTAL 9091.44 6941.61 2,149.82 3188799 84312.63 1.33 Total 2969149 76988.58 4.73
Nifty Spot = 5110.50 Lot Size = 50
Bull-Call Spreads Bear-Put Spreads
Action Strike Price Risk Reward BEP Action Strike Price Risk Reward BEP
Buy 5200 53.60 Buy 5100 107.70
30.65 69.35 5230.65 32.80 67.20 5067.20
Sell 5300 22.95 Sell 5000 74.90
Buy 5200 53.60 Buy 5100 107.70
45.60 154.40 5245.60 56.00 144.00 5044.00
Sell 5400 8.00 Sell 4900 51.70
Buy 5300 22.95 Buy 5000 74.90
14.95 85.05 5314.95 23.20 76.80 4976.80
Sell 5400 8.00 Sell 4900 51.70
Note: Above mentioned Bullish or Bearish Spreads in Nifty (June Series) are given as an information and not as a recommendation
Nifty Put-Call Analysis
For Private Circulation Only SEBI Registration No: INB 010996539 2
3. Derivative Report | India Research
Strategy Date Scrip Strategy Status
31-May-2010 Nifty Long Put Ladder Continue
DISCLAIMER:
This document is not for public distribution and has been furnished to you solely for your information and must not be reproduced or redistributed to any other person.
Persons into whose possession this document may come are required to observe these restrictions.
Opinion expressed is our current opinion as of the date appearing on this material only. While we endeavor to update on a reasonable basis the information discussed in
this material, there may be regulatory, compliance, or other reasons that prevent us from doing so. Prospective investors and others are cautioned that any forward-
looking statements are not predictions and may be subject to change without notice. Our proprietary trading and investment businesses may make investment decisions
that are inconsistent with the recommendations expressed herein.
The information in this document has been printed on the basis of publicly available information, internal data and other reliable sources believed to be true and are for
general guidance only. While every effort is made to ensure the accuracy and completeness of information contained, the company takes no guarantee and assumes no
liability for any errors or omissions of the information. No one can use the information as the basis for any claim, demand or cause of action.
Recipients of this material should rely on their own investigations and take their own professional advice. Each recipient of this document should make such investigations
as it deems necessary to arrive at an independent evaluation of an investment in the securities of companies referred to in this document (including the merits and risks
involved), and should consult their own advisors to determine the merits and risks of such an investment. Price and value of the investments referred to in this material may
go up or down. Past performance is not a guide for future performance.
Certain transactions - futures, options and other derivatives as well as non-investment grade securities - involve substantial risks and are not suitable for all investors.
Reports based on technical analysis centers on studying charts of a stock's price movement and trading volume, as opposed to focusing on a company's fundamentals and
as such, may not match with a report on a company's fundamentals.
We do not undertake to advise you as to any change of our views expressed in this document. While we would endeavor to update the information herein on a reasonable
basis, Angel Broking, its subsidiaries and associated companies, their directors and employees are under no obligation to update or keep the information current. Also
there may be regulatory, compliance, or other reasons that may prevent Angel Broking and affiliates from doing so. Prospective investors and others are cautioned that
any forward-looking statements are not predictions and may be subject to change without notice.
Angel Broking Limited and affiliates, including the analyst who has issued this report, may, on the date of this report, and from time to time, have long or short positions
in, and buy or sell the securities of the companies mentioned herein or engage in any other transaction involving such securities and earn brokerage or compensation or
act as advisor or have other potential conflict of interest with respect to company/ies mentioned herein or inconsistent with any recommendation and related information
and opinions.
Angel Broking Limited and affiliates may seek to provide or have engaged in providing corporate finance, investment banking or other advisory services in a merger or
specific transaction to the companies referred to in this report, as on the date of this report or in the past.
Sebi Registration No.: INB 010996539
Derivative Research Team derivatives.desk@angeltrade.com
For Private Circulation Only SEBI Registration No: INB 010996539 3