Download as PPSX, PPTX
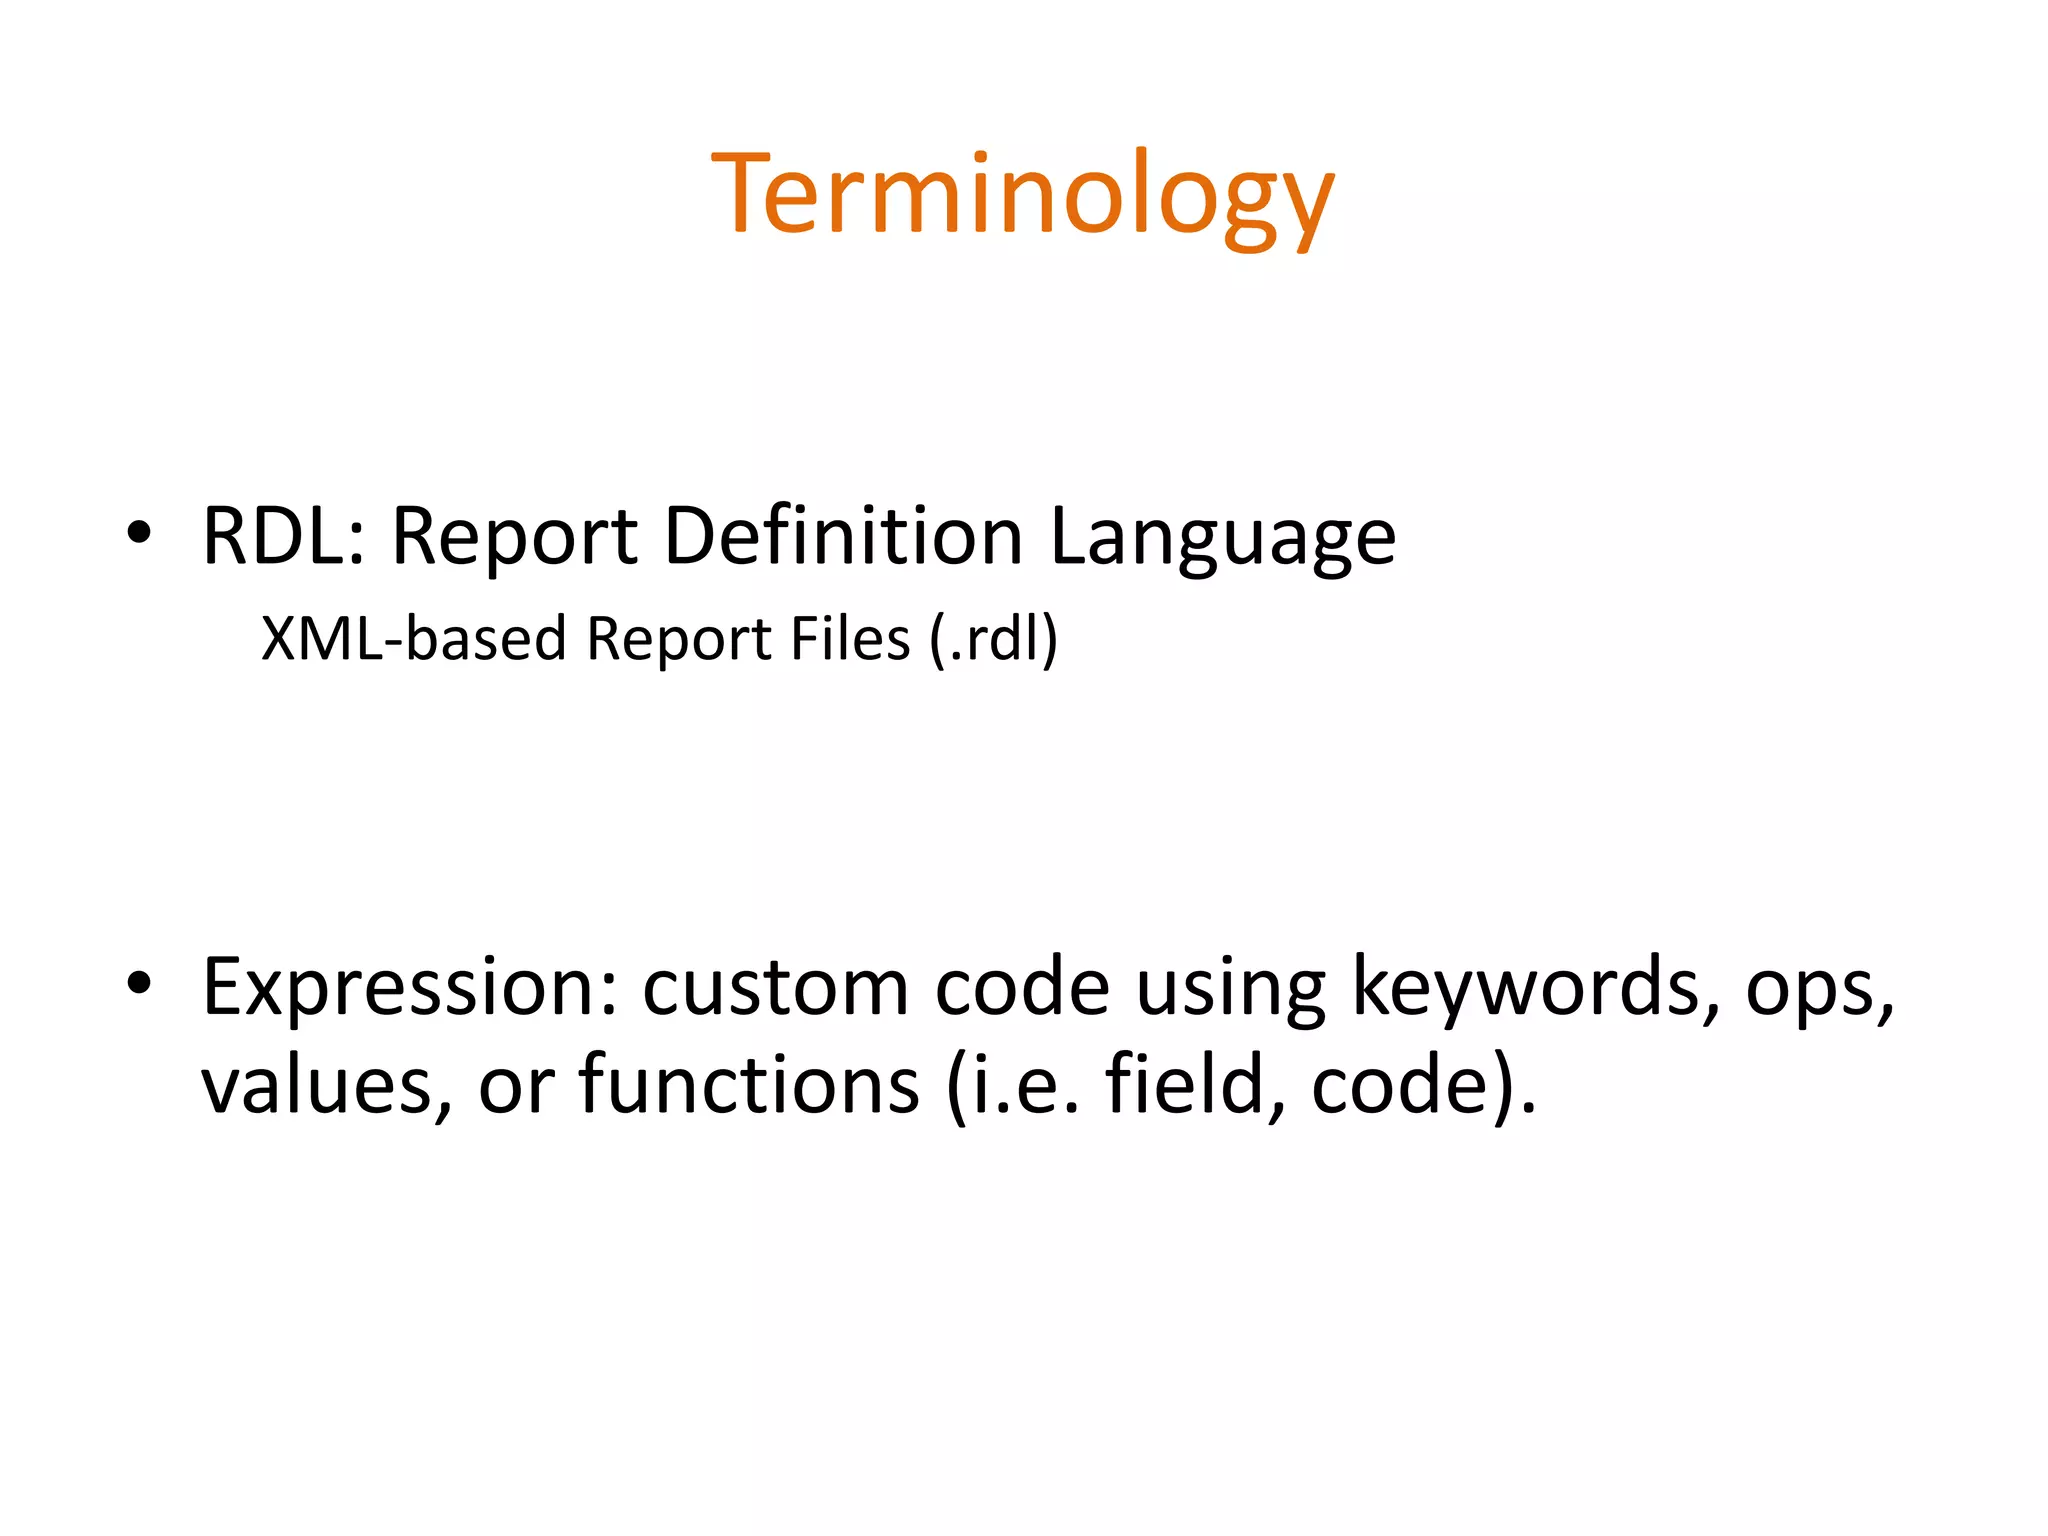
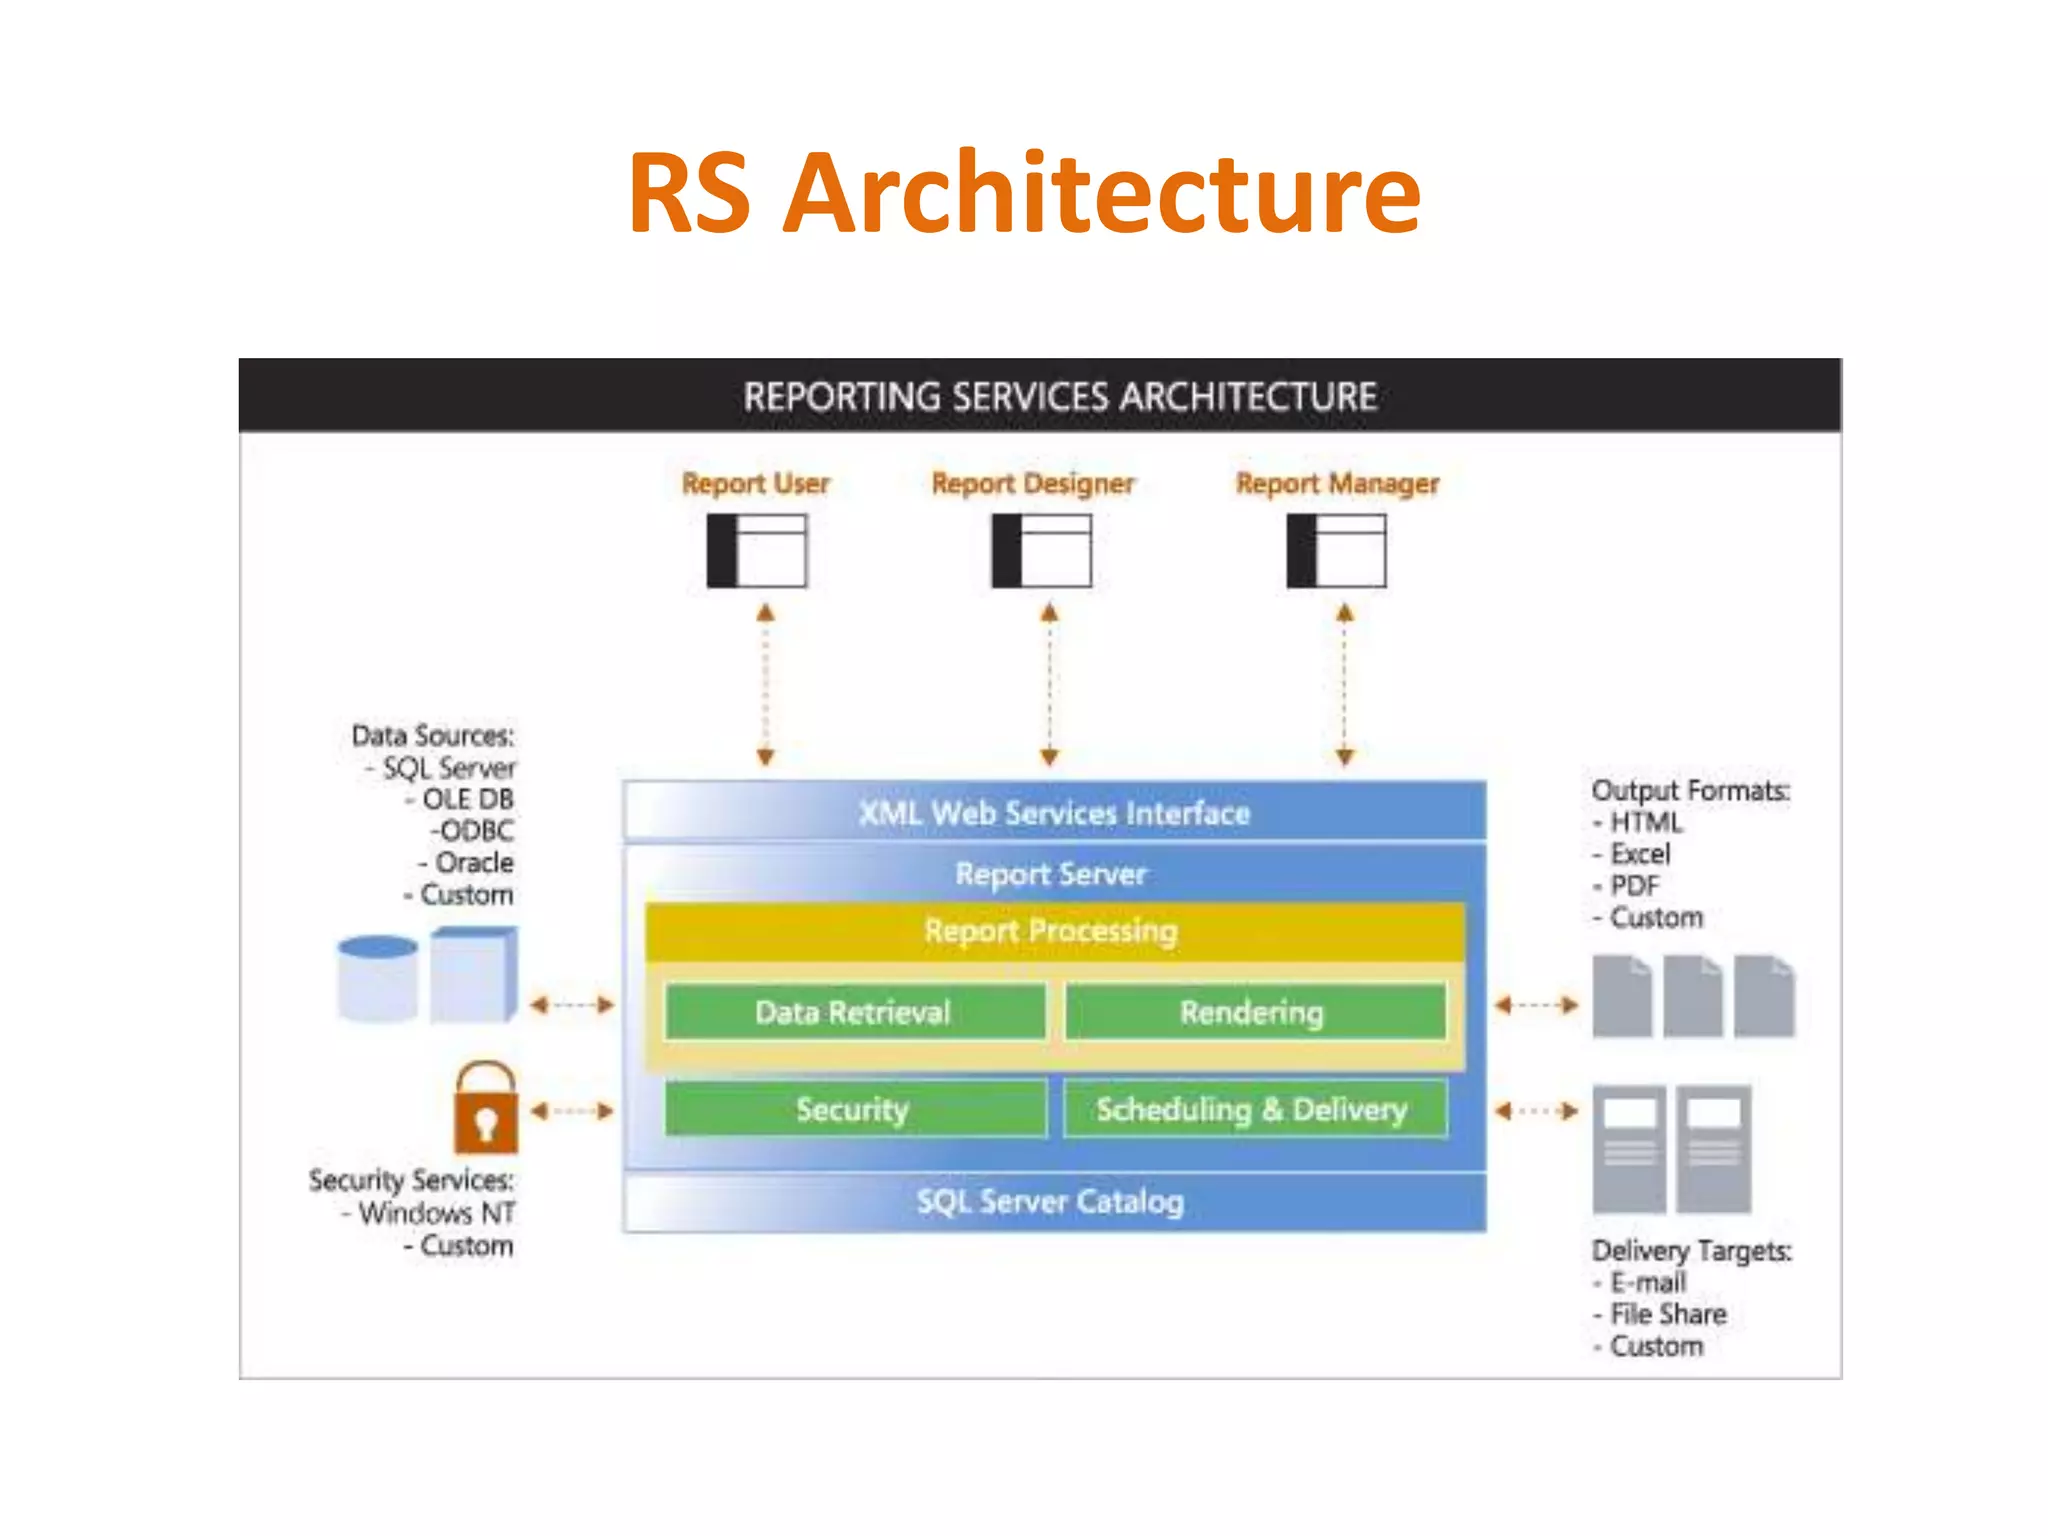
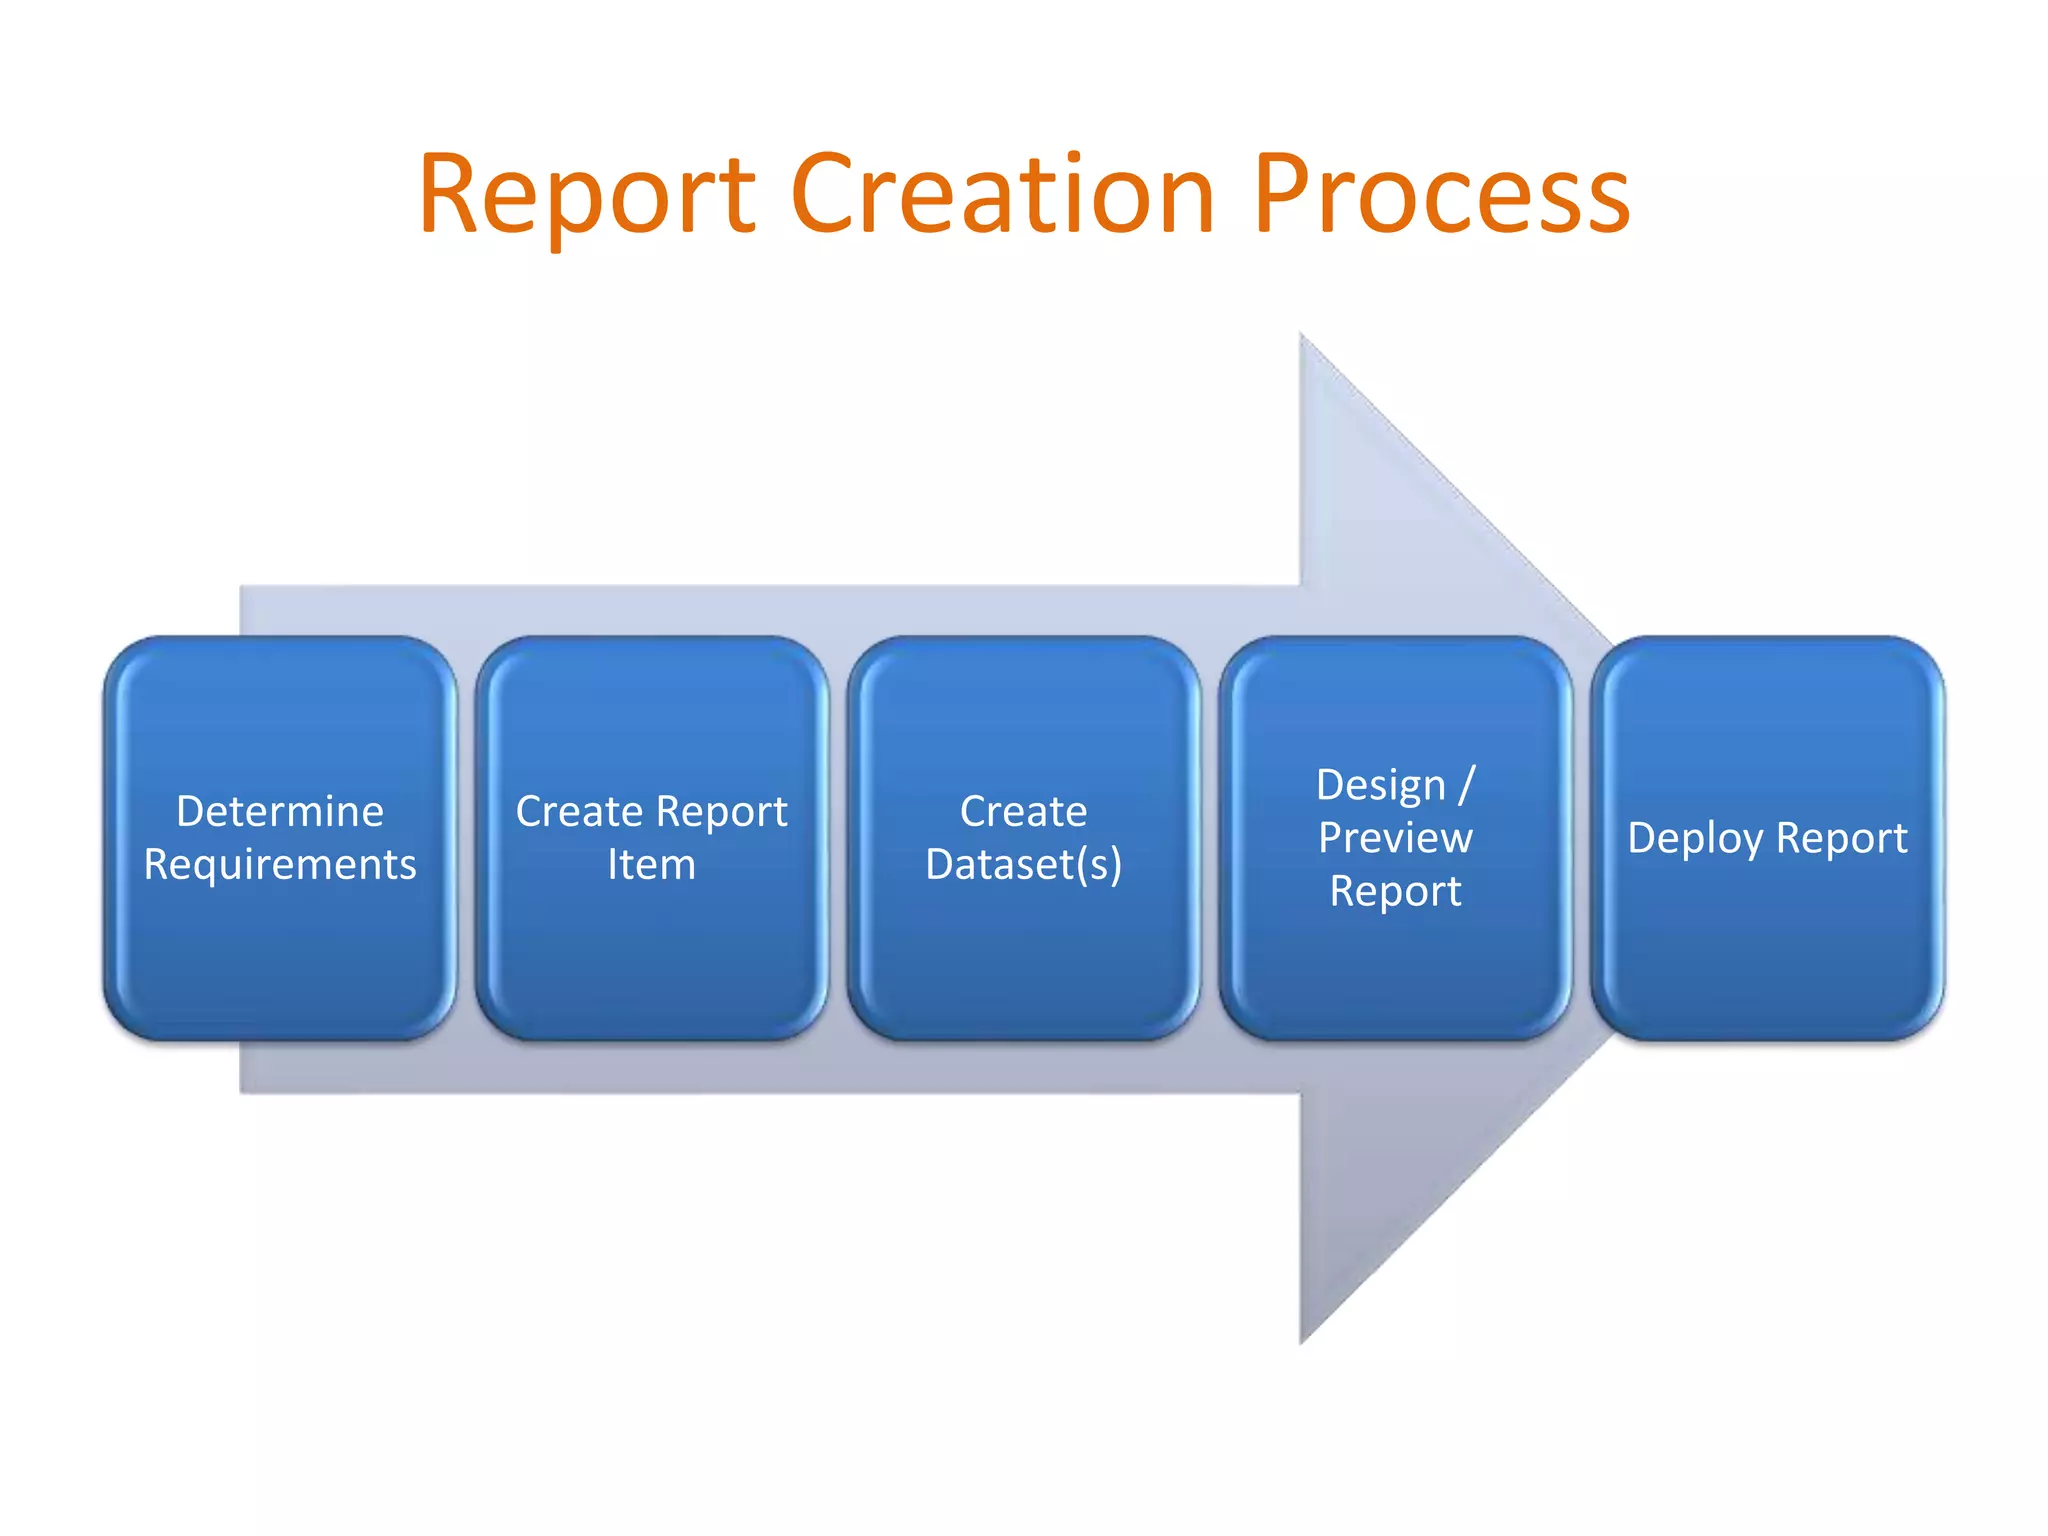
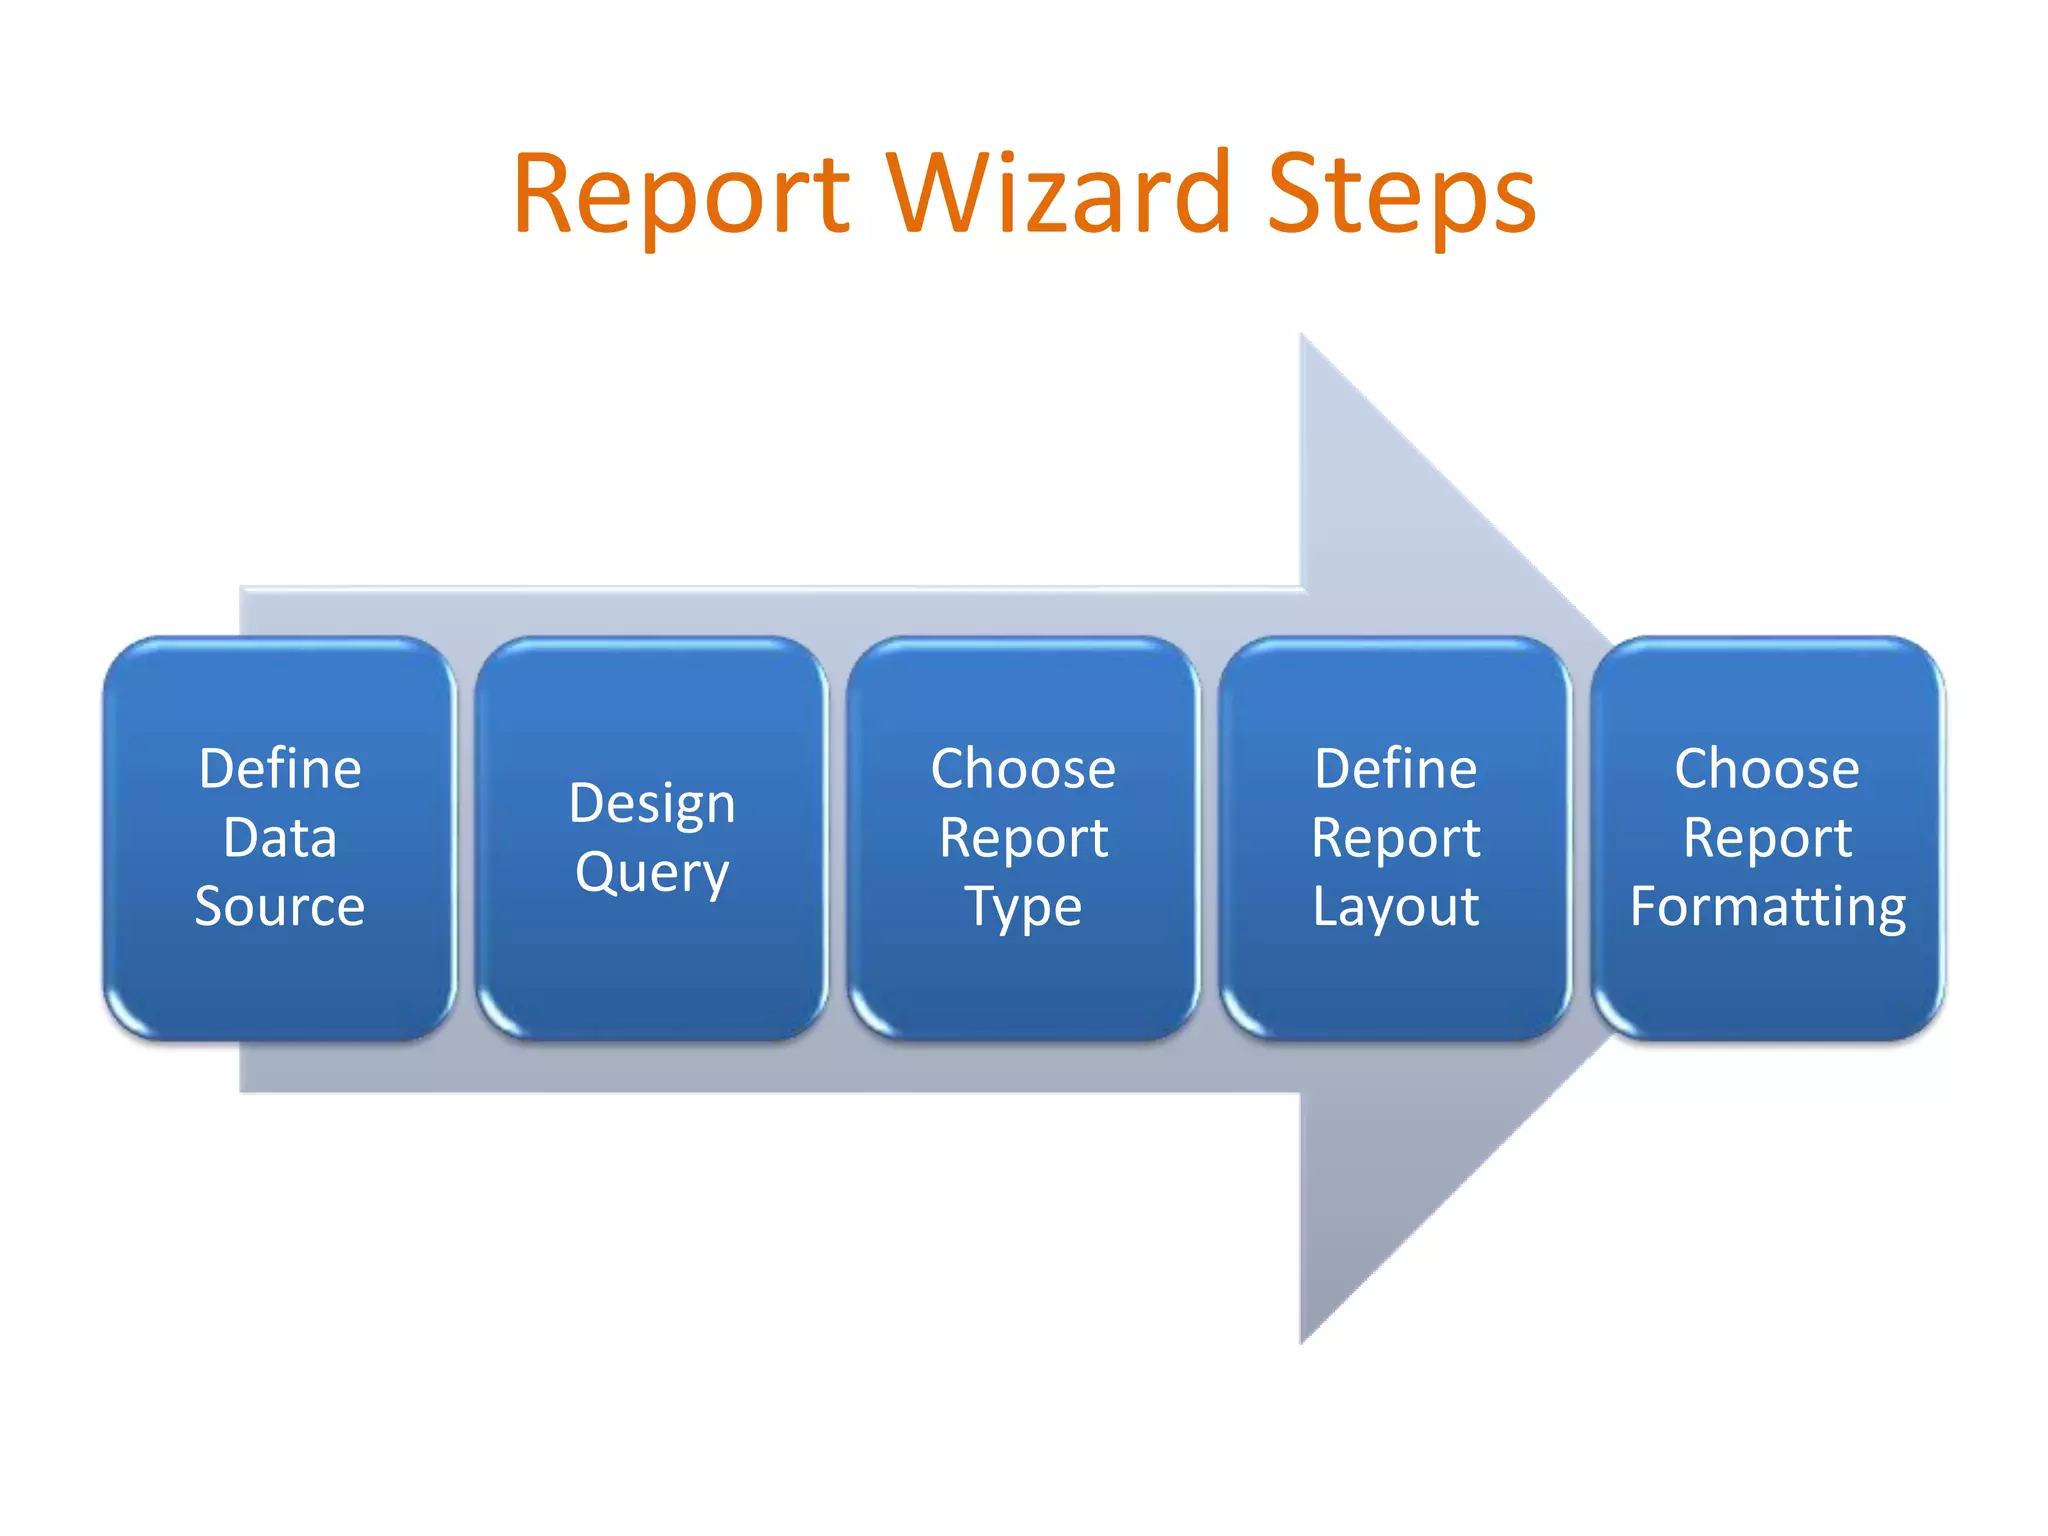
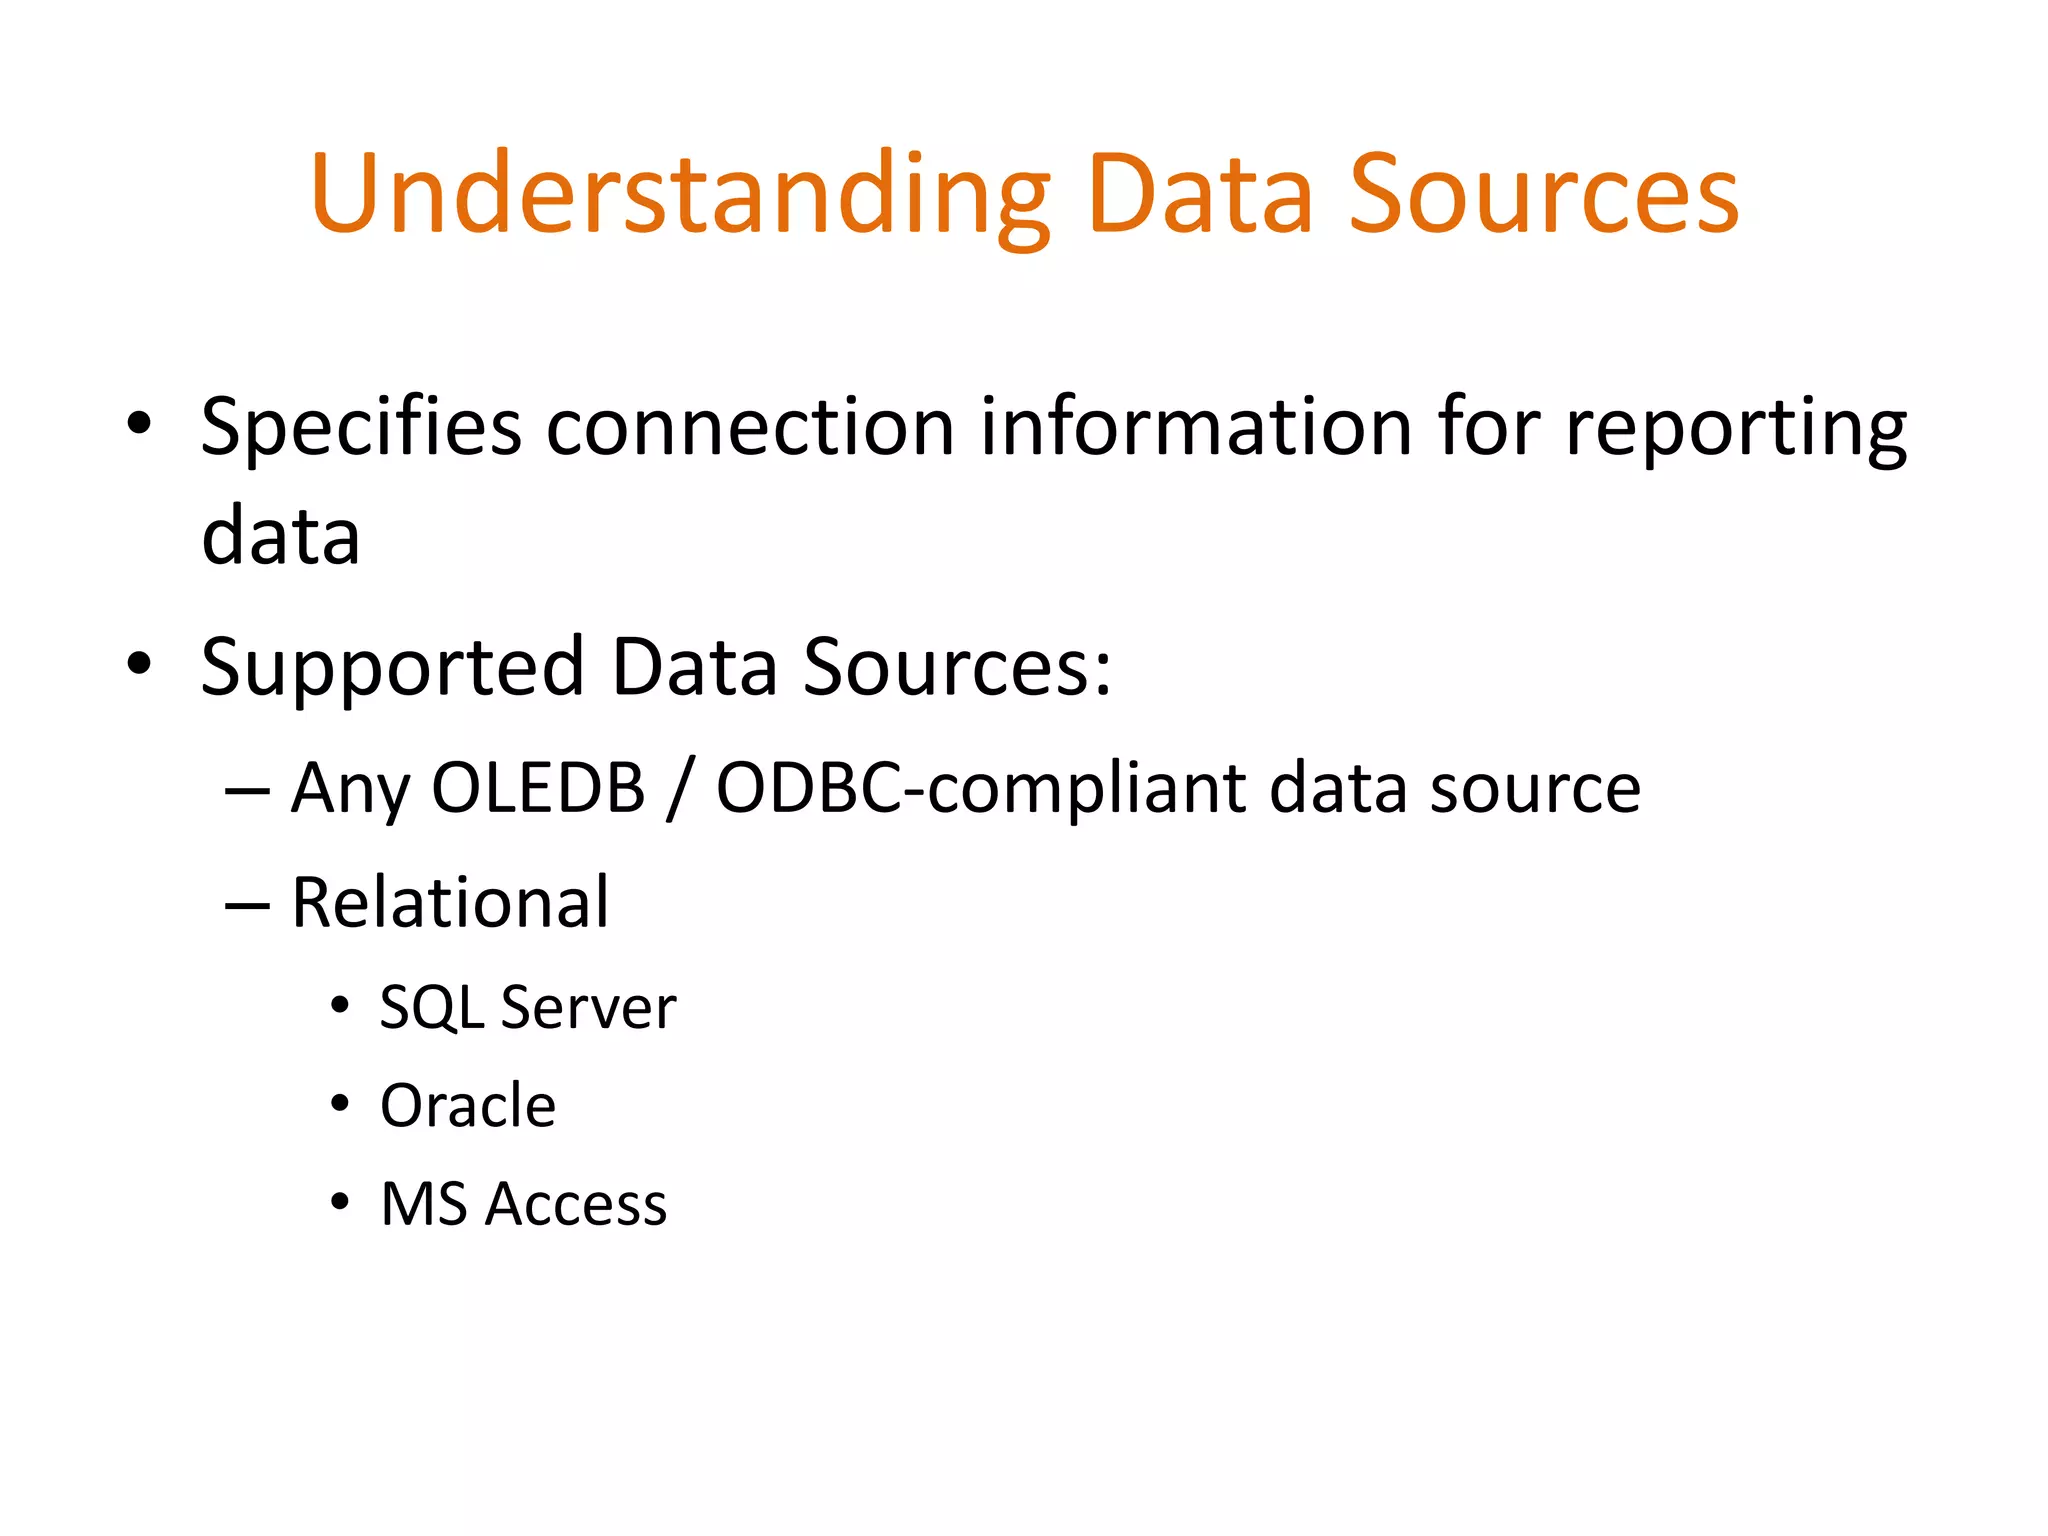
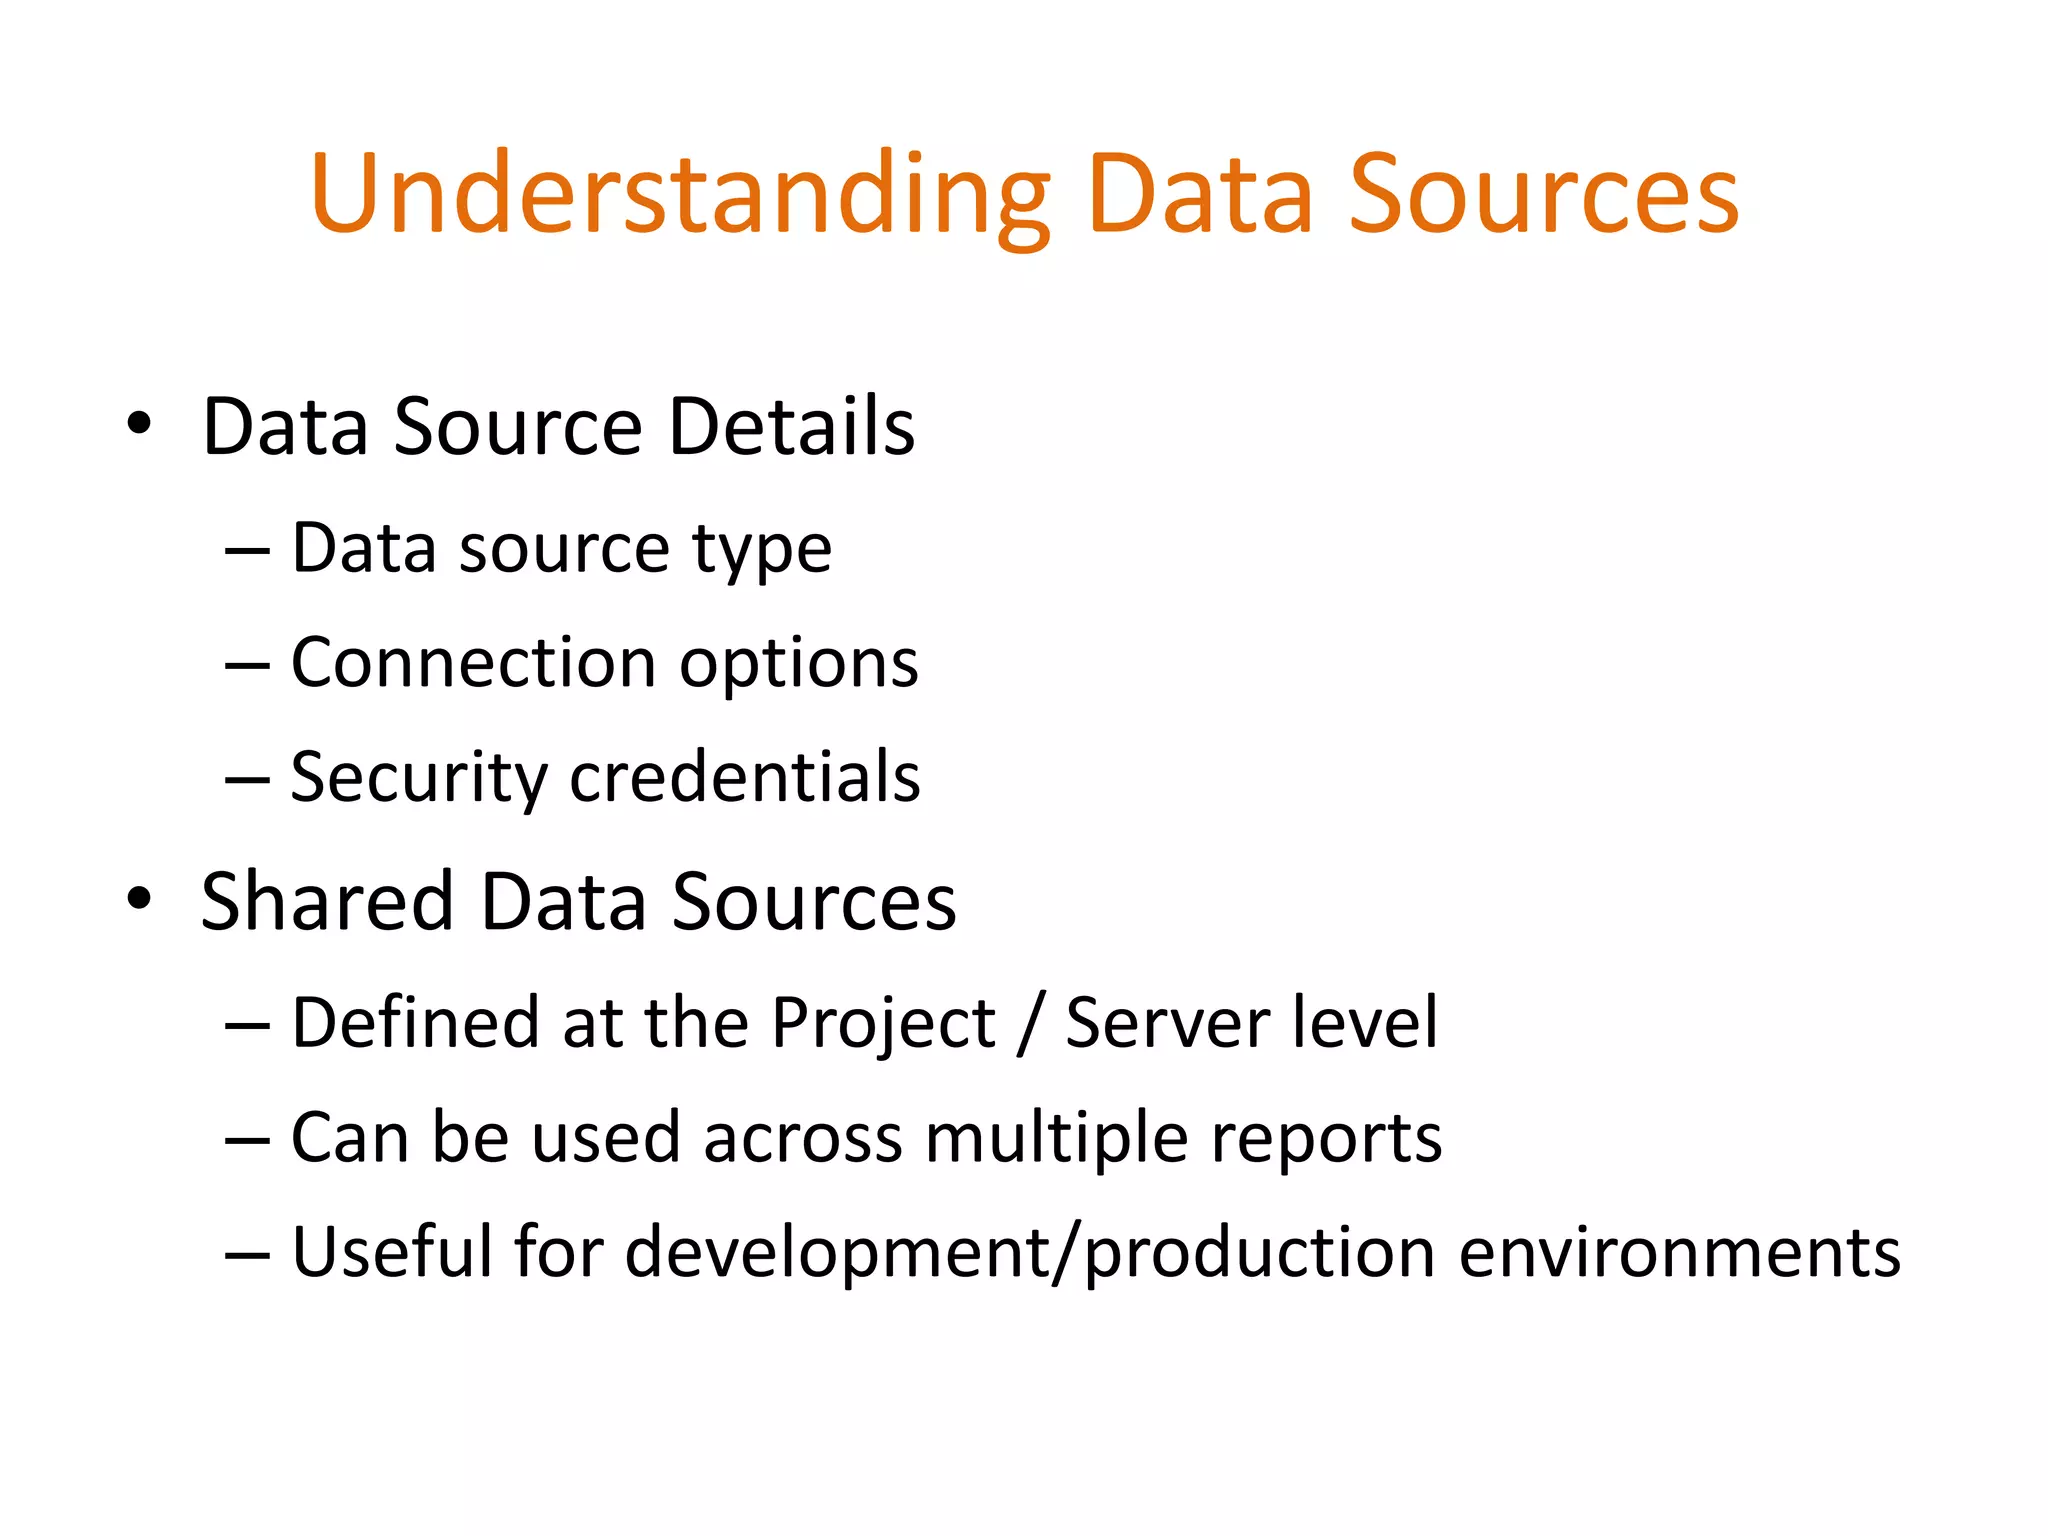
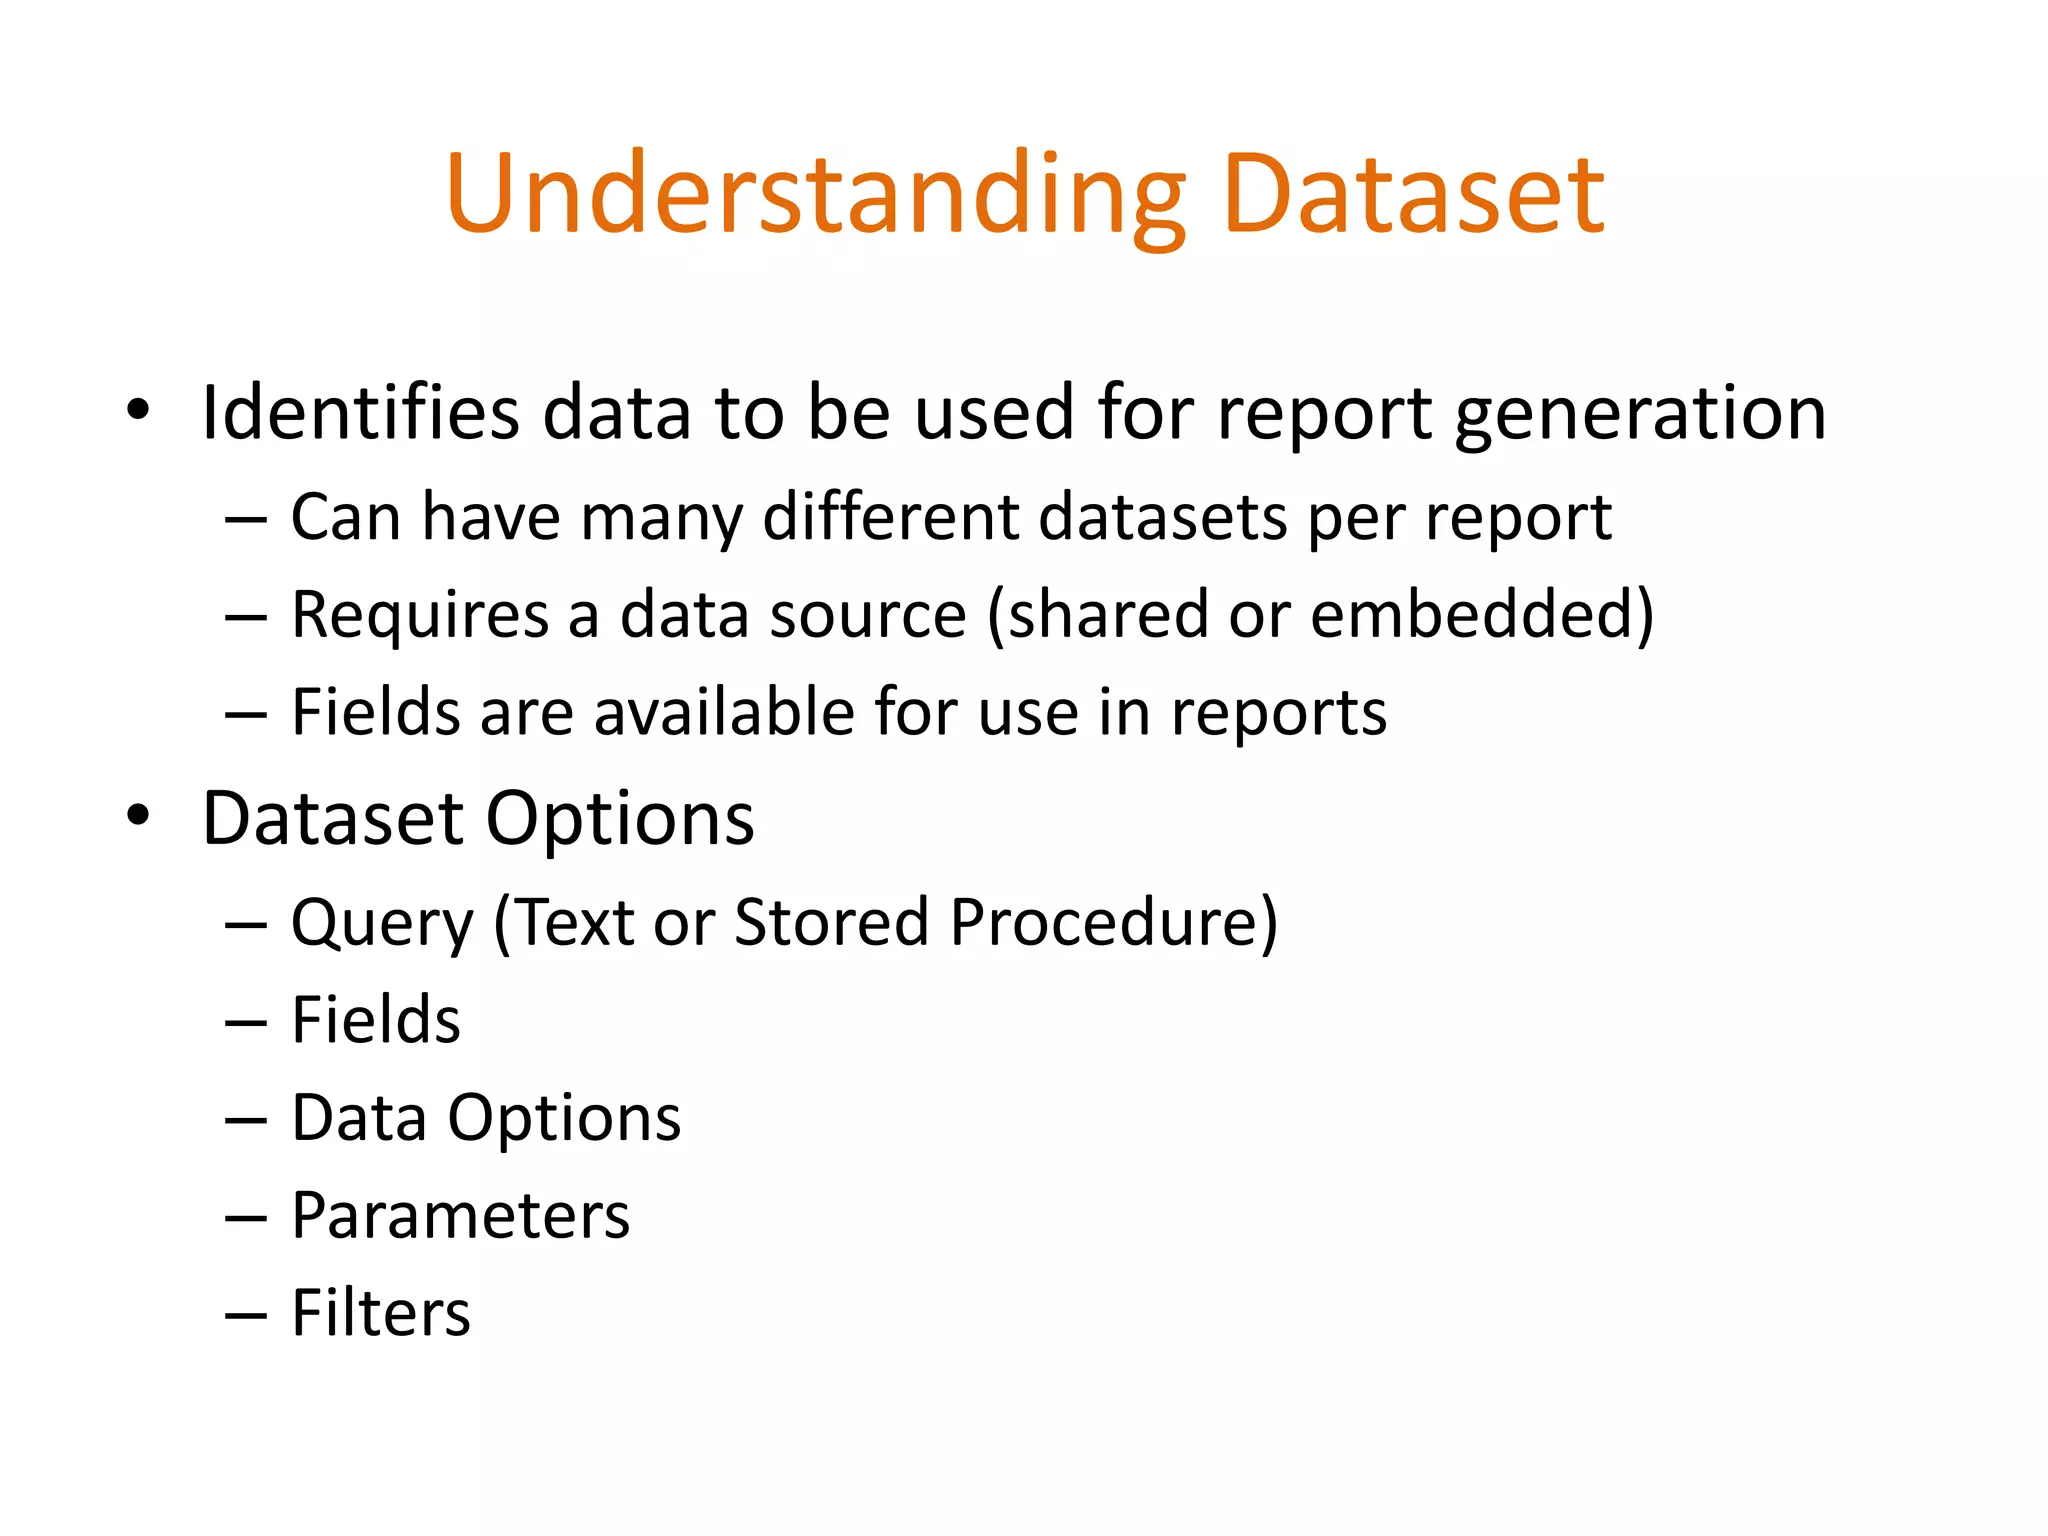
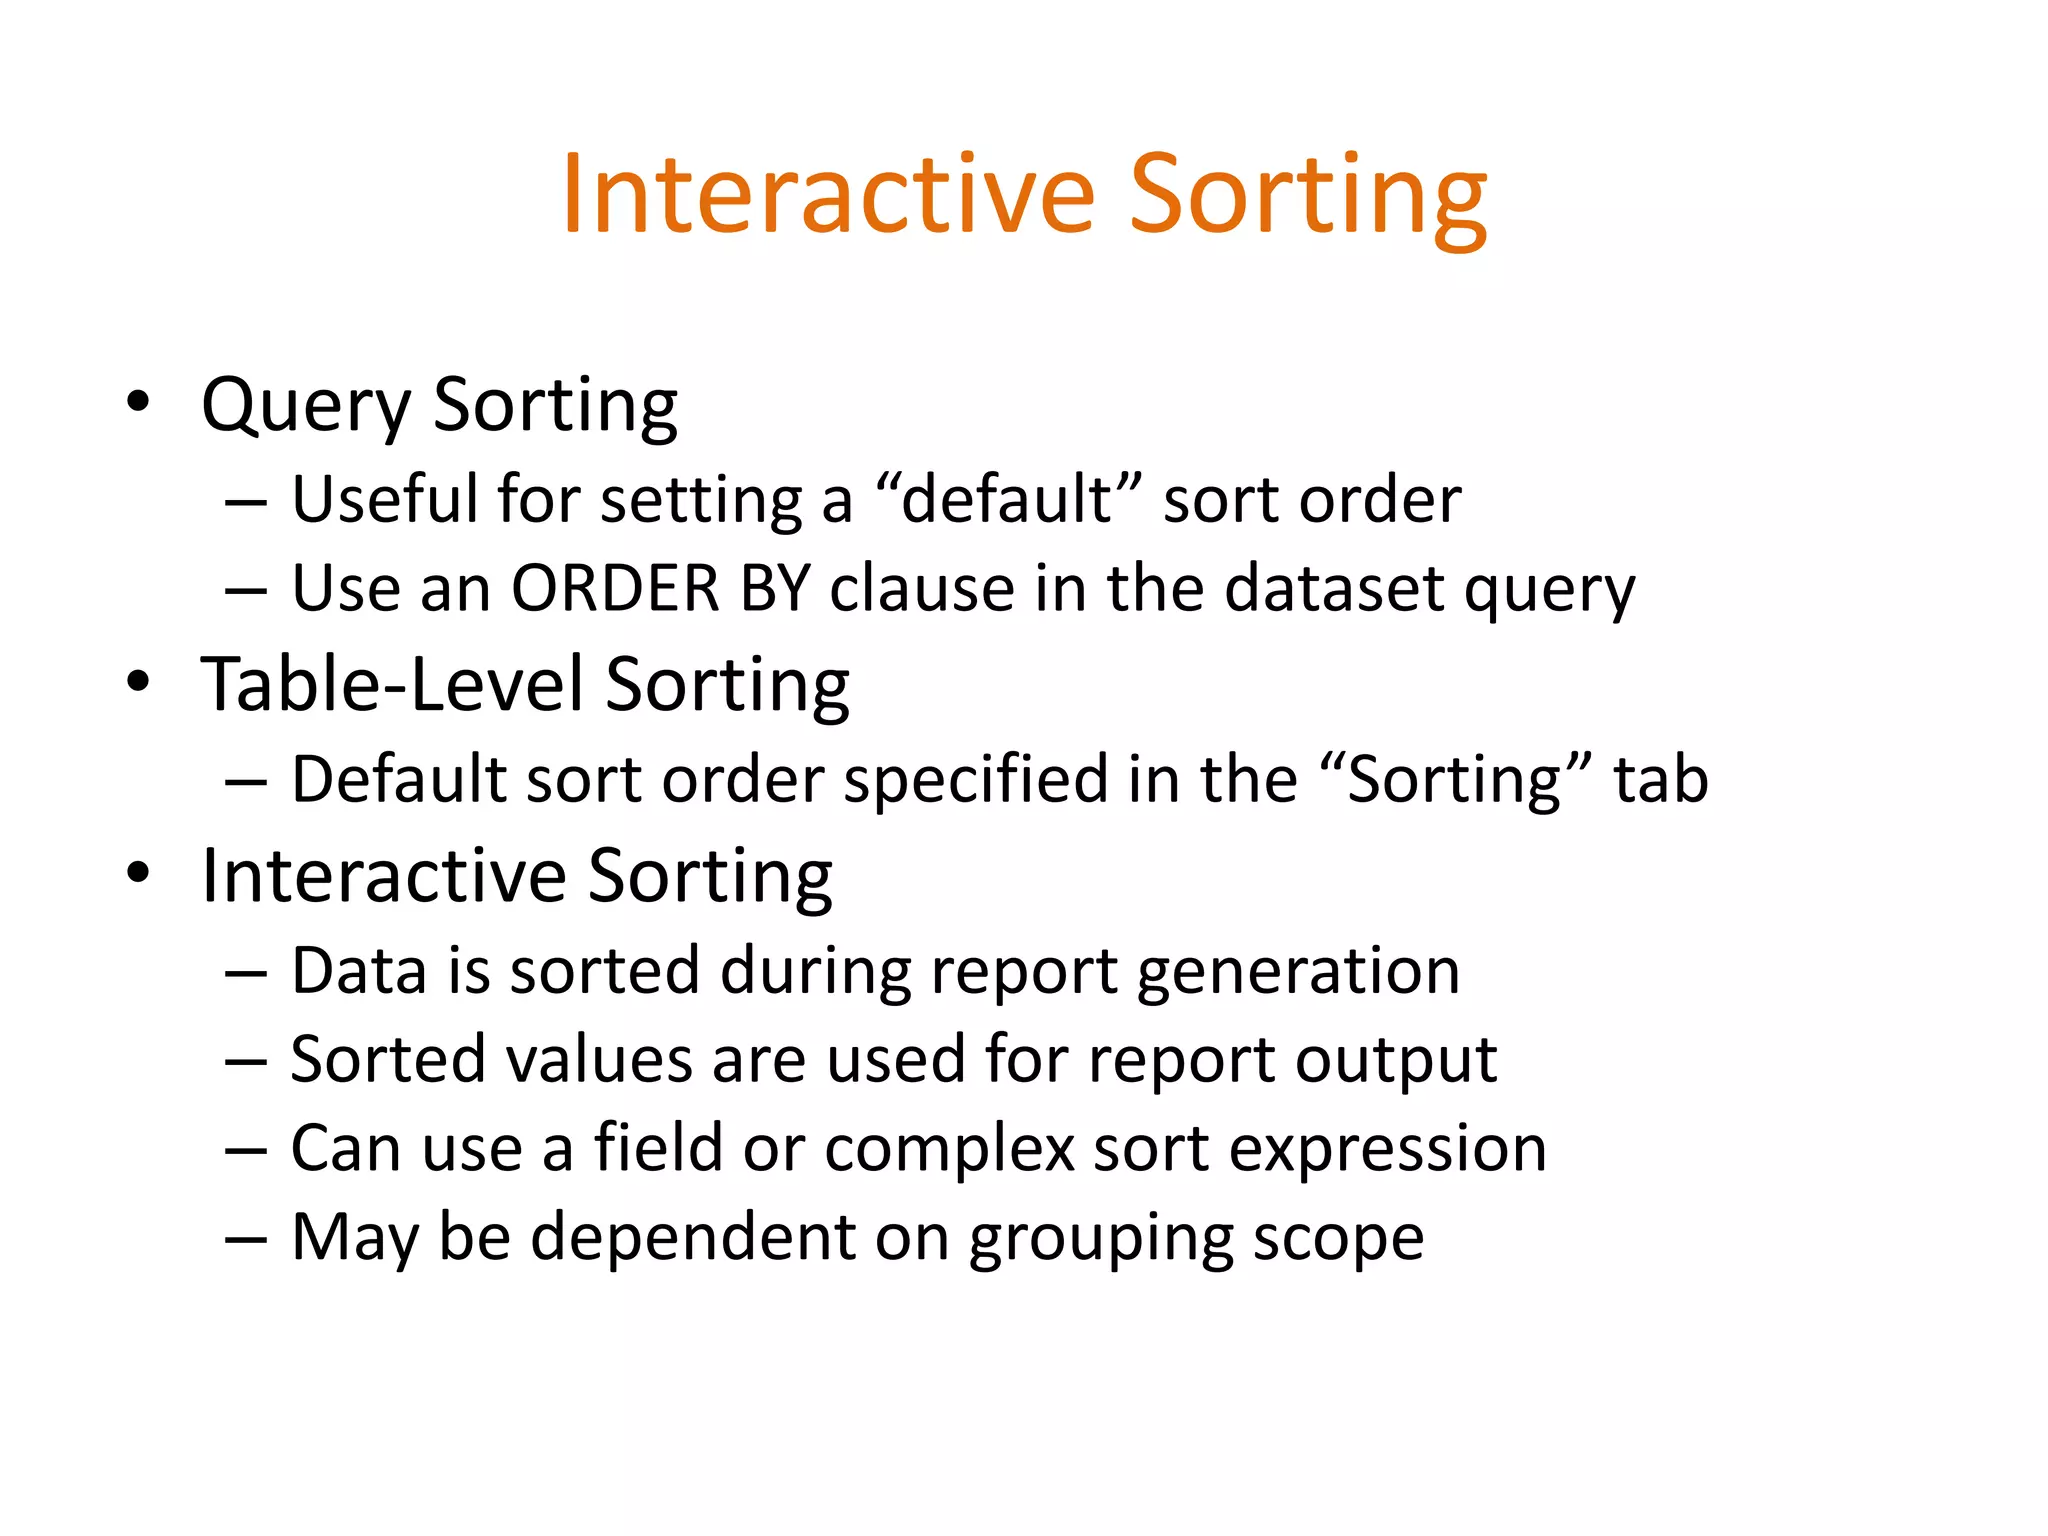
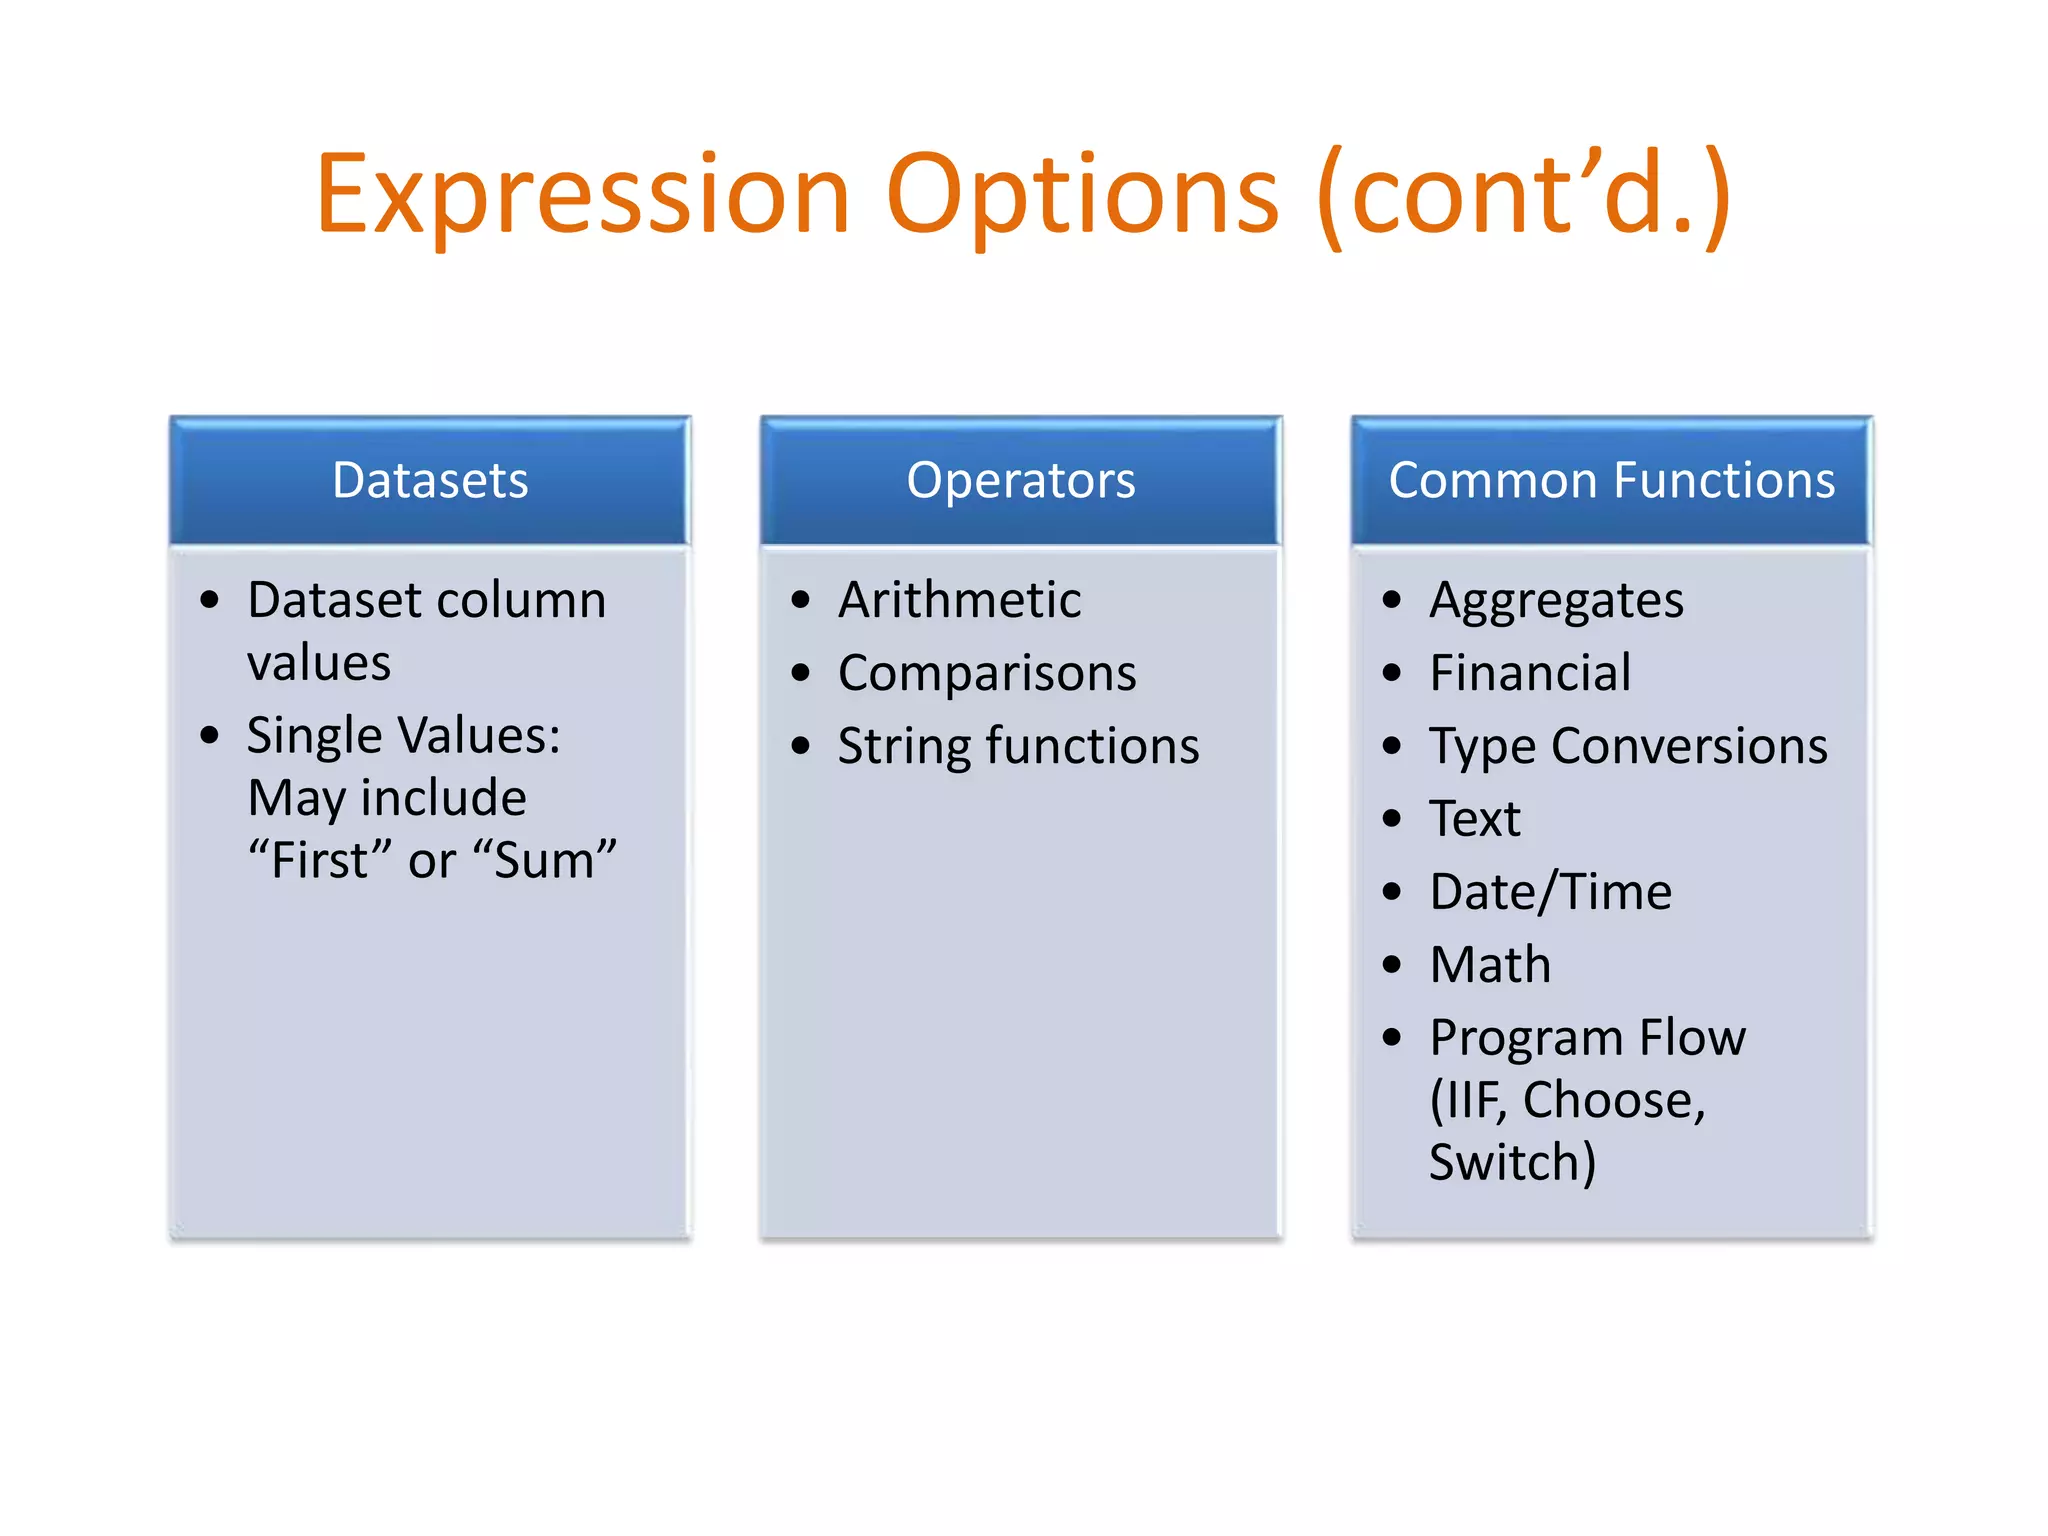
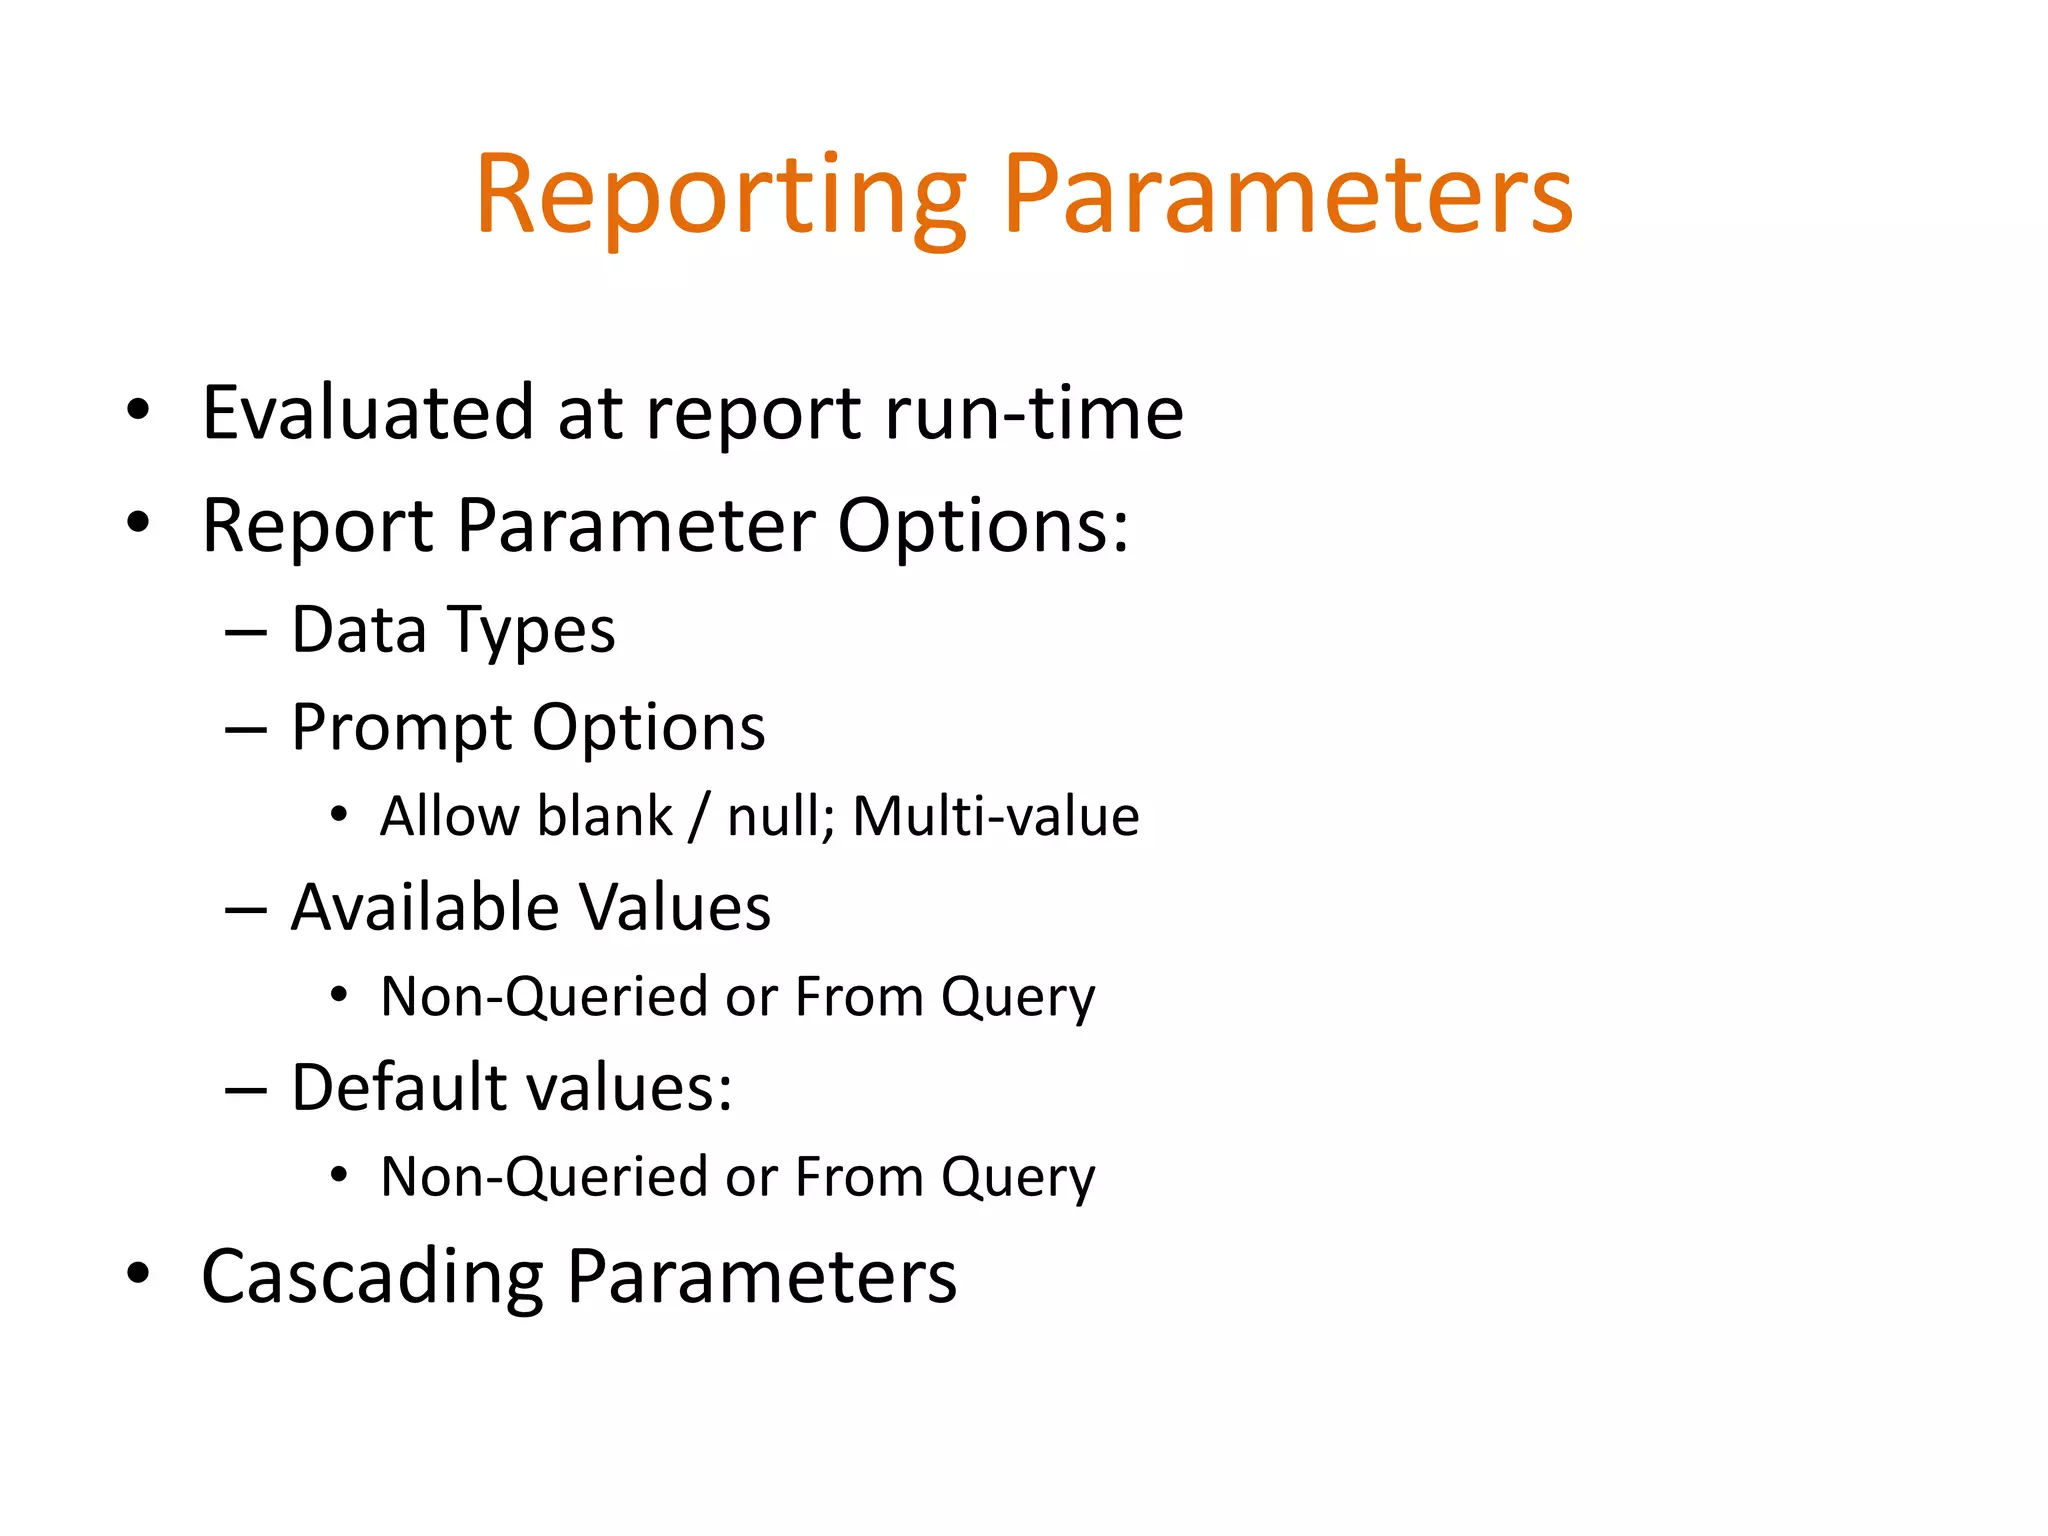


This document provides an overview of SQL Server Reporting Services including key terminology, architecture, features, and the report creation process. It discusses report definition language, expressions, data sources, datasets, query design, report layout, sorting, grouping, parameters, and more. The goal is to demonstrate report creation from determining requirements to deploying the final report.