Downloaded 100 times
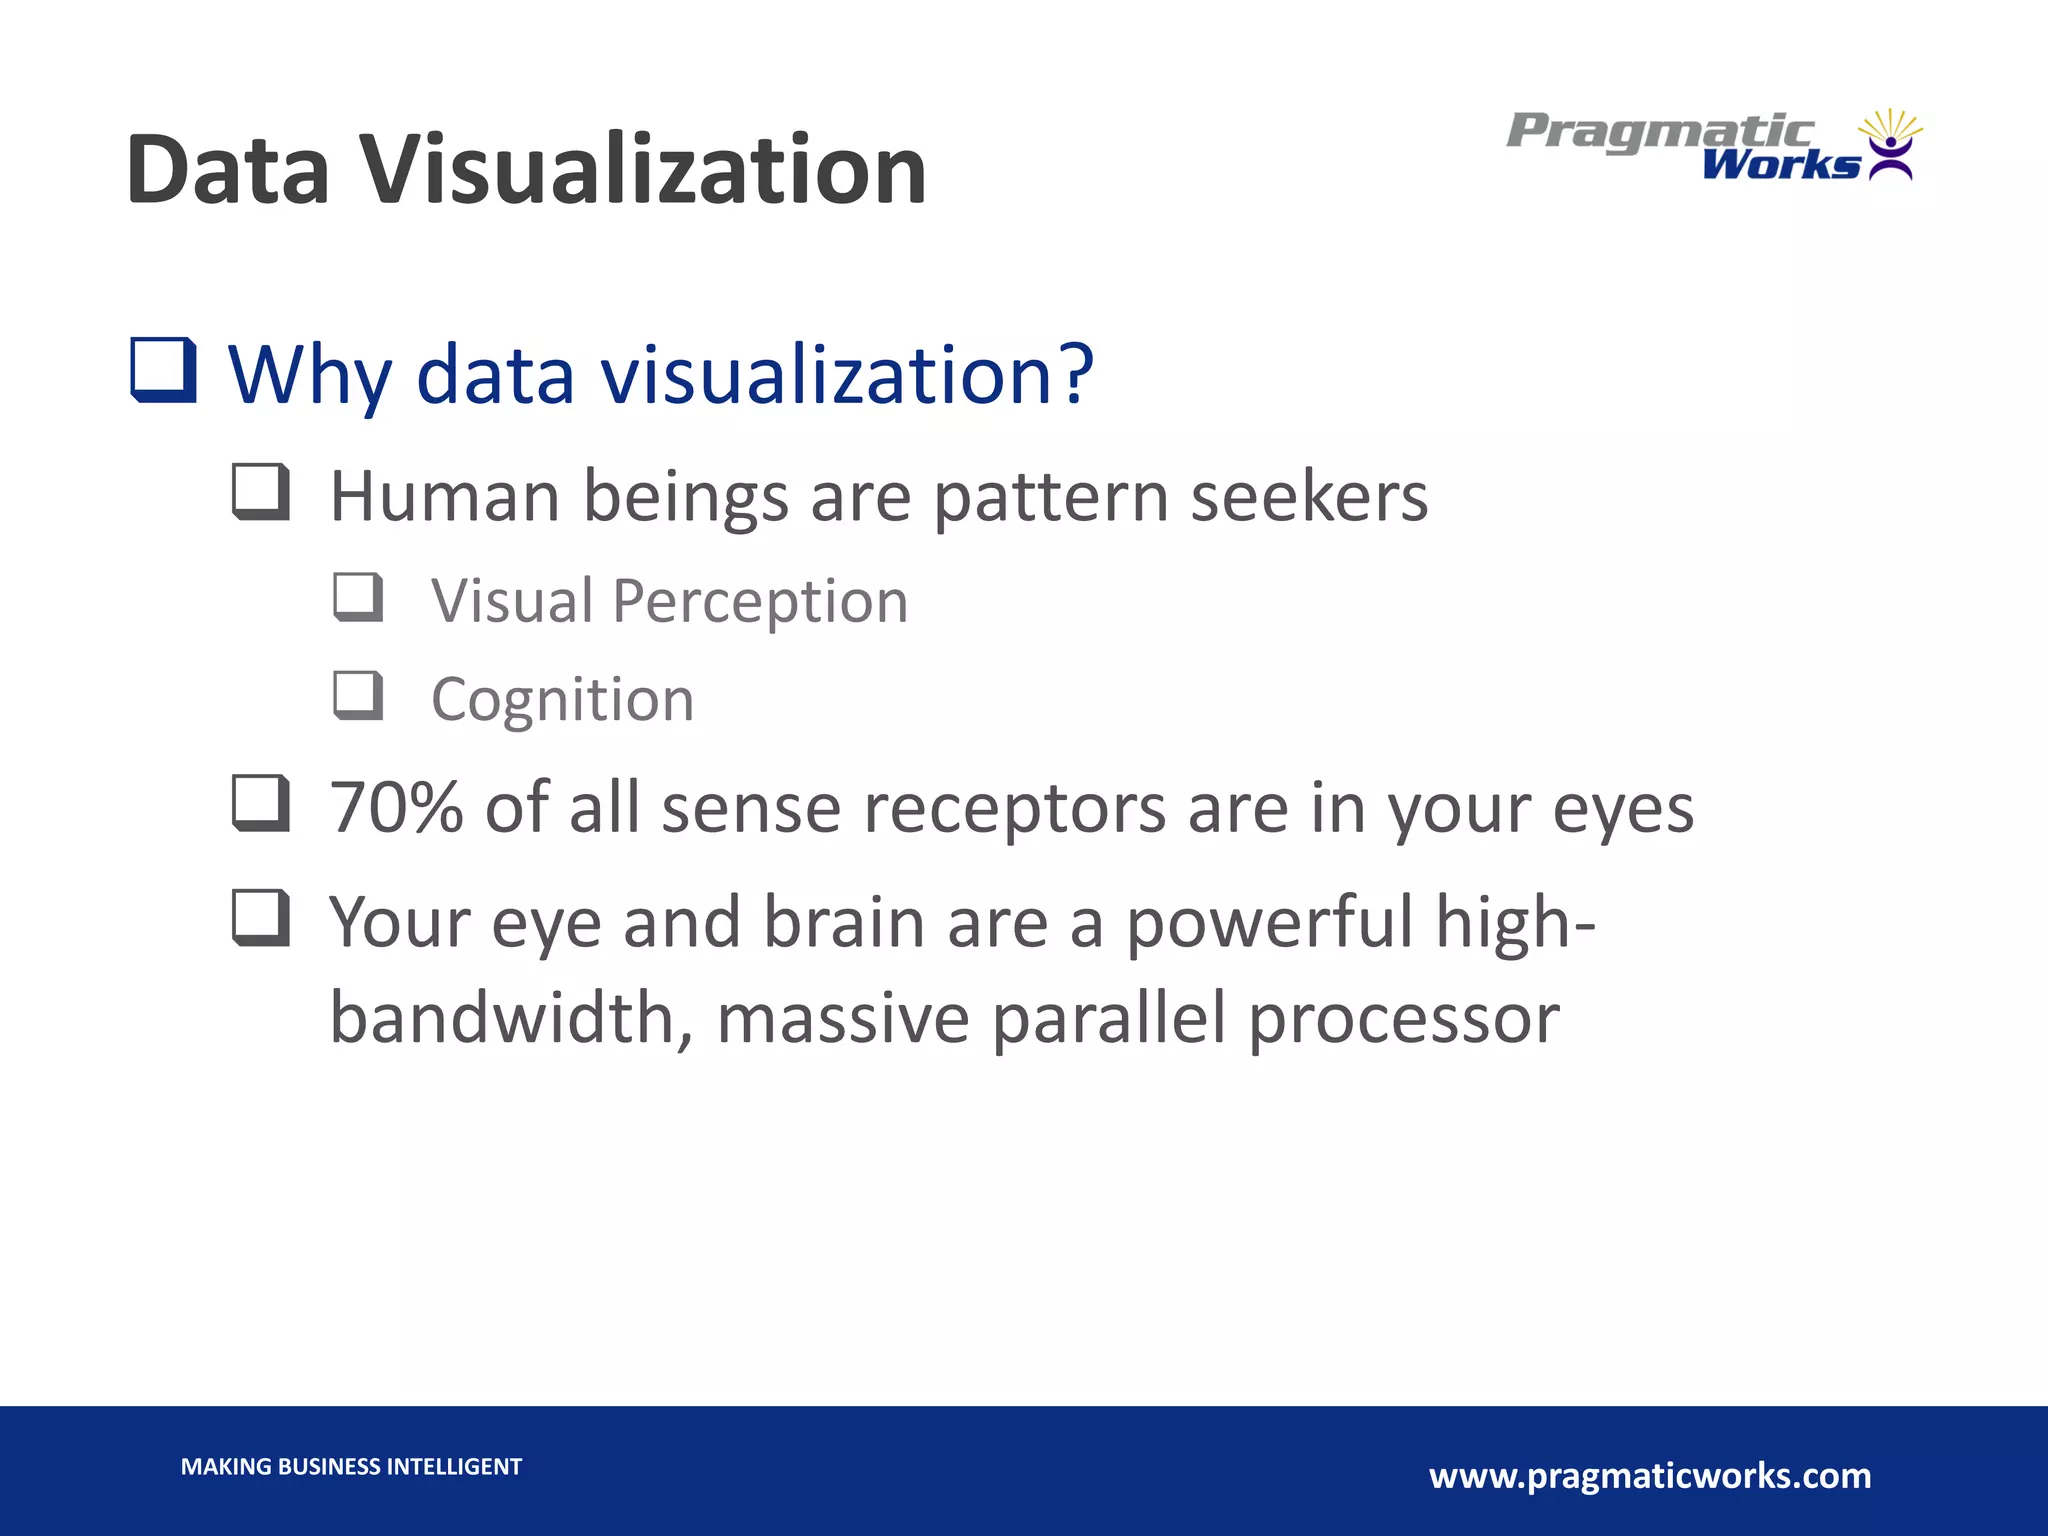

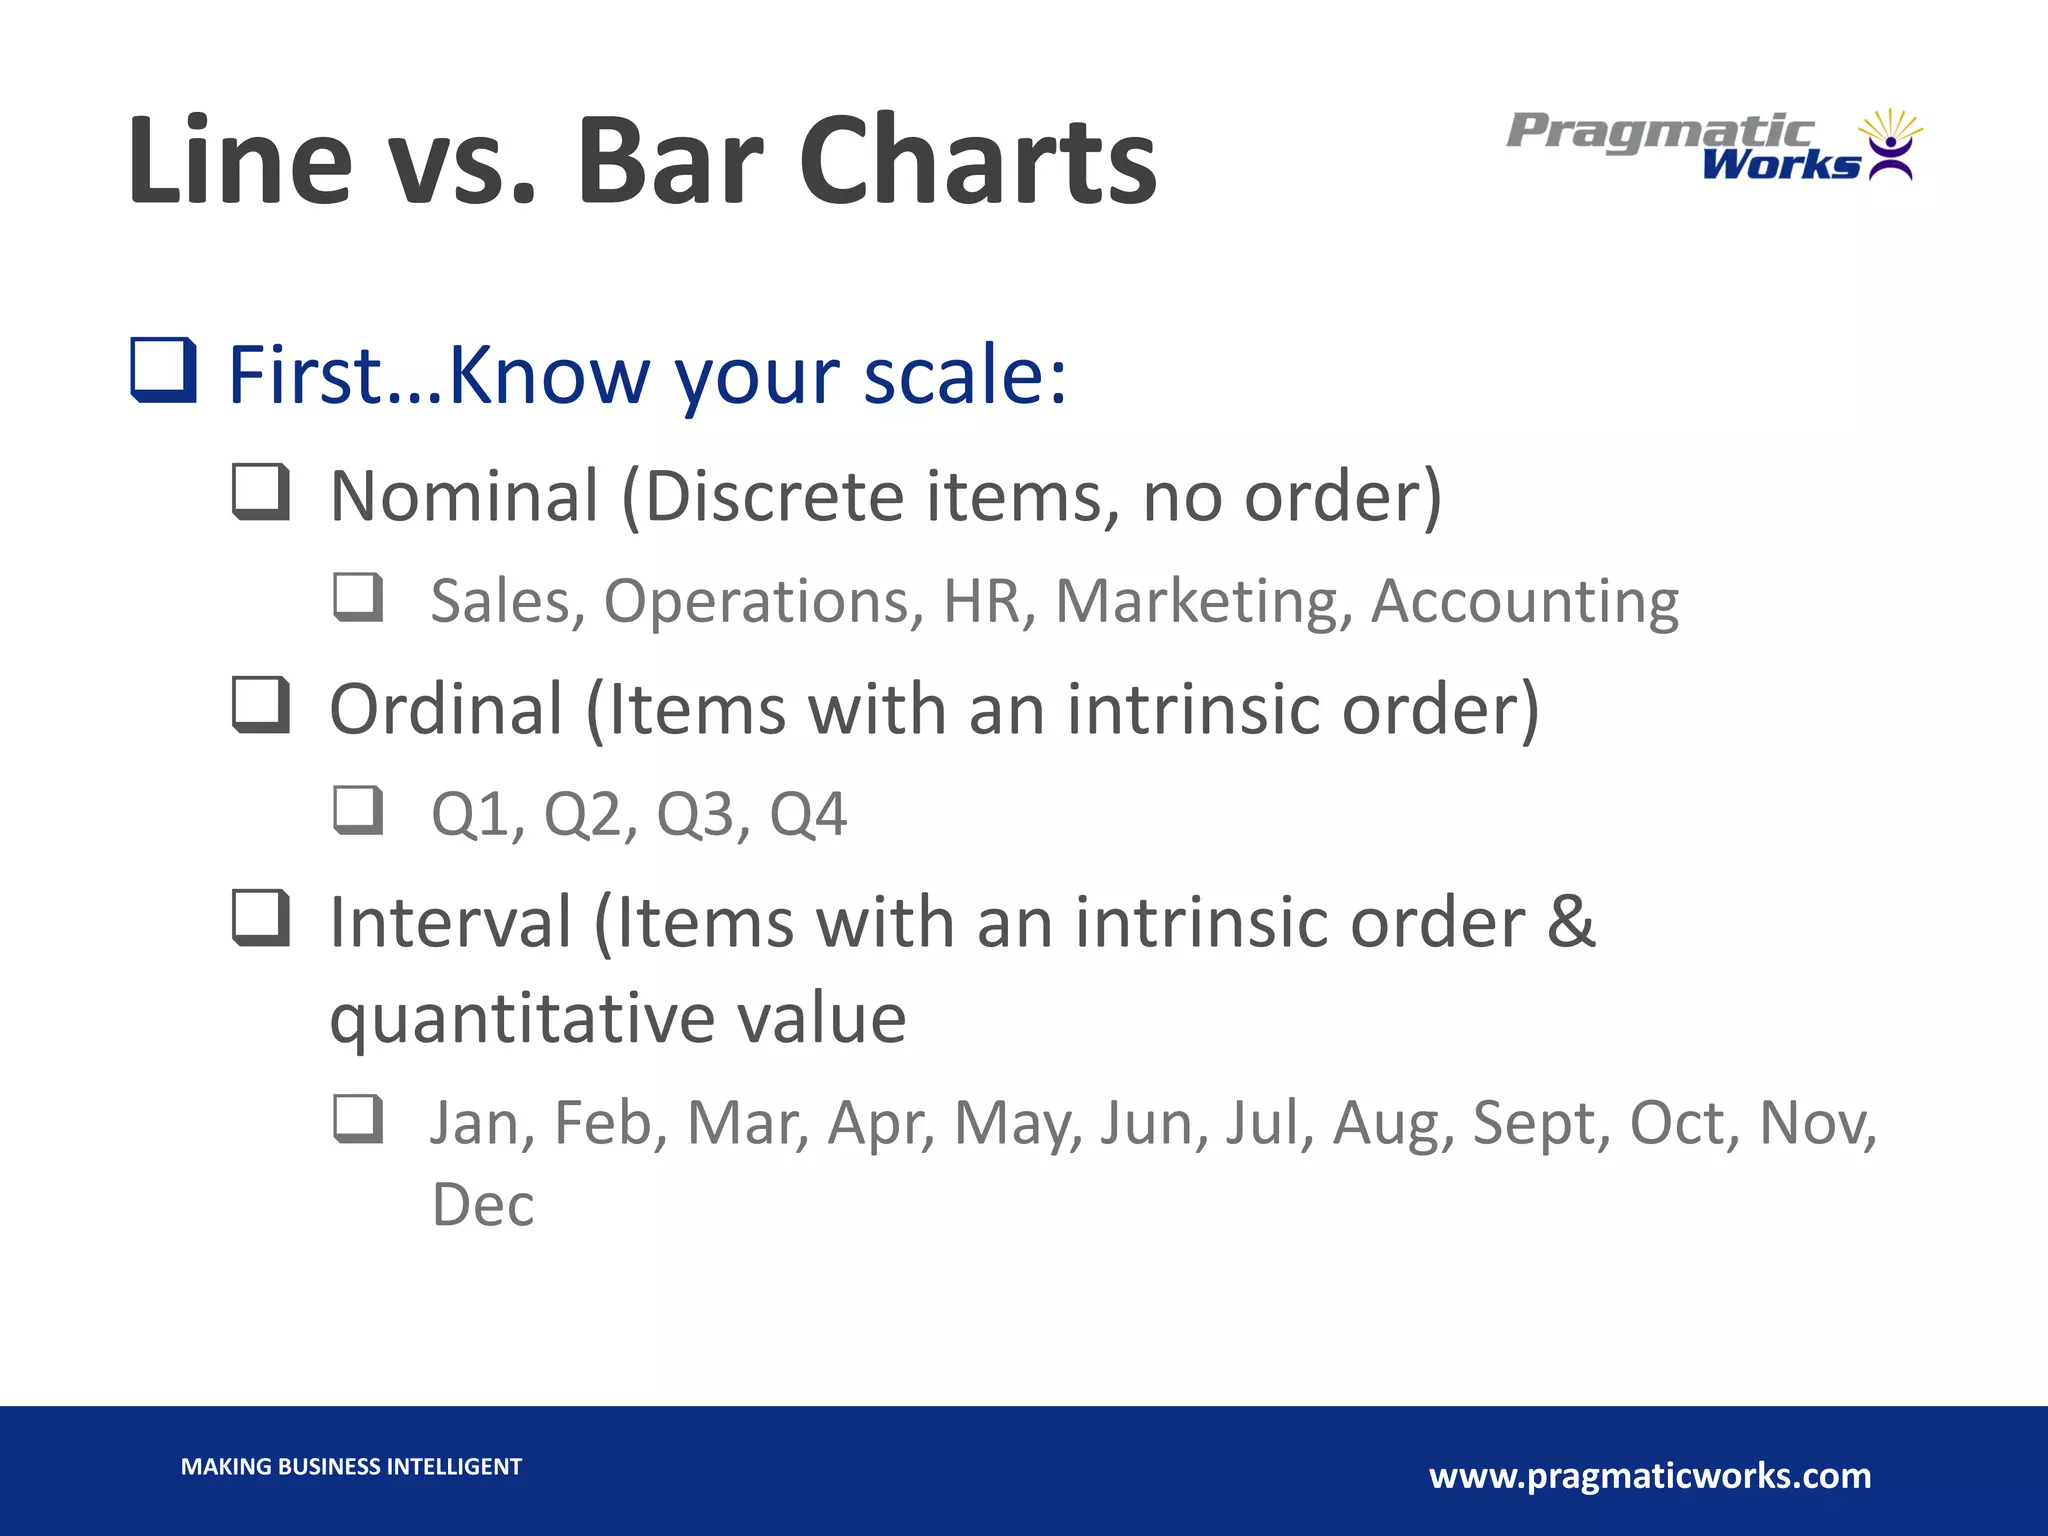
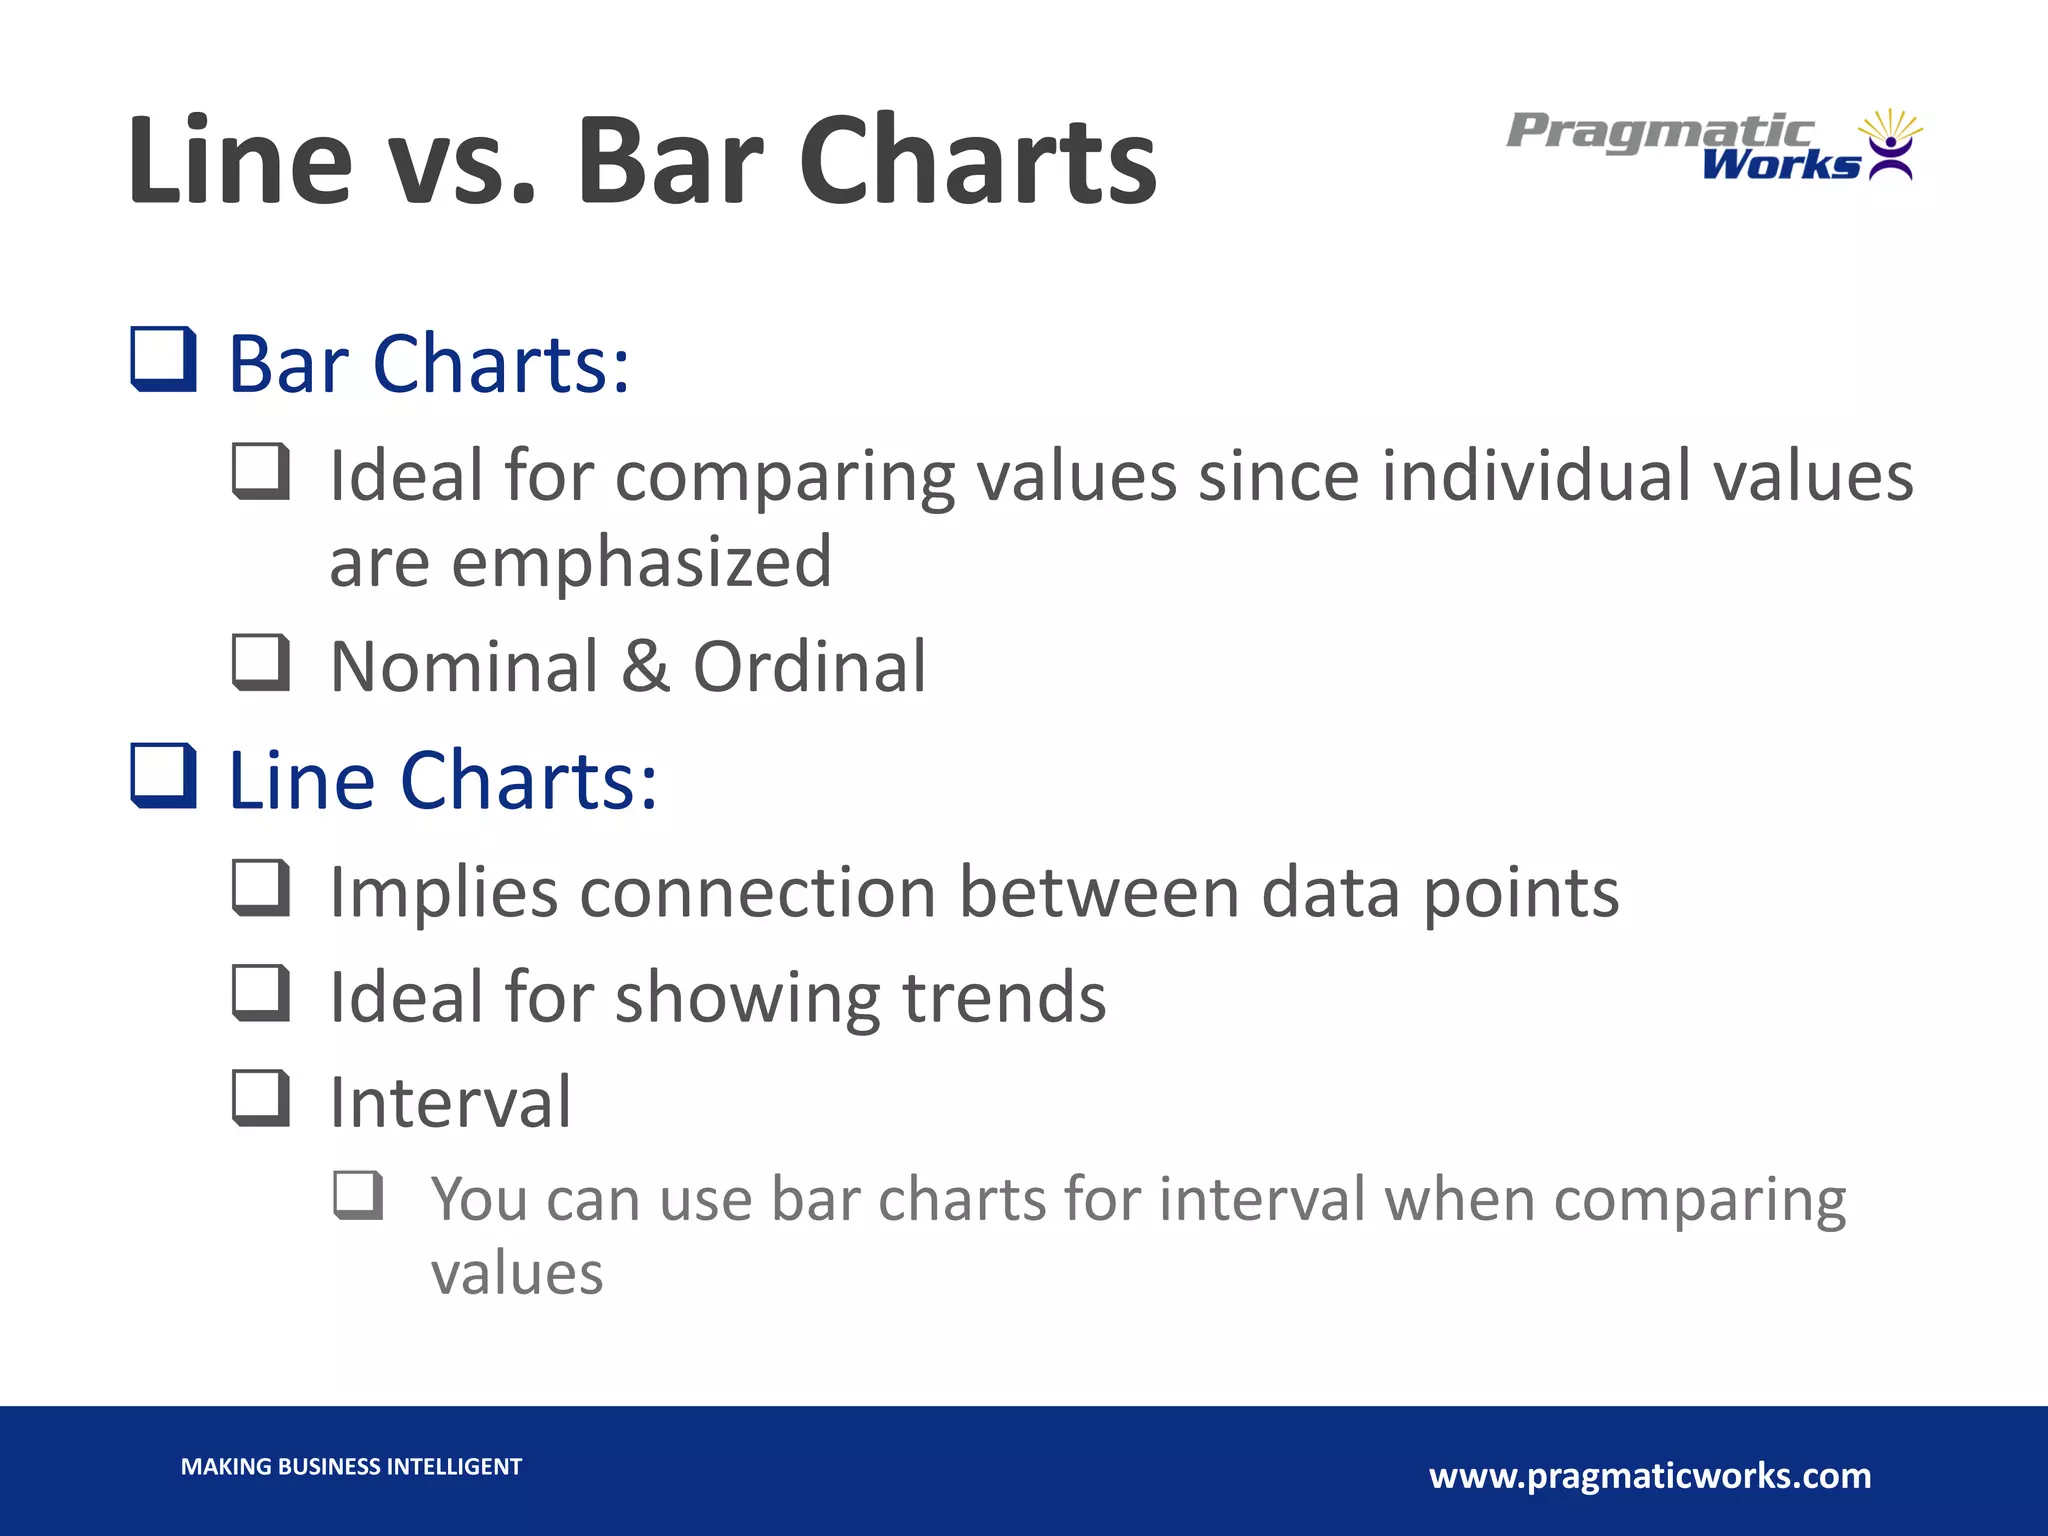
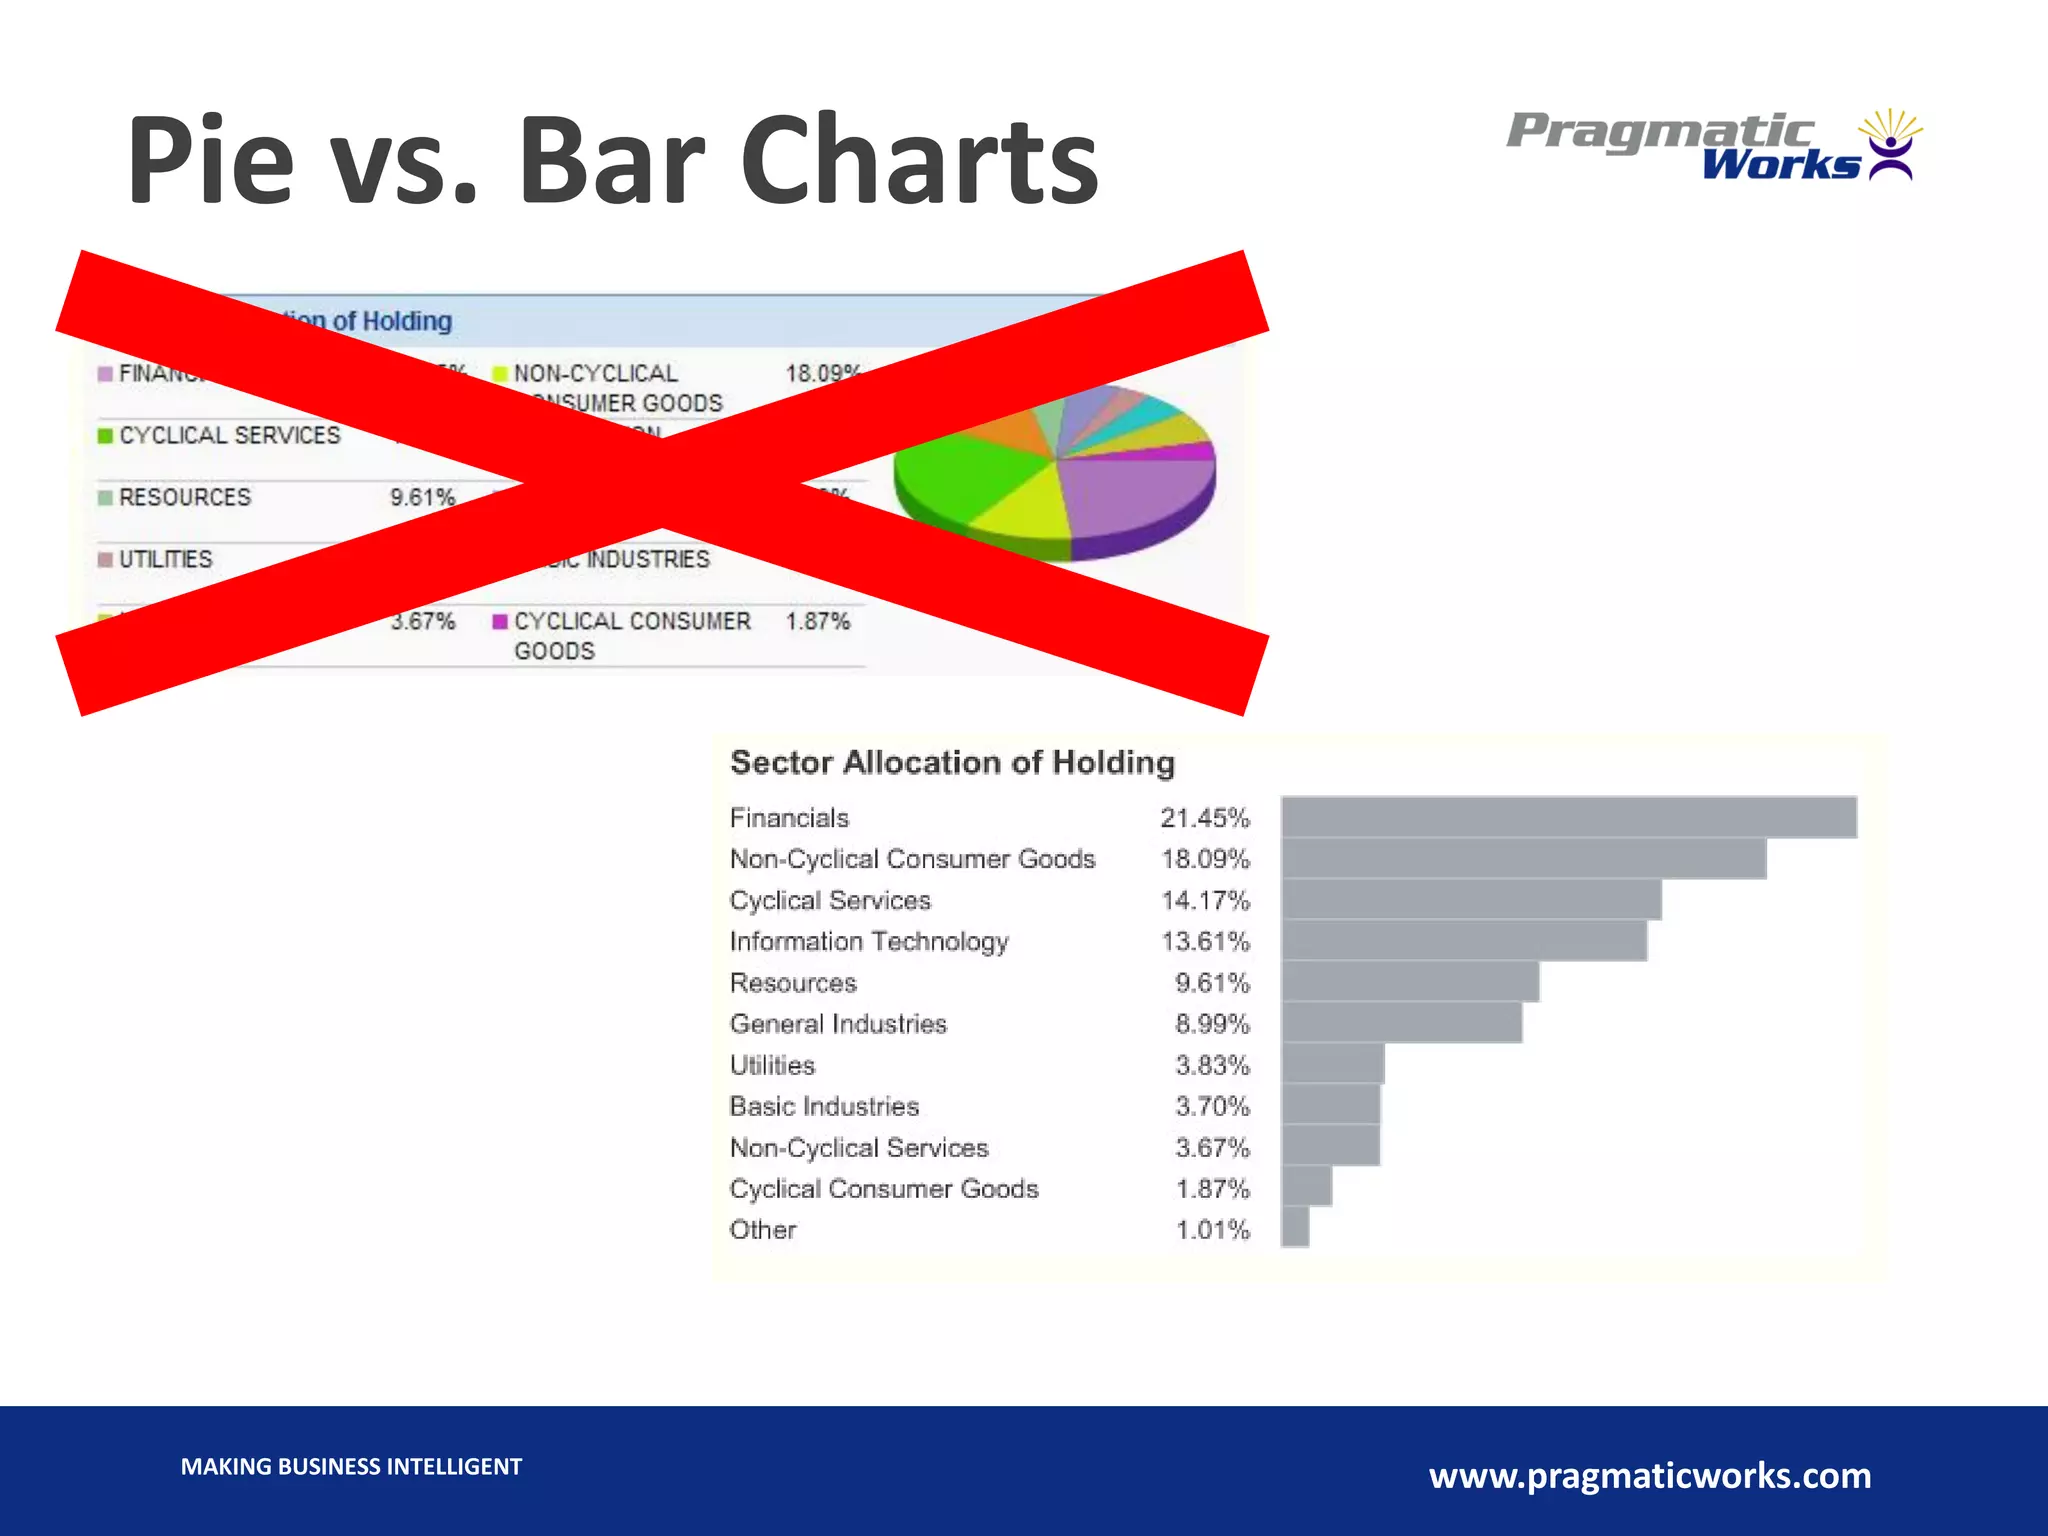


This document discusses data visualization techniques using Microsoft Reporting Services. It begins with an introduction to data visualization as both an art and science. The document then covers principles of visual design, different types of charts like line charts and bar charts, and how to encode data visually. It provides examples of effective and ineffective data visualization. Finally, it demonstrates capabilities of Reporting Services for creating visualizations and data charts.