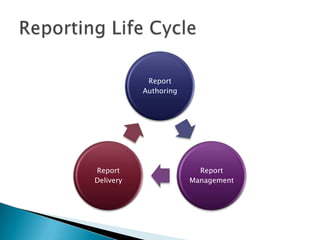
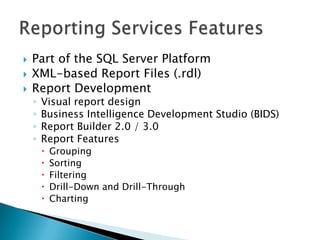
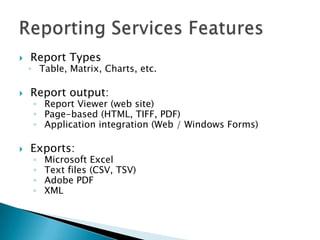
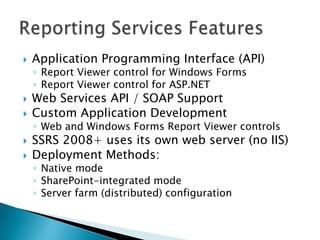
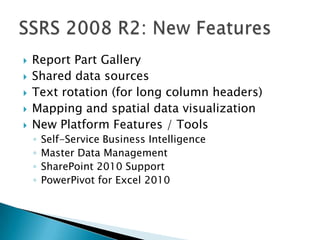
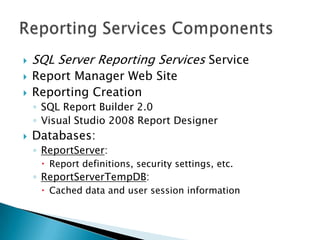
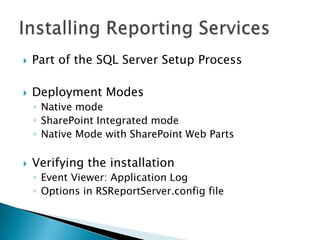
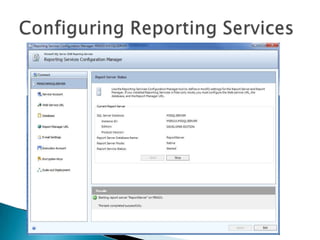
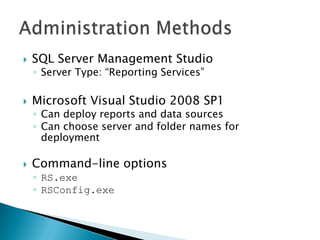
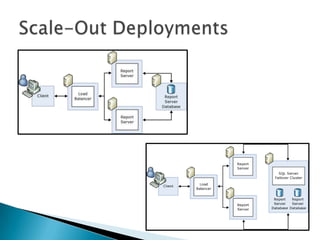
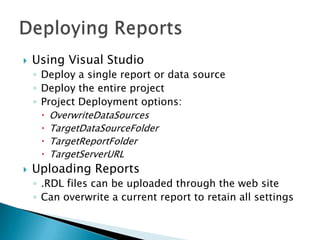
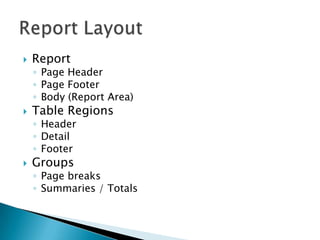
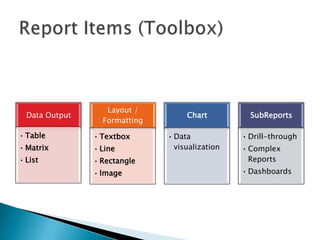
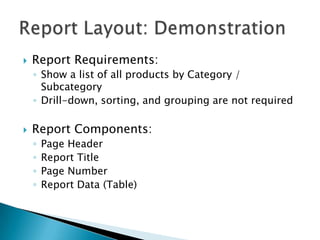
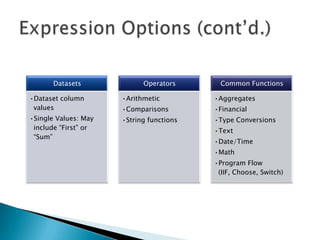
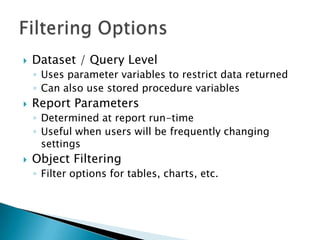
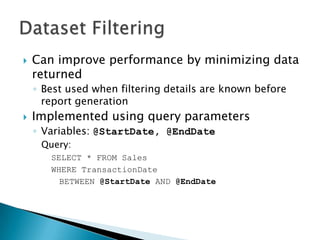
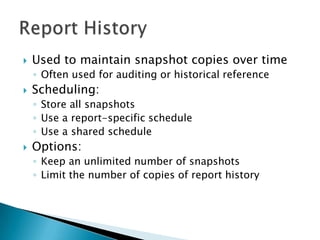
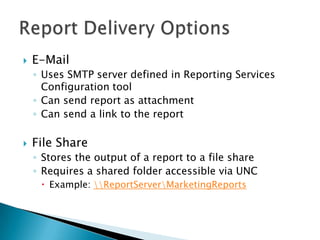
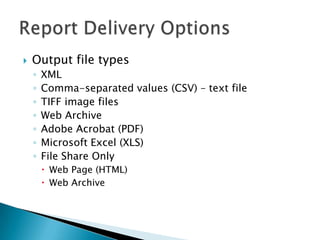
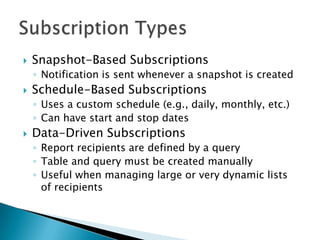
Anil Desai
http://AnilDesai.net
   Anil Desai
    ◦ Independent Consultant (Austin, TX)
    ◦ Author of several SQL Server books
      Certification
      Training
    ◦ Instructor, “Implementing and Managing SQL Server
      2005” (Keystone Learning)
    ◦ Info: http://AnilDesai.net or Anil@AnilDesai.net
Features and components of
Reporting Services
Report
           Authoring


Report                   Report
Delivery               Management
   Part of the SQL Server Platform
   XML-based Report Files (.rdl)
   Report Development
    ◦   Visual report design
    ◦   Business Intelligence Development Studio (BIDS)
    ◦   Report Builder 2.0 / 3.0
    ◦   Report Features
           Grouping
           Sorting
           Filtering
           Drill-Down and Drill-Through
           Charting
   Report Types
    ◦ Table, Matrix, Charts, etc.

   Report output:
     ◦ Report Viewer (web site)
     ◦ Page-based (HTML, TIFF, PDF)
     ◦ Application integration (Web / Windows Forms)

   Exports:
     ◦   Microsoft Excel
     ◦   Text files (CSV, TSV)
     ◦   Adobe PDF
     ◦   XML
   Application Programming Interface (API)
    ◦ Report Viewer control for Windows Forms
    ◦ Report Viewer control for ASP.NET
   Web Services API / SOAP Support
   Custom Application Development
    ◦ Web and Windows Forms Report Viewer controls
   SSRS 2008+ uses its own web server (no IIS)
   Deployment Methods:
    ◦ Native mode
    ◦ SharePoint-integrated mode
    ◦ Server farm (distributed) configuration
   Report Part Gallery
   Shared data sources
   Text rotation (for long column headers)
   Mapping and spatial data visualization
   New Platform Features / Tools
    ◦   Self-Service Business Intelligence
    ◦   Master Data Management
    ◦   SharePoint 2010 Support
    ◦   PowerPivot for Excel 2010
   SQL Server Reporting Services Service
   Report Manager Web Site
   Reporting Creation
    ◦ SQL Report Builder 2.0
    ◦ Visual Studio 2008 Report Designer
   Databases:
    ◦ ReportServer:
      Report definitions, security settings, etc.
    ◦ ReportServerTempDB:
      Cached data and user session information
   Part of the SQL Server Setup Process

   Deployment Modes
    ◦ Native mode
    ◦ SharePoint Integrated mode
    ◦ Native Mode with SharePoint Web Parts

   Verifying the installation
    ◦ Event Viewer: Application Log
    ◦ Options in RSReportServer.config file
   SQL Server Management Studio
    ◦ Server Type: “Reporting Services”

   Microsoft Visual Studio 2008 SP1
    ◦ Can deploy reports and data sources
    ◦ Can choose server and folder names for
      deployment

   Command-line options
    ◦ RS.exe
    ◦ RSConfig.exe
Working with report items and
defining data access methods
   Primary administration method
    ◦   Configure site settings
    ◦   Manage reports and data sources
    ◦   Security configuration
    ◦   View reports

   Connecting to the Report Manager Web Site
    ◦ Requires a DHTML-compatible browser
    ◦ Default: http://ComputerName/reports
   Report Definition Language (.rdl)
    ◦ XML-based report files
    ◦ Contains report layout and other details
      Data sources
      Queries / stored procedure calls
      Parameters


   Reports can be deployed or uploaded
    ◦ Can be organized in folders
   Using Visual Studio
    ◦ Deploy a single report or data source
    ◦ Deploy the entire project
    ◦ Project Deployment options:
       OverwriteDataSources
       TargetDataSourceFolder
       TargetReportFolder
       TargetServerURL
   Uploading Reports
    ◦ .RDL files can be uploaded through the web site
    ◦ Can overwrite a current report to retain all settings
Review of modules and
resources for more
information
   Report Wizard Goals:
    ◦   Provides a quick way to create basic reports
    ◦   Defines a data connection and query
    ◦   Includes formatting and grouping options
    ◦   Creates a new RDL file


   Launching the Report Wizard:
    ◦ New Project  Report Server Project Wizard
    ◦ Add Item  Report Wizard
Access data sources using
Reporting Services
   Specifies connection information for
    reporting data
   Supported Data Sources:
    ◦ Any OLEDB / ODBC-compliant data source
    ◦ Relational
      SQL Server
      Oracle
      MS Access
    ◦ OLAP / Multi-Dimensional
      SQL Server Analysis Services
    ◦ XML, Excel, CSV, TSV, etc.
   Data Source Details
    ◦ Data source type
    ◦ Connection options
    ◦ Security credentials
   Private Data Sources (Report-specific)
    ◦ Stored within the report (.RDL) file
   Shared Data Sources
    ◦ Defined at the Project / Server level
    ◦ Can be used across multiple reports
    ◦ Useful for development/production environments
Specifying information to be
included in a report
   Identifies data to be used for report
    generation
    ◦ Can have many different datasets per report
    ◦ Requires a data source (shared or embedded)
    ◦ Fields are available for use in reports
   Dataset Options
    ◦   Query (Text or Stored Procedure)
    ◦   Fields
    ◦   Data Options
    ◦   Parameters
    ◦   Filters
   Query Designer Features
    ◦   Visual creation of joins
    ◦   Can access tables, views, and functions
    ◦   Column names and aliases
    ◦   Query sorting and filtering options
    ◦   Query results
   Screen sections
    ◦   Diagram Pane
    ◦   Grid Pane
    ◦   SQL Pane
    ◦   Result Pane
   Report Requirements:
    ◦ AdventureWorks Products by Category Report
    ◦ Retrieve information about Categories,
      Subcategories, and Products
      Tables:
        Production.ProductCategory
        Production.ProductSubcategory
        Production.Product
Creating and laying out new
reports
   Report
    ◦ Page Header
    ◦ Page Footer
    ◦ Body (Report Area)
   Table Regions
    ◦ Header
    ◦ Detail
    ◦ Footer
   Groups
    ◦ Page breaks
    ◦ Summaries / Totals
Layout /
  Data Output                       Chart          SubReports
                  Formatting
• Table         • Textbox      • Data            • Drill-through
• Matrix        • Line           visualization   • Complex
• List          • Rectangle                        Reports
                • Image                          • Dashboards
   Report Requirements:
    ◦ Show a list of all products by Category /
      Subcategory
    ◦ Drill-down, sorting, and grouping are not required

   Report Components:
    ◦   Page Header
    ◦   Report Title
    ◦   Page Number
    ◦   Report Data (Table)
Publishing reports to the
Reporting Services web site
   Project Properties:
    ◦   OverwriteDataSources
    ◦   TargetDataSourceFolder
    ◦   TargetReportFolder
    ◦   TargetServerURL


   Deployment Options
    ◦ Entire Project
    ◦ Single report / data source item
   Interacting with Reports

   Exporting Data
Sorting, Grouping, and Drill-
Down
   Query Sorting
    ◦ Useful for setting a “default” sort order
    ◦ Use an ORDER BY clause in the dataset query
   Table-Level Sorting
    ◦ Default sort order specified in the “Sorting” tab
   Interactive Sorting
    ◦   Data is sorted during report generation
    ◦   Sorted values are used for report output
    ◦   Can use a field or complex sort expression
    ◦   May be dependent on grouping scope
   Grouping
    ◦ Helps to logically organize data
    ◦ Can create sub-totals in group footer

   Drill-Down
    ◦ Group visibility can be dynamically-controlled by
      other columns/values
    ◦ Report exports are based on the current view
North
  Region                           America


Sub-Region           U.S.          Canada    Mexico


             Sales            Sales          Sales
  Details    (YTD)          (Monthly)        (YTD)
   Statements used to specify values
   Can be used in table cells
   Expression Editor
    ◦ Supports Intellisense
    ◦ Uses Visual Basic-style syntax
   Examples:
    ◦   Globals!ReportName
    ◦   Globals!PageNumber
    ◦   Sum(Fields!SalesTotal.Value, “Sales")
    ◦   CountDistinct(Fields!ProductCategory)
    ◦ Fields!Employee.LastName + “,” + Fields!Employee.FirstName +
Constants      Globals       Parameters         Fields

• Based on    • Report        • From report   • From
  context       Name            settings        datasets
              • Page
                information
              • Execution
                Time
Datasets             Operators       Common Functions

•Dataset column       •Arithmetic         •Aggregates
 values               •Comparisons        •Financial
•Single Values: May   •String functions   •Type Conversions
 include “First” or                       •Text
 “Sum”
                                          •Date/Time
                                          •Math
                                          •Program Flow
                                           (IIF, Choose, Switch)
Using Parameters to filter
reporting data
   Dataset / Query Level
    ◦ Uses parameter variables to restrict data returned
    ◦ Can also use stored procedure variables
   Report Parameters
    ◦ Determined at report run-time
    ◦ Useful when users will be frequently changing
      settings
   Object Filtering
    ◦ Filter options for tables, charts, etc.
   Can improve performance by minimizing data
    returned
    ◦ Best used when filtering details are known before
      report generation
   Implemented using query parameters
    ◦ Variables: @StartDate, @EndDate
     Query:
       SELECT * FROM Sales
       WHERE TransactionDate
         BETWEEN @StartDate AND @EndDate
   Evaluated at report run-time
   Report Parameter Options:
    ◦ Data Types
    ◦ Prompt Options
      Allow blank / null; Multi-value
    ◦ Available Values
      Non-Queried or From Query
    ◦ Default values:
      Non-Queried or From Query
   Cascading Parameters
Adding data visualization
through Chart objects
   Understanding Charts
    ◦ Can be based on any dataset
    ◦ Display and options are based on chart type


   Chart Features
    ◦   X- and Y-Axis Labels
    ◦   Legends
    ◦   3-D Effects
    ◦   Filters
Column       Bar         Area


 Line     Pie Chart    Doughnut


Scatter    Bubble       Stock


Spatial   Sparklines   Mapping
 (R2)        (R2)        (R2)
   Designing Charts:
    ◦ Data Fields
    ◦ Series Fields
    ◦ Category Fields


   Chart Example: AdventureWorks Sales Data
    ◦ Requirement: Show sales by region and date in a
      variety of different ways
Accessing related data with
Subreports
   Embedded Reports
    ◦ May be related to the “parent” report

   Purposes
    ◦ Master / Detail view of data
    ◦ Flexible layout and display options
      Dashboards
      Drill-Through (using hyperlinks)
    ◦ Complex Reporting
Specifying how and when
reports are run
Data is retrieved from data source(s)


  Data is stored in ReportServerTempDB


           Report is Executed


Results are provided to user or services
   Always run this report with the most recent
    data
    ◦ Enable caching
      Expired based on number of minutes
      Expired based on a schedule
    ◦ Render report from a snapshot
   Report Execution timeouts
    ◦ System Default
    ◦ Specified number of seconds
    ◦ None
   Cache is created when a report is first run
   Stores a copy of data in ReportServerTempDB
   Can reduce impact on production
    performance
   Data may be out-of-date
   Expires after a pre-defined amount of time
   Data source security settings must be
    configured
   Query Parameters
    ◦ Each combination of parameter values results in a
      separate stored database
    ◦ Can use a large amount of disk space


   Report Parameters
    ◦ Creates a single cached instance of the report
   Events are executed by SQL Server Agent service

   Schedule Types
    ◦ Report-Specific Schedules
    ◦ Shared Schedules
      Defined at the system level

   Tips:
    ◦ Keep track of time zones
    ◦ Use shared schedules whenever possible to allow
      centralized management
    ◦ Distribute reporting processing workload over time
Creating point-in-time views
of data and storing them for
later review
   Point-in-time view of the contents of a report
    ◦ Data never changes
   Report parameters must be defined before
    running the snapshot
   Usually created on a schedule
    ◦ End-of-month or end-of-year reports
   Scheduling
    ◦ Report-specific schedule
    ◦ Shared schedule
   Used to maintain snapshot copies over time
    ◦ Often used for auditing or historical reference
   Scheduling:
    ◦ Store all snapshots
    ◦ Use a report-specific schedule
    ◦ Use a shared schedule
   Options:
    ◦ Keep an unlimited number of snapshots
    ◦ Limit the number of copies of report history
Getting data to users when
and how they want it
   E-Mail
    ◦ Uses SMTP server defined in Reporting Services
      Configuration tool
    ◦ Can send report as attachment
    ◦ Can send a link to the report

   File Share
    ◦ Stores the output of a report to a file share
    ◦ Requires a shared folder accessible via UNC
      Example: ReportServerMarketingReports
   Output file types
    ◦   XML
    ◦   Comma-separated values (CSV) – text file
    ◦   TIFF image files
    ◦   Web Archive
    ◦   Adobe Acrobat (PDF)
    ◦   Microsoft Excel (XLS)
    ◦   File Share Only
         Web Page (HTML)
         Web Archive
   Snapshot-Based Subscriptions
    ◦ Notification is sent whenever a snapshot is created
   Schedule-Based Subscriptions
    ◦ Uses a custom schedule (e.g., daily, monthly, etc.)
    ◦ Can have start and stop dates
   Data-Driven Subscriptions
    ◦ Report recipients are defined by a query
    ◦ Table and query must be created manually
    ◦ Useful when managing large or very dynamic lists
      of recipients
Configuring system-level and
report-level permissions
   Hierarchical Security Model
    ◦ Folders can be used for logical organization
    ◦ Items inherit permissions


   Security Layers
    ◦ System-Level Role Definitions
    ◦ Site-wide Security
    ◦ Item-Level Role Definitions
   Role-Based system
    ◦ Roles are sets of permissions/capabilities
    ◦ Users can be assigned to multiple roles


   Based on Windows Authentication
    ◦ Provides for centralized security management
    ◦ May use Active Directory users and groups
    ◦ Other authentication can be developed
   Roles include collections of tasks

   Pre-Defined Roles:
    ◦   Browser
    ◦   Content Manager
    ◦   My Reports
    ◦   Publisher
    ◦   Report Builder
   Available Tasks:
    ◦   Consume Reports
    ◦   Create linked reports
    ◦   Manage all subscriptions
    ◦   Manage data sources
    ◦   Manage folders
    ◦   Manage individual subscriptions
    ◦   Manage models
    ◦   Manage report history
    ◦   Manage reports
    ◦   Manage resources
    ◦   Set security for individual items
    ◦   View data sources
    ◦   View folders
    ◦   View models
    ◦   View reports
    ◦   View resources
   Creates a “virtual report”
    ◦ Uses the same report definition (.rdl) as the parent
      report, but with independent settings

   Purpose / Benefits
    ◦ Can setup different sets of permissions
    ◦ Can setup different sets of parameters
   Give users minimal permissions

   Implement “defense-in-depth”

   Regularly review permissions
    ◦ Delegate security review responsibilities
    ◦ Make security reviews a part of your overall process
    ◦ Ensure that Windows groups and users are properly
      defined
Resources for more
information
   AnilDesai.net
    ◦ Presentation slides
    ◦ SQL Server-focused articles
    ◦ Sample code from presentations

   ReportingServicesGuru.com
    ◦ Course: “Administering Reporting Services”
    ◦ Online forums and news

   Microsoft Resources:
    ◦ SQL Server Web Site: www.microsoft.com/sql
         Reporting Site:
          http://www.microsoft.com/sqlserver/2008/en/us/reporting.aspx
    ◦   Microsoft Developer Network: msdn.microsoft.com
    ◦   Microsoft TechNet: technet.microsoft.com
    ◦   SQL Server 2008 R2 Reporting Services Forums
    ◦   SQL Server Product Samples: http://msftrsprodsamples.codeplex.com/
Netvu test slideshow

Netvu test slideshow

  • 1.
  • 2.
    Anil Desai ◦ Independent Consultant (Austin, TX) ◦ Author of several SQL Server books  Certification  Training ◦ Instructor, “Implementing and Managing SQL Server 2005” (Keystone Learning) ◦ Info: http://AnilDesai.net or Anil@AnilDesai.net
  • 3.
    Features and componentsof Reporting Services
  • 4.
    Report Authoring Report Report Delivery Management
  • 5.
    Part of the SQL Server Platform  XML-based Report Files (.rdl)  Report Development ◦ Visual report design ◦ Business Intelligence Development Studio (BIDS) ◦ Report Builder 2.0 / 3.0 ◦ Report Features  Grouping  Sorting  Filtering  Drill-Down and Drill-Through  Charting
  • 6.
    Report Types ◦ Table, Matrix, Charts, etc.  Report output: ◦ Report Viewer (web site) ◦ Page-based (HTML, TIFF, PDF) ◦ Application integration (Web / Windows Forms)  Exports: ◦ Microsoft Excel ◦ Text files (CSV, TSV) ◦ Adobe PDF ◦ XML
  • 7.
    Application Programming Interface (API) ◦ Report Viewer control for Windows Forms ◦ Report Viewer control for ASP.NET  Web Services API / SOAP Support  Custom Application Development ◦ Web and Windows Forms Report Viewer controls  SSRS 2008+ uses its own web server (no IIS)  Deployment Methods: ◦ Native mode ◦ SharePoint-integrated mode ◦ Server farm (distributed) configuration
  • 8.
    Report Part Gallery  Shared data sources  Text rotation (for long column headers)  Mapping and spatial data visualization  New Platform Features / Tools ◦ Self-Service Business Intelligence ◦ Master Data Management ◦ SharePoint 2010 Support ◦ PowerPivot for Excel 2010
  • 9.
    SQL Server Reporting Services Service  Report Manager Web Site  Reporting Creation ◦ SQL Report Builder 2.0 ◦ Visual Studio 2008 Report Designer  Databases: ◦ ReportServer:  Report definitions, security settings, etc. ◦ ReportServerTempDB:  Cached data and user session information
  • 10.
    Part of the SQL Server Setup Process  Deployment Modes ◦ Native mode ◦ SharePoint Integrated mode ◦ Native Mode with SharePoint Web Parts  Verifying the installation ◦ Event Viewer: Application Log ◦ Options in RSReportServer.config file
  • 12.
    SQL Server Management Studio ◦ Server Type: “Reporting Services”  Microsoft Visual Studio 2008 SP1 ◦ Can deploy reports and data sources ◦ Can choose server and folder names for deployment  Command-line options ◦ RS.exe ◦ RSConfig.exe
  • 14.
    Working with reportitems and defining data access methods
  • 15.
    Primary administration method ◦ Configure site settings ◦ Manage reports and data sources ◦ Security configuration ◦ View reports  Connecting to the Report Manager Web Site ◦ Requires a DHTML-compatible browser ◦ Default: http://ComputerName/reports
  • 16.
    Report Definition Language (.rdl) ◦ XML-based report files ◦ Contains report layout and other details  Data sources  Queries / stored procedure calls  Parameters  Reports can be deployed or uploaded ◦ Can be organized in folders
  • 17.
    Using Visual Studio ◦ Deploy a single report or data source ◦ Deploy the entire project ◦ Project Deployment options:  OverwriteDataSources  TargetDataSourceFolder  TargetReportFolder  TargetServerURL  Uploading Reports ◦ .RDL files can be uploaded through the web site ◦ Can overwrite a current report to retain all settings
  • 18.
    Review of modulesand resources for more information
  • 19.
    Report Wizard Goals: ◦ Provides a quick way to create basic reports ◦ Defines a data connection and query ◦ Includes formatting and grouping options ◦ Creates a new RDL file  Launching the Report Wizard: ◦ New Project  Report Server Project Wizard ◦ Add Item  Report Wizard
  • 21.
    Access data sourcesusing Reporting Services
  • 22.
    Specifies connection information for reporting data  Supported Data Sources: ◦ Any OLEDB / ODBC-compliant data source ◦ Relational  SQL Server  Oracle  MS Access ◦ OLAP / Multi-Dimensional  SQL Server Analysis Services ◦ XML, Excel, CSV, TSV, etc.
  • 23.
    Data Source Details ◦ Data source type ◦ Connection options ◦ Security credentials  Private Data Sources (Report-specific) ◦ Stored within the report (.RDL) file  Shared Data Sources ◦ Defined at the Project / Server level ◦ Can be used across multiple reports ◦ Useful for development/production environments
  • 24.
    Specifying information tobe included in a report
  • 25.
    Identifies data to be used for report generation ◦ Can have many different datasets per report ◦ Requires a data source (shared or embedded) ◦ Fields are available for use in reports  Dataset Options ◦ Query (Text or Stored Procedure) ◦ Fields ◦ Data Options ◦ Parameters ◦ Filters
  • 26.
    Query Designer Features ◦ Visual creation of joins ◦ Can access tables, views, and functions ◦ Column names and aliases ◦ Query sorting and filtering options ◦ Query results  Screen sections ◦ Diagram Pane ◦ Grid Pane ◦ SQL Pane ◦ Result Pane
  • 28.
    Report Requirements: ◦ AdventureWorks Products by Category Report ◦ Retrieve information about Categories, Subcategories, and Products  Tables:  Production.ProductCategory  Production.ProductSubcategory  Production.Product
  • 29.
    Creating and layingout new reports
  • 30.
    Report ◦ Page Header ◦ Page Footer ◦ Body (Report Area)  Table Regions ◦ Header ◦ Detail ◦ Footer  Groups ◦ Page breaks ◦ Summaries / Totals
  • 31.
    Layout / Data Output Chart SubReports Formatting • Table • Textbox • Data • Drill-through • Matrix • Line visualization • Complex • List • Rectangle Reports • Image • Dashboards
  • 32.
    Report Requirements: ◦ Show a list of all products by Category / Subcategory ◦ Drill-down, sorting, and grouping are not required  Report Components: ◦ Page Header ◦ Report Title ◦ Page Number ◦ Report Data (Table)
  • 33.
    Publishing reports tothe Reporting Services web site
  • 34.
    Project Properties: ◦ OverwriteDataSources ◦ TargetDataSourceFolder ◦ TargetReportFolder ◦ TargetServerURL  Deployment Options ◦ Entire Project ◦ Single report / data source item
  • 35.
    Interacting with Reports  Exporting Data
  • 36.
  • 37.
    Query Sorting ◦ Useful for setting a “default” sort order ◦ Use an ORDER BY clause in the dataset query  Table-Level Sorting ◦ Default sort order specified in the “Sorting” tab  Interactive Sorting ◦ Data is sorted during report generation ◦ Sorted values are used for report output ◦ Can use a field or complex sort expression ◦ May be dependent on grouping scope
  • 38.
    Grouping ◦ Helps to logically organize data ◦ Can create sub-totals in group footer  Drill-Down ◦ Group visibility can be dynamically-controlled by other columns/values ◦ Report exports are based on the current view
  • 39.
    North Region America Sub-Region U.S. Canada Mexico Sales Sales Sales Details (YTD) (Monthly) (YTD)
  • 40.
    Statements used to specify values  Can be used in table cells  Expression Editor ◦ Supports Intellisense ◦ Uses Visual Basic-style syntax  Examples: ◦ Globals!ReportName ◦ Globals!PageNumber ◦ Sum(Fields!SalesTotal.Value, “Sales") ◦ CountDistinct(Fields!ProductCategory) ◦ Fields!Employee.LastName + “,” + Fields!Employee.FirstName +
  • 41.
    Constants Globals Parameters Fields • Based on • Report • From report • From context Name settings datasets • Page information • Execution Time
  • 42.
    Datasets Operators Common Functions •Dataset column •Arithmetic •Aggregates values •Comparisons •Financial •Single Values: May •String functions •Type Conversions include “First” or •Text “Sum” •Date/Time •Math •Program Flow (IIF, Choose, Switch)
  • 43.
    Using Parameters tofilter reporting data
  • 44.
    Dataset / Query Level ◦ Uses parameter variables to restrict data returned ◦ Can also use stored procedure variables  Report Parameters ◦ Determined at report run-time ◦ Useful when users will be frequently changing settings  Object Filtering ◦ Filter options for tables, charts, etc.
  • 45.
    Can improve performance by minimizing data returned ◦ Best used when filtering details are known before report generation  Implemented using query parameters ◦ Variables: @StartDate, @EndDate Query: SELECT * FROM Sales WHERE TransactionDate BETWEEN @StartDate AND @EndDate
  • 46.
    Evaluated at report run-time  Report Parameter Options: ◦ Data Types ◦ Prompt Options  Allow blank / null; Multi-value ◦ Available Values  Non-Queried or From Query ◦ Default values:  Non-Queried or From Query  Cascading Parameters
  • 47.
  • 48.
    Understanding Charts ◦ Can be based on any dataset ◦ Display and options are based on chart type  Chart Features ◦ X- and Y-Axis Labels ◦ Legends ◦ 3-D Effects ◦ Filters
  • 49.
    Column Bar Area Line Pie Chart Doughnut Scatter Bubble Stock Spatial Sparklines Mapping (R2) (R2) (R2)
  • 50.
    Designing Charts: ◦ Data Fields ◦ Series Fields ◦ Category Fields  Chart Example: AdventureWorks Sales Data ◦ Requirement: Show sales by region and date in a variety of different ways
  • 51.
    Accessing related datawith Subreports
  • 52.
    Embedded Reports ◦ May be related to the “parent” report  Purposes ◦ Master / Detail view of data ◦ Flexible layout and display options  Dashboards  Drill-Through (using hyperlinks) ◦ Complex Reporting
  • 54.
    Specifying how andwhen reports are run
  • 55.
    Data is retrievedfrom data source(s) Data is stored in ReportServerTempDB Report is Executed Results are provided to user or services
  • 56.
    Always run this report with the most recent data ◦ Enable caching  Expired based on number of minutes  Expired based on a schedule ◦ Render report from a snapshot  Report Execution timeouts ◦ System Default ◦ Specified number of seconds ◦ None
  • 57.
    Cache is created when a report is first run  Stores a copy of data in ReportServerTempDB  Can reduce impact on production performance  Data may be out-of-date  Expires after a pre-defined amount of time  Data source security settings must be configured
  • 58.
    Query Parameters ◦ Each combination of parameter values results in a separate stored database ◦ Can use a large amount of disk space  Report Parameters ◦ Creates a single cached instance of the report
  • 59.
    Events are executed by SQL Server Agent service  Schedule Types ◦ Report-Specific Schedules ◦ Shared Schedules  Defined at the system level  Tips: ◦ Keep track of time zones ◦ Use shared schedules whenever possible to allow centralized management ◦ Distribute reporting processing workload over time
  • 60.
    Creating point-in-time views ofdata and storing them for later review
  • 61.
    Point-in-time view of the contents of a report ◦ Data never changes  Report parameters must be defined before running the snapshot  Usually created on a schedule ◦ End-of-month or end-of-year reports  Scheduling ◦ Report-specific schedule ◦ Shared schedule
  • 62.
    Used to maintain snapshot copies over time ◦ Often used for auditing or historical reference  Scheduling: ◦ Store all snapshots ◦ Use a report-specific schedule ◦ Use a shared schedule  Options: ◦ Keep an unlimited number of snapshots ◦ Limit the number of copies of report history
  • 63.
    Getting data tousers when and how they want it
  • 64.
    E-Mail ◦ Uses SMTP server defined in Reporting Services Configuration tool ◦ Can send report as attachment ◦ Can send a link to the report  File Share ◦ Stores the output of a report to a file share ◦ Requires a shared folder accessible via UNC  Example: ReportServerMarketingReports
  • 65.
    Output file types ◦ XML ◦ Comma-separated values (CSV) – text file ◦ TIFF image files ◦ Web Archive ◦ Adobe Acrobat (PDF) ◦ Microsoft Excel (XLS) ◦ File Share Only  Web Page (HTML)  Web Archive
  • 66.
    Snapshot-Based Subscriptions ◦ Notification is sent whenever a snapshot is created  Schedule-Based Subscriptions ◦ Uses a custom schedule (e.g., daily, monthly, etc.) ◦ Can have start and stop dates  Data-Driven Subscriptions ◦ Report recipients are defined by a query ◦ Table and query must be created manually ◦ Useful when managing large or very dynamic lists of recipients
  • 67.
  • 68.
    Hierarchical Security Model ◦ Folders can be used for logical organization ◦ Items inherit permissions  Security Layers ◦ System-Level Role Definitions ◦ Site-wide Security ◦ Item-Level Role Definitions
  • 69.
    Role-Based system ◦ Roles are sets of permissions/capabilities ◦ Users can be assigned to multiple roles  Based on Windows Authentication ◦ Provides for centralized security management ◦ May use Active Directory users and groups ◦ Other authentication can be developed
  • 70.
    Roles include collections of tasks  Pre-Defined Roles: ◦ Browser ◦ Content Manager ◦ My Reports ◦ Publisher ◦ Report Builder
  • 71.
    Available Tasks: ◦ Consume Reports ◦ Create linked reports ◦ Manage all subscriptions ◦ Manage data sources ◦ Manage folders ◦ Manage individual subscriptions ◦ Manage models ◦ Manage report history ◦ Manage reports ◦ Manage resources ◦ Set security for individual items ◦ View data sources ◦ View folders ◦ View models ◦ View reports ◦ View resources
  • 72.
    Creates a “virtual report” ◦ Uses the same report definition (.rdl) as the parent report, but with independent settings  Purpose / Benefits ◦ Can setup different sets of permissions ◦ Can setup different sets of parameters
  • 73.
    Give users minimal permissions  Implement “defense-in-depth”  Regularly review permissions ◦ Delegate security review responsibilities ◦ Make security reviews a part of your overall process ◦ Ensure that Windows groups and users are properly defined
  • 74.
  • 75.
    AnilDesai.net ◦ Presentation slides ◦ SQL Server-focused articles ◦ Sample code from presentations  ReportingServicesGuru.com ◦ Course: “Administering Reporting Services” ◦ Online forums and news  Microsoft Resources: ◦ SQL Server Web Site: www.microsoft.com/sql  Reporting Site: http://www.microsoft.com/sqlserver/2008/en/us/reporting.aspx ◦ Microsoft Developer Network: msdn.microsoft.com ◦ Microsoft TechNet: technet.microsoft.com ◦ SQL Server 2008 R2 Reporting Services Forums ◦ SQL Server Product Samples: http://msftrsprodsamples.codeplex.com/