Introduction
SSRS is anextensive tool that provides a wide
array of posting and security features that
controls the access of reports. SSRS aids the
ability to create reports in proper format with
appropriate interactive elements and a
functional dashboard.
3.
Objectives
The objectives ofSQL Server Reporting Services
(SSRS) is to make you familiar with the concepts
like:
Create a project report
Set up a data connection
Define a query
Add a table data region
SSRS prerequisites
To learnSSRS, there is no need to have advanced
knowledge of the database. Learn some basics of
SQL Server, especially SELECT statements.
6.
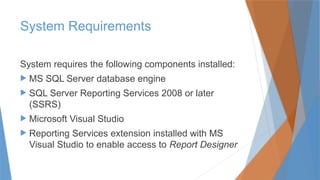
System Requirements
System requiresthe following components installed:
MS SQL Server database engine
SQL Server Reporting Services 2008 or later
(SSRS)
Microsoft Visual Studio
Reporting Services extension installed with MS
Visual Studio to enable access to Report Designer
7.
What is SSRSin SQL server?
SQL Server Reporting Services is a feature given by MS
SQL Server which is used to design, develop, test, and
deploy reports. It is a server-based report generating
system given by Microsoft which is a part of a suite of
Microsoft SQL Server Services. The system is used to
prepare and deliver a variety of interactive and printed
reports. MS Visual Studio gets an interface so that
developers and SQL administrators may connect to
SQL databases and use SSRS tools to format SQL
reports in many complex ways.
8.
What is SSRSin SQL server? (cont.)
With SSRS, you can create formatted reports with
the help of tables, graphs, and charts. SSRS reports
are hosted on a server that can be executed anytime
by using parameters.
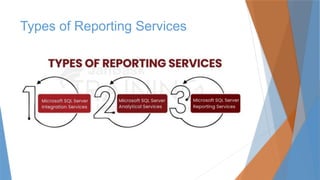
Types of ReportingServices
Primarily, there are three types of reporting services.
Microsoft SQL Server Integration Services (SSIS): It
integrates data from different sources
Microsoft SQL Server Analytical Services (SSAS): It
helps in the analysis of data
Microsoft SQL Server Reporting Services (SSRS): It
allows for generating a visual report of data
11.
Why SSRS?
To makeeffective business decisions, users across
the company need to have easy access to the
informative and instinctual reports that combine data
from many sources throughout the organization; this
is where SSRS helps the organization with the
conjunction of SQL Server databases. If your
organization already has an Enterprise, Standard, or
Express Edition, then you already have SSRS
access to you. So, there is no need to shell out extra
money for purchasing SSRS.
12.
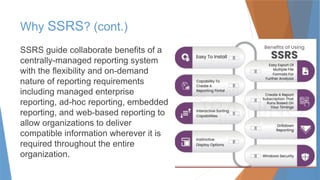
Why SSRS? (cont.)
SSRSguide collaborate benefits of a
centrally-managed reporting system
with the flexibility and on-demand
nature of reporting requirements
including managed enterprise
reporting, ad-hoc reporting, embedded
reporting, and web-based reporting to
allow organizations to deliver
compatible information wherever it is
required throughout the entire
organization.
13.
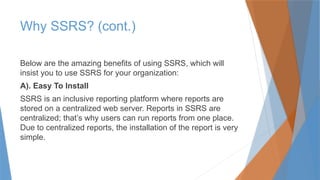
Why SSRS? (cont.)
Beloware the amazing benefits of using SSRS, which will
insist you to use SSRS for your organization:
A). Easy To Install
SSRS is an inclusive reporting platform where reports are
stored on a centralized web server. Reports in SSRS are
centralized; that’s why users can run reports from one place.
Due to centralized reports, the installation of the report is very
simple.
14.
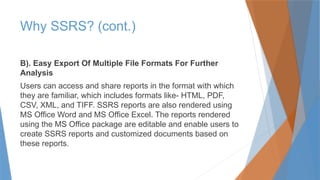
Why SSRS? (cont.)
B).Easy Export Of Multiple File Formats For Further
Analysis
Users can access and share reports in the format with which
they are familiar, which includes formats like- HTML, PDF,
CSV, XML, and TIFF. SSRS reports are also rendered using
MS Office Word and MS Office Excel. The reports rendered
using the MS Office package are editable and enable users to
create SSRS reports and customized documents based on
these reports.
15.
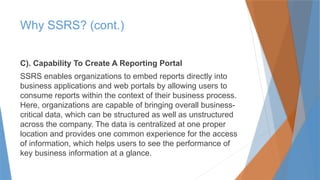
Why SSRS? (cont.)
C).Capability To Create A Reporting Portal
SSRS enables organizations to embed reports directly into
business applications and web portals by allowing users to
consume reports within the context of their business process.
Here, organizations are capable of bringing overall business-
critical data, which can be structured as well as unstructured
across the company. The data is centralized at one proper
location and provides one common experience for the access
of information, which helps users to see the performance of
key business information at a glance.
16.
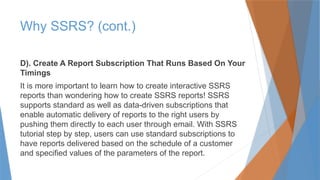
Why SSRS? (cont.)
D).Create A Report Subscription That Runs Based On Your
Timings
It is more important to learn how to create interactive SSRS
reports than wondering how to create SSRS reports! SSRS
supports standard as well as data-driven subscriptions that
enable automatic delivery of reports to the right users by
pushing them directly to each user through email. With SSRS
tutorial step by step, users can use standard subscriptions to
have reports delivered based on the schedule of a customer
and specified values of the parameters of the report.
17.
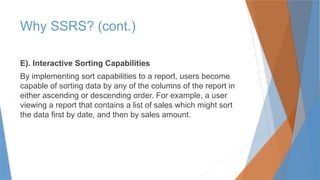
Why SSRS? (cont.)
E).Interactive Sorting Capabilities
By implementing sort capabilities to a report, users become
capable of sorting data by any of the columns of the report in
either ascending or descending order. For example, a user
viewing a report that contains a list of sales which might sort
the data first by date, and then by sales amount.
18.
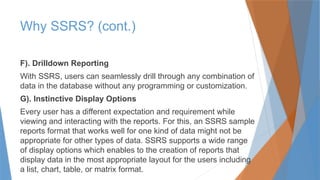
F). Drilldown Reporting
WithSSRS, users can seamlessly drill through any combination of
data in the database without any programming or customization.
G). Instinctive Display Options
Every user has a different expectation and requirement while
viewing and interacting with the reports. For this, an SSRS sample
reports format that works well for one kind of data might not be
appropriate for other types of data. SSRS supports a wide range
of display options which enables to the creation of reports that
display data in the most appropriate layout for the users including
a list, chart, table, or matrix format.
Why SSRS? (cont.)
19.
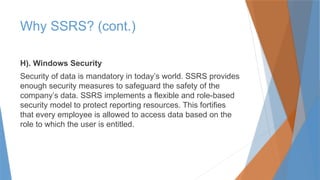
H). Windows Security
Securityof data is mandatory in today’s world. SSRS provides
enough security measures to safeguard the safety of the
company’s data. SSRS implements a flexible and role-based
security model to protect reporting resources. This fortifies
that every employee is allowed to access data based on the
role to which the user is entitled.
Why SSRS? (cont.)
20.
Example of SSRSReporting
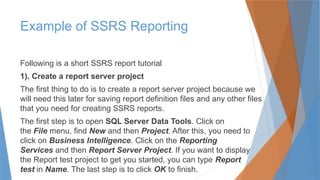
Following is a short SSRS report tutorial
1). Create a report server project
The first thing to do is to create a report server project because we
will need this later for saving report definition files and any other files
that you need for creating SSRS reports.
The first step is to open SQL Server Data Tools. Click on
the File menu, find New and then Project. After this, you need to
click on Business Intelligence. Click on the Reporting
Services and then Report Server Project. If you want to display
the Report test project to get you started, you can type Report
test in Name. The last step is to click OK to finish.
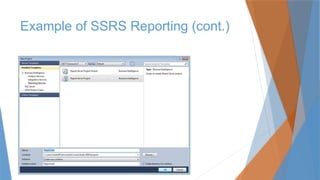
2). Create anew report definition file
In the View menu find the Solution Explorer and then right-click
on the Reports folder. In the Add section click New Item. In the
window Add New Item, click Report. As you can see, Report
Designer has two available views. In Design view, you define
your report layout, and in the Preview view, you can run your
report.
Example of SSRS Reporting (cont.)
23.
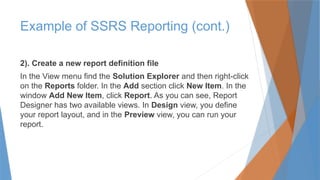
3). Defining DataSource & Dataset
Setting up a connection
To retrieve data from a database or some other resource, you will
need to define the data source. In the following section, you will
see how you can define the data source. We will use
AdventureWorks2012 database as an example.
In the View menu find and click Report Data, then New and after
that Data Source. Type AdventureWorks2012 in the field Name.
Select Embedded connection As Type select Microsoft SQL
Server.
Example of SSRS Reporting (cont.)
24.
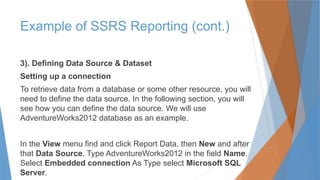
In Connection stringfield type:
Data source=localhost; initial catalog=AdventureWorks2012
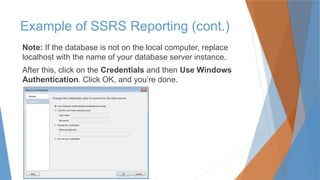
Example of SSRS Reporting (cont.)
25.
Note: If thedatabase is not on the local computer, replace
localhost with the name of your database server instance.
After this, click on the Credentials and then Use Windows
Authentication. Click OK, and you’re done.
Example of SSRS Reporting (cont.)
26.
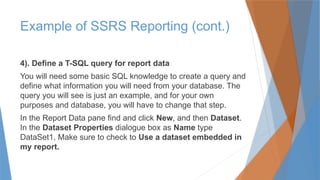
4). Define aT-SQL query for report data
You will need some basic SQL knowledge to create a query and
define what information you will need from your database. The
query you will see is just an example, and for your own
purposes and database, you will have to change that step.
In the Report Data pane find and click New, and then Dataset.
In the Dataset Properties dialogue box as Name type
DataSet1, Make sure to check to Use a dataset embedded in
my report.
Example of SSRS Reporting (cont.)
27.
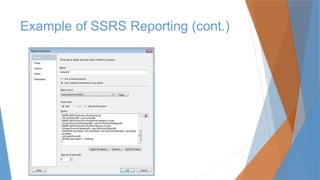
Then select AdventureWorks2012as your data source,
Check Text as a Type, and type this into the Query input:
Example of SSRS Reporting (cont.)
SELECT soh.OrderDate AS [Date], soh.SalesOrderNumber AS [Order], pps.Name
AS [Subcat], pp.Name as [Product], SUM(sd.OrderQty) AS [Qty],
SUM(sd.LineTotal) AS [LineTotal] FROM Sales.SalesPerson sp INNER JOIN
Sales.SalesOrderHeader AS soh ON sp.BusinessEntityID = soh.SalesPersonID
INNER JOIN Sales.SalesOrderDetail AS sd ON sd.SalesOrderID =
soh.SalesOrderID INNER JOIN Production.Product AS pp ON sd.ProductID =
pp.ProductID INNER JOIN Production.ProductSubcategory AS pps ON
pp.ProductSubcategoryID = pps.ProductSubcategoryID INNER JOIN
Production.ProductCategory AS ppc ON ppc.ProductCategoryID =
pps.ProductCategoryID GROUP BY ppc.Name, soh.OrderDate,
soh.SalesOrderNumber, pps.Name, pp.Name,soh.SalesPersonID HAVING ppc.Name =
'Clothing'
How To AddA Table And Fields To A
Report Layout
After finishing with previous technical details, we can start with
more interesting things, like designing your first SSRS report.
This part is easy because instead of writing code, you can
drag-and-drop graphic icons into the report format. This
section will show you how to add Table and Fields to your
report.
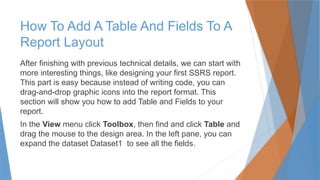
In the View menu click Toolbox, then find and click Table and
drag the mouse to the design area. In the left pane, you can
expand the dataset Dataset1 to see all the fields.
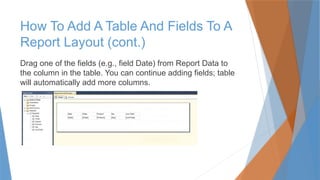
30.
Drag one ofthe fields (e.g., field Date) from Report Data to
the column in the table. You can continue adding fields; table
will automatically add more columns.
How To Add A Table And Fields To A
Report Layout (cont.)
31.
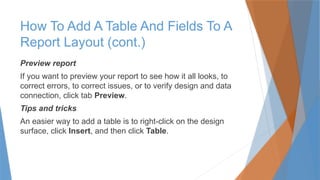
Preview report
If youwant to preview your report to see how it all looks, to
correct errors, to correct issues, or to verify design and data
connection, click tab Preview.
Tips and tricks
An easier way to add a table is to right-click on the design
surface, click Insert, and then click Table.
How To Add A Table And Fields To A
Report Layout (cont.)
32.
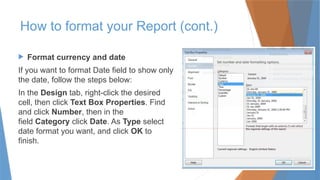
How to formatyour Report (cont.)
Format currency and date
If you want to format Date field to show only
the date, follow the steps below:
In the Design tab, right-click the desired
cell, then click Text Box Properties. Find
and click Number, then in the
field Category click Date. As Type select
date format you want, and click OK to
finish.
33.
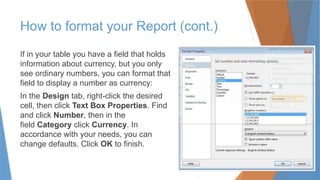
If in yourtable you have a field that holds
information about currency, but you only
see ordinary numbers, you can format that
field to display a number as currency:
In the Design tab, right-click the desired
cell, then click Text Box Properties. Find
and click Number, then in the
field Category click Currency. In
accordance with your needs, you can
change defaults. Click OK to finish.
How to format your Report (cont.)
34.
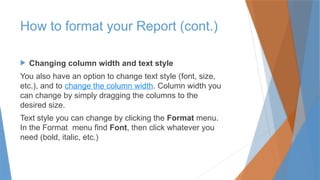
Changing columnwidth and text style
You also have an option to change text style (font, size,
etc.), and to change the column width. Column width you
can change by simply dragging the columns to the
desired size.
Text style you can change by clicking the Format menu.
In the Format menu find Font, then click whatever you
need (bold, italic, etc.)
How to format your Report (cont.)
35.
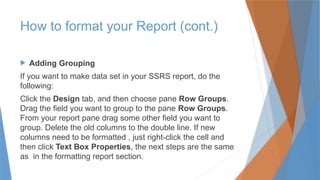
Adding Grouping
Ifyou want to make data set in your SSRS report, do the
following:
Click the Design tab, and then choose pane Row Groups.
Drag the field you want to group to the pane Row Groups.
From your report pane drag some other field you want to
group. Delete the old columns to the double line. If new
columns need to be formatted , just right-click the cell and
then click Text Box Properties, the next steps are the same
as in the formatting report section.
How to format your Report (cont.)
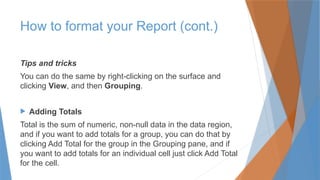
Tips and tricks
Youcan do the same by right-clicking on the surface and
clicking View, and then Grouping.
Adding Totals
Total is the sum of numeric, non-null data in the data region,
and if you want to add totals for a group, you can do that by
clicking Add Total for the group in the Grouping pane, and if
you want to add totals for an individual cell just click Add Total
for the cell.
How to format your Report (cont.)
38.
Add adaily total and grand total
Right-click the cell [Order] and choose to Add total, then
click After.
Type Daily to format a new name, Daily Total
After that, select the new cell [Daily Total], two Sum cells,
and the empty cell you see between them.
In the Format menu, choose a background color. We chose
the color orange.
How to format your Report (cont.)
39.
Right-click thecell [Date] and choose to Add total, and then
After.Type Grand to format a new name, Grand Total.
Select the new cell [Grand Total], the two [Sum] cells and
the empty cell you see between them. In the Format menu,
choose a background color. We chose the color light-blue.
How to format your Report (cont.)
40.
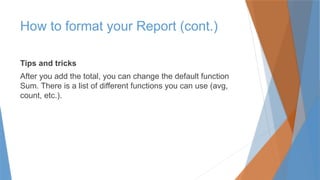
Tips and tricks
Afteryou add the total, you can change the default function
Sum. There is a list of different functions you can use (avg,
count, etc.).
How to format your Report (cont.)
41.
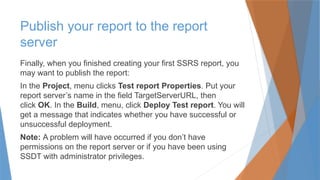
Publish your reportto the report
server
Finally, when you finished creating your first SSRS report, you
may want to publish the report:
In the Project, menu clicks Test report Properties. Put your
report server’s name in the field TargetServerURL, then
click OK. In the Build, menu, click Deploy Test report. You will
get a message that indicates whether you have successful or
unsuccessful deployment.
Note: A problem will have occurred if you don’t have
permissions on the report server or if you have been using
SSDT with administrator privileges.
42.
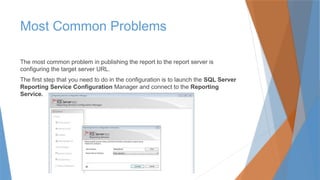
Most Common Problems
Themost common problem in publishing the report to the report server is
configuring the target server URL.
The first step that you need to do in the configuration is to launch the SQL Server
Reporting Service Configuration Manager and connect to the Reporting
Service.
43.
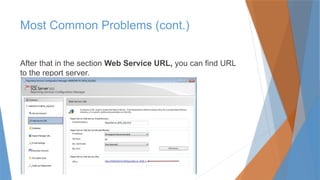
Most Common Problems(cont.)
After that in the section Web Service URL, you can find URL
to the report server.
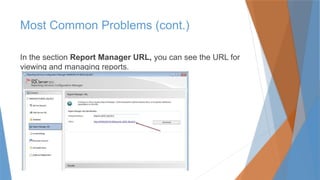
44.
In the sectionReport Manager URL, you can see the URL for
viewing and managing reports.
Most Common Problems (cont.)
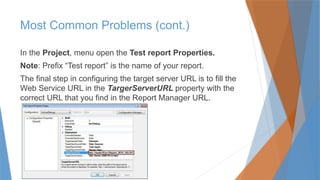
45.
In the Project,menu open the Test report Properties.
Note: Prefix “Test report” is the name of your report.
The final step in configuring the target server URL is to fill the
Web Service URL in the TargerServerURL property with the
correct URL that you find in the Report Manager URL.
Most Common Problems (cont.)
46.
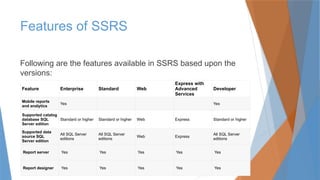
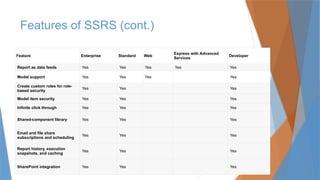
Features of SSRS
Followingare the features available in SSRS based upon the
versions:
Feature Enterprise Standard Web
Express with
Advanced
Services
Developer
Mobile reports
and analytics
Yes Yes
Supported catalog
database SQL
Server edition
Standard or higher Standard or higher Web Express Standard or higher
Supported data
source SQL
Server edition
All SQL Server
editions
All SQL Server
editions
Web Express
All SQL Server
editions
Report server Yes Yes Yes Yes Yes
Report designer Yes Yes Yes Yes Yes
47.
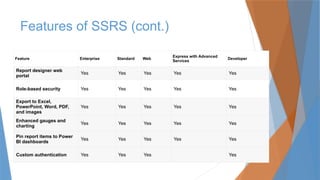
Features of SSRS(cont.)
Feature Enterprise Standard Web
Express with Advanced
Services
Developer
Report designer web
portal
Yes Yes Yes Yes Yes
Role-based security Yes Yes Yes Yes Yes
Export to Excel,
PowerPoint, Word, PDF,
and images
Yes Yes Yes Yes Yes
Enhanced gauges and
charting
Yes Yes Yes Yes Yes
Pin report items to Power
BI dashboards
Yes Yes Yes Yes Yes
Custom authentication Yes Yes Yes Yes
48.
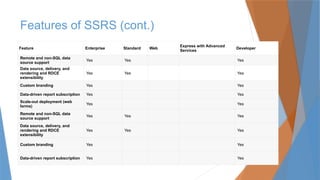
Features of SSRS(cont.)
Feature Enterprise Standard Web
Express with Advanced
Services
Developer
Report as data feeds Yes Yes Yes Yes Yes
Model support Yes Yes Yes Yes
Create custom roles for role-
based security
Yes Yes Yes
Model item security Yes Yes Yes
Infinite click through Yes Yes Yes
Shared-component library Yes Yes Yes
Email and file share
subscriptions and scheduling
Yes Yes Yes
Report history, execution
snapshots, and caching
Yes Yes Yes
SharePoint integration Yes Yes Yes
49.
Features of SSRS(cont.)
Feature Enterprise Standard Web
Express with Advanced
Services
Developer
Remote and non-SQL data
source support
Yes Yes Yes
Data source, delivery, and
rendering and RDCE
extensibility
Yes Yes Yes
Custom branding Yes Yes
Data-driven report subscription Yes Yes
Scale-out deployment (web
farms)
Yes Yes
Remote and non-SQL data
source support
Yes Yes Yes
Data source, delivery, and
rendering and RDCE
extensibility
Yes Yes Yes
Custom branding Yes Yes
Data-driven report subscription Yes Yes
50.
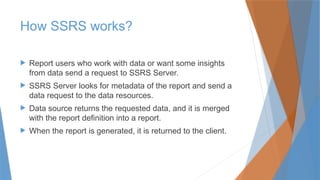
How SSRS works?
Report users who work with data or want some insights
from data send a request to SSRS Server.
SSRS Server looks for metadata of the report and send a
data request to the data resources.
Data source returns the requested data, and it is merged
with the report definition into a report.
When the report is generated, it is returned to the client.
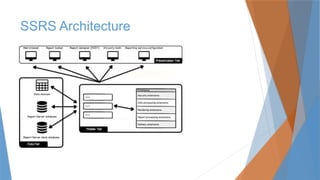
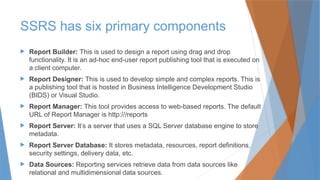
SSRS has sixprimary components
Report Builder: This is used to design a report using drag and drop
functionality. It is an ad-hoc end-user report publishing tool that is executed on
a client computer.
Report Designer: This is used to develop simple and complex reports. This is
a publishing tool that is hosted in Business Intelligence Development Studio
(BIDS) or Visual Studio.
Report Manager: This tool provides access to web-based reports. The default
URL of Report Manager is http:///reports
Report Server: It’s a server that uses a SQL Server database engine to store
metadata.
Report Server Database: It stores metadata, resources, report definitions,
security settings, delivery data, etc.
Data Sources: Reporting services retrieve data from data sources like
relational and multidimensional data sources.
53.
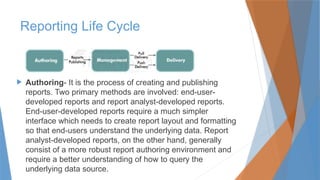
Reporting Life Cycle
Authoring- It is the process of creating and publishing
reports. Two primary methods are involved: end-user-
developed reports and report analyst-developed reports.
End-user-developed reports require a much simpler
interface which needs to create report layout and formatting
so that end-users understand the underlying data. Report
analyst-developed reports, on the other hand, generally
consist of a more robust report authoring environment and
require a better understanding of how to query the
underlying data source.
54.
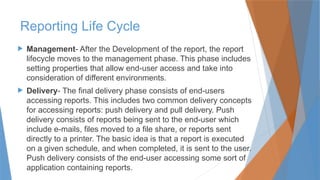
Management- Afterthe Development of the report, the report
lifecycle moves to the management phase. This phase includes
setting properties that allow end-user access and take into
consideration of different environments.
Delivery- The final delivery phase consists of end-users
accessing reports. This includes two common delivery concepts
for accessing reports: push delivery and pull delivery. Push
delivery consists of reports being sent to the end-user which
include e-mails, files moved to a file share, or reports sent
directly to a printer. The basic idea is that a report is executed
on a given schedule, and when completed, it is sent to the user.
Push delivery consists of the end-user accessing some sort of
application containing reports.
Reporting Life Cycle
55.
What is RDL?
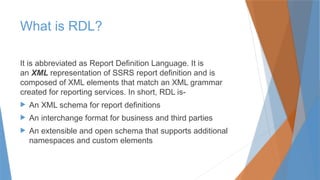
Itis abbreviated as Report Definition Language. It is
an XML representation of SSRS report definition and is
composed of XML elements that match an XML grammar
created for reporting services. In short, RDL is-
An XML schema for report definitions
An interchange format for business and third parties
An extensible and open schema that supports additional
namespaces and custom elements
56.
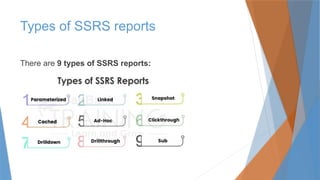
Types of SSRSreports
There are 9 types of SSRS reports:
57.
1). Parameterized Reports
Thesetypes of reports use input values to complete the
report. With these reports, you may differentiate the output of
a report based on values that are positioned when the report
runs. These reports are frequently used for drill-through
reports, linked reports, and subreports for connecting and
filtering reports with related data.
Types of SSRS reports (cont.)
58.
2). Linked Reports
Itis a report server item that provides an access point to an existing
report. Ideally, it is similar to a program shortcut that you use to run a
program. When you install a software program in your system or create a
Java application, you don’t open the whole folder, but you will only run the
‘.exe’ file to run the application, whether it is a software program or a Java
application. Linked reports are the same. Linked reports can be created
on the report server when you want to create an additional version of an
existing report. For example, a single regional sales report can be used to
create region-based reports for all your sales enclaves. You can create
linked reports whenever you want to install an existing report with
different settings.
Types of SSRS reports (cont.)
59.
3). Snapshot Reports
Itis a kind of report that contains information of the report layout and query results
that were redeemed at a specific point in time. Snapshots report are processed on
a planned schedule and then it is saved on a report server database and shows
the current layout and data of the report at the time the snapshot was created.
There is no specific rendering format of the snapshot reports but the final view
of the report is viewed after the request of user in the following formats-
HTML (XHTML)
Excel
Acrobat
Tiff (image)
XML
CSV
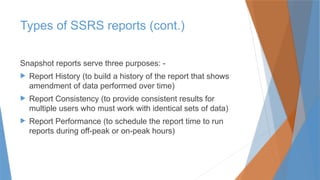
Types of SSRS reports (cont.)
60.
Snapshot reports servethree purposes: -
Report History (to build a history of the report that shows
amendment of data performed over time)
Report Consistency (to provide consistent results for
multiple users who must work with identical sets of data)
Report Performance (to schedule the report time to run
reports during off-peak or on-peak hours)
Types of SSRS reports (cont.)
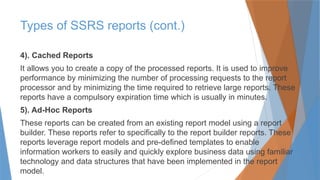
61.
4). Cached Reports
Itallows you to create a copy of the processed reports. It is used to improve
performance by minimizing the number of processing requests to the report
processor and by minimizing the time required to retrieve large reports. These
reports have a compulsory expiration time which is usually in minutes.
5). Ad-Hoc Reports
These reports can be created from an existing report model using a report
builder. These reports refer to specifically to the report builder reports. These
reports leverage report models and pre-defined templates to enable
information workers to easily and quickly explore business data using familiar
technology and data structures that have been implemented in the report
model.
Types of SSRS reports (cont.)
62.
6). Clickthrough Reports
Thisreport displays related data from a report model when
you click interactive data carried within your model-based
report. This is generated by the report server based on the
information carried within the report model. These field
settings cannot be modified in the report authoring tools.
Clickthrough reports are autogenerated, but you can create
customized reports as an alternative report to the model for
interactive data items that are displayed on the screen. The
customized report is a standard reporting services report.
Types of SSRS reports (cont.)
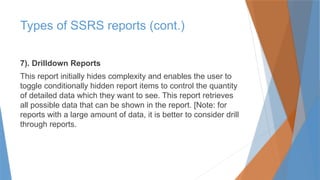
63.
7). Drilldown Reports
Thisreport initially hides complexity and enables the user to
toggle conditionally hidden report items to control the quantity
of detailed data which they want to see. This report retrieves
all possible data that can be shown in the report. [Note: for
reports with a large amount of data, it is better to consider drill
through reports.
Types of SSRS reports (cont.)
64.
8). Drillthrough Reports
Thiskind of report is accessed through a hyperlink on a text
box in the original report. The report works with the main
report and is the target of a drill through action for a report
item such as placeholder text or a chart. The main report
outputs summary information in the form of a matrix or chart.
Actions defined in the matrix or chart provide drill-through
links to reports that display larger details based on the
aggregate in the main report. These reports can be filtered by
using parameters. These are customized reports that are
saved on the report server and open separately.
Types of SSRS reports (cont.)
65.
9). Subreports
This kindof report displays another report inside the body of
the main report. Ideally, a subreport is similar to a frame in a
webpage. As its name suggests, it is embedded within a
report. Any report can be used as a subreport. It uses different
data sources as compared to the main report. The subreport
is stored on a report server usually in the same folder as the
parent report. You may set up a subreport to pass parameters
to the subreport. [Note: For reports with many instances of
subreports, consider using drill through reports]
Types of SSRS reports (cont.)
66.
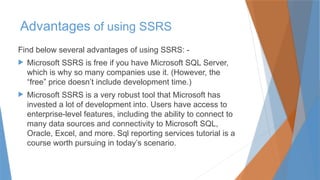
Advantages of usingSSRS
Find below several advantages of using SSRS: -
Microsoft SSRS is free if you have Microsoft SQL Server,
which is why so many companies use it. (However, the
“free” price doesn’t include development time.)
Microsoft SSRS is a very robust tool that Microsoft has
invested a lot of development into. Users have access to
enterprise-level features, including the ability to connect to
many data sources and connectivity to Microsoft SQL,
Oracle, Excel, and more. Sql reporting services tutorial is a
course worth pursuing in today’s scenario.
67.
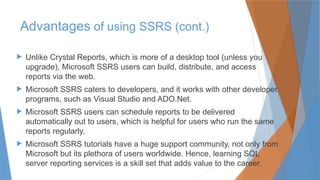
Unlike CrystalReports, which is more of a desktop tool (unless you
upgrade), Microsoft SSRS users can build, distribute, and access
reports via the web.
Microsoft SSRS caters to developers, and it works with other developer
programs, such as Visual Studio and ADO.Net.
Microsoft SSRS users can schedule reports to be delivered
automatically out to users, which is helpful for users who run the same
reports regularly.
Microsoft SSRS tutorials have a huge support community, not only from
Microsoft but its plethora of users worldwide. Hence, learning SQL
server reporting services is a skill set that adds value to the career.
Advantages of using SSRS (cont.)
68.
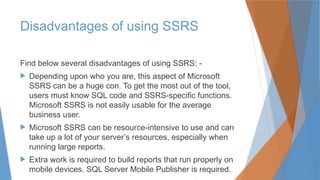
Disadvantages of usingSSRS
Find below several disadvantages of using SSRS: -
Depending upon who you are, this aspect of Microsoft
SSRS can be a huge con. To get the most out of the tool,
users must know SQL code and SSRS-specific functions.
Microsoft SSRS is not easily usable for the average
business user.
Microsoft SSRS can be resource-intensive to use and can
take up a lot of your server’s resources, especially when
running large reports.
Extra work is required to build reports that run properly on
mobile devices. SQL Server Mobile Publisher is required.
69.
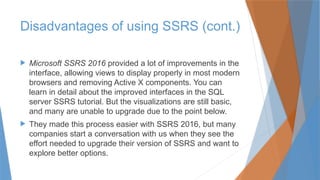
Microsoft SSRS2016 provided a lot of improvements in the
interface, allowing views to display properly in most modern
browsers and removing Active X components. You can
learn in detail about the improved interfaces in the SQL
server SSRS tutorial. But the visualizations are still basic,
and many are unable to upgrade due to the point below.
They made this process easier with SSRS 2016, but many
companies start a conversation with us when they see the
effort needed to upgrade their version of SSRS and want to
explore better options.
Disadvantages of using SSRS (cont.)
70.
Conclusion
SQL Reporting Servicesis a unified solution of report
designing and data warehousing. You can create graphical
and tabular data and also set the permission of access. The
companies are aligning themselves with the SQL Reporting
Services to streamline the business for better outputs.

![Then select AdventureWorks2012 as your data source,
Check Text as a Type, and type this into the Query input:
Example of SSRS Reporting (cont.)
SELECT soh.OrderDate AS [Date], soh.SalesOrderNumber AS [Order], pps.Name
AS [Subcat], pp.Name as [Product], SUM(sd.OrderQty) AS [Qty],
SUM(sd.LineTotal) AS [LineTotal] FROM Sales.SalesPerson sp INNER JOIN
Sales.SalesOrderHeader AS soh ON sp.BusinessEntityID = soh.SalesPersonID
INNER JOIN Sales.SalesOrderDetail AS sd ON sd.SalesOrderID =
soh.SalesOrderID INNER JOIN Production.Product AS pp ON sd.ProductID =
pp.ProductID INNER JOIN Production.ProductSubcategory AS pps ON
pp.ProductSubcategoryID = pps.ProductSubcategoryID INNER JOIN
Production.ProductCategory AS ppc ON ppc.ProductCategoryID =
pps.ProductCategoryID GROUP BY ppc.Name, soh.OrderDate,
soh.SalesOrderNumber, pps.Name, pp.Name,soh.SalesPersonID HAVING ppc.Name =
'Clothing'](https://image.slidesharecdn.com/01sqlserverreportingservices-251019135642-fa698462/85/Microsoft-SQL-Server-Reporting-Services-pptx-27-320.jpg)
![ Add a daily total and grand total
Right-click the cell [Order] and choose to Add total, then
click After.
Type Daily to format a new name, Daily Total
After that, select the new cell [Daily Total], two Sum cells,
and the empty cell you see between them.
In the Format menu, choose a background color. We chose
the color orange.
How to format your Report (cont.)](https://image.slidesharecdn.com/01sqlserverreportingservices-251019135642-fa698462/85/Microsoft-SQL-Server-Reporting-Services-pptx-38-320.jpg)
![ Right-click the cell [Date] and choose to Add total, and then
After.Type Grand to format a new name, Grand Total.
Select the new cell [Grand Total], the two [Sum] cells and
the empty cell you see between them. In the Format menu,
choose a background color. We chose the color light-blue.
How to format your Report (cont.)](https://image.slidesharecdn.com/01sqlserverreportingservices-251019135642-fa698462/85/Microsoft-SQL-Server-Reporting-Services-pptx-39-320.jpg)
![9). Subreports
This kind of report displays another report inside the body of
the main report. Ideally, a subreport is similar to a frame in a
webpage. As its name suggests, it is embedded within a
report. Any report can be used as a subreport. It uses different
data sources as compared to the main report. The subreport
is stored on a report server usually in the same folder as the
parent report. You may set up a subreport to pass parameters
to the subreport. [Note: For reports with many instances of
subreports, consider using drill through reports]
Types of SSRS reports (cont.)](https://image.slidesharecdn.com/01sqlserverreportingservices-251019135642-fa698462/85/Microsoft-SQL-Server-Reporting-Services-pptx-65-320.jpg)