


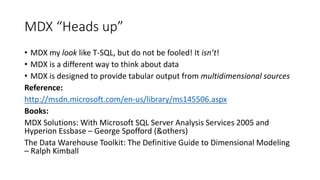
![Multi-dimensonal Expression Language (MDX)
Example
Syntax
[ WITH <SELECT WITH clause> [ , <SELECT WITH clause> ... ] ]
SELECT [ * | ( <SELECT query axis clause>
[ , <SELECT query axis clause> ... ] ) ]
FROM <SELECT subcube clause>
[ <SELECT slicer axis clause> ]
[ <SELECT cell property list clause> ]
SELECT NON EMPTY { [Measures].[Reseller Order Quantity],
[Measures].[Reseller Gross Profit], [Measures].[Reseller Sales
Amount] } ON COLUMNS, NON EMPTY { ([Product].[Product
Categories].[Product].ALLMEMBERS *
[Date].[Fiscal].[Date].ALLMEMBERS ) } DIMENSION PROPERTIES
MEMBER_CAPTION, MEMBER_UNIQUE_NAME ON ROWS
FROM [Adventure Works] CELL PROPERTIES VALUE,
BACK_COLOR, FORE_COLOR, FORMATTED_VALUE,
FORMAT_STRING, FONT_NAME, FONT_SIZE, FONT_FLAGS
Reference:
http://technet.microsoft.com/en-us/library/ms145595.aspx](https://image.slidesharecdn.com/microsoftssasintroductionpatsheehanmay2014-140527142925-phpapp02/85/Microsoft-SQL-Server-Analysis-Services-SSAS-A-Practical-Introduction-19-320.jpg)


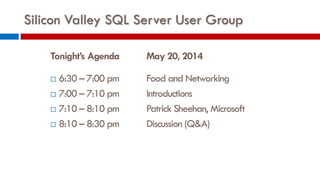
The Silicon Valley SQL Server User Group meeting scheduled for May 20, 2014, includes food and networking, followed by a presentation by Patrick Sheehan from Microsoft and a discussion session. The agenda features a focus on SQL Server Analysis Services (SSAS) fundamentals, covering topics such as OLAP engines, data warehousing, and multidimensional modeling. Attendees are encouraged to participate in upcoming meetings and announcements related to new job opportunities and projects.