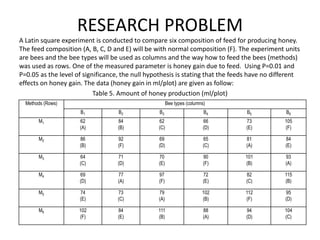
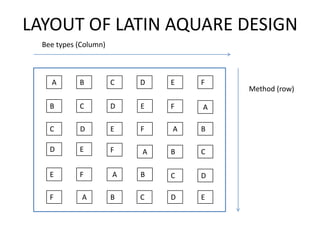
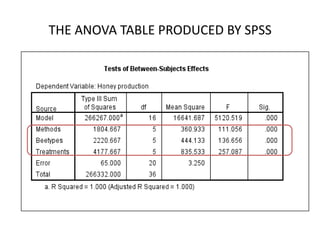
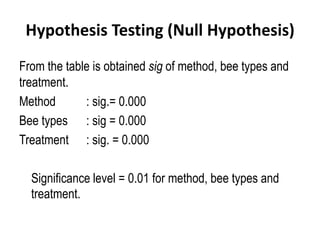
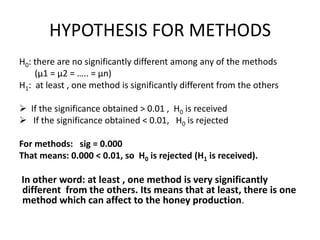
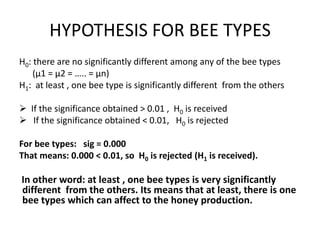
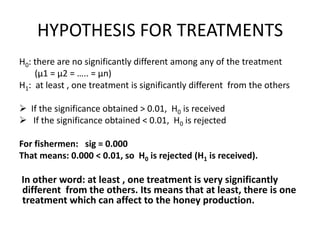
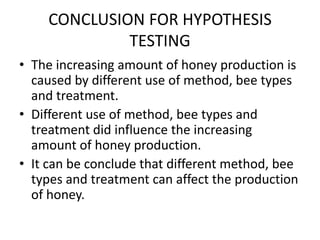
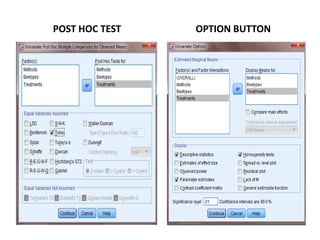
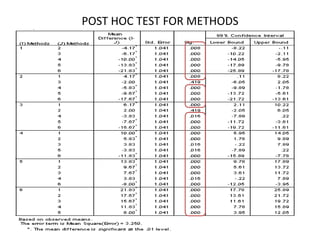
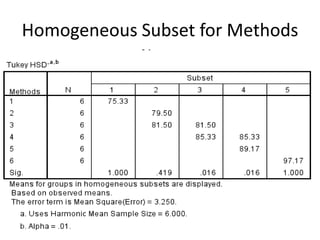
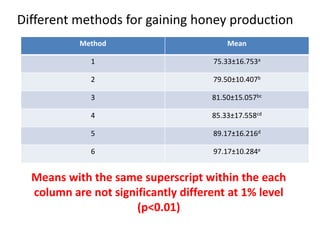
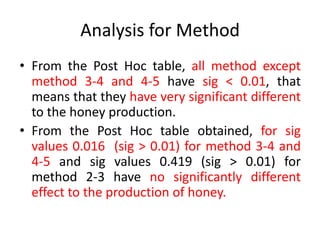
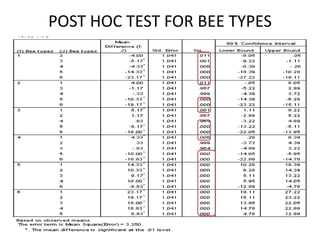
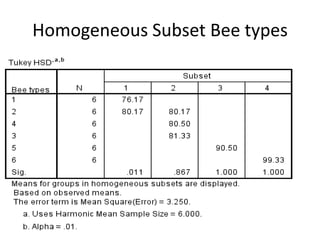
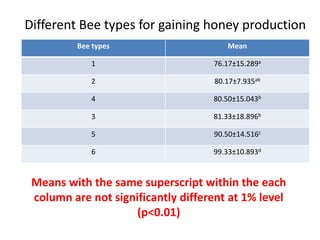
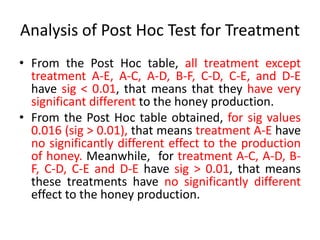
SlideShare a Scribd company logo
Analysis of Variance (ANOVA)
Latin Square Design (LS)
Group 5
 SITI NORHAJAR BINTI ZAKARIA UK 28316
 TENGKU MURIANA BINTI TENGKU AZMAN UK 28331
 SITI NUR ADILA BINTI HAMZAH UK 28361
 MOHD SADDAM BIN ZAINUDIN UK 28366
 ASMIZA BINTI ABDULLAH UK 28373
 NOR ATIQAH BINTI LOKMAN UK 28376
 NURFATANAZIRAH BINTI SAAD UK 28377
 FARAH NABILA BINTI ALI UK 28380
Content List of Presentation
1) The research Problem
2) Treatments and Explanations
3) Field Layout of Experimental Designs
4) Step-by-step Procedures of Experimental Designs
5) ANOVA Table
6) Hypothesis Testing (Null Hypothesis)
7) Conclusions of Hypothesis Testing
8) Post Hoc Test (i.e. Turkey Test)
9) Result & Discussion (Give some logical Reasons)
10) Summary
11) Recommendations
RESEARCH PROBLEM
A Latin square experiment is conducted to compare six composition of feed for producing honey.
The feed composition (A, B, C, D and E) will be with normal composition (F). The experiment units
are bees and the bee types will be used as columns and the way how to feed the bees (methods)
was used as rows. One of the measured parameter is honey gain due to feed. Using P=0.01 and
P=0.05 as the level of significance, the null hypothesis is stating that the feeds have no different
effects on honey gain. The data (honey gain in ml/plot) are given as follow:
Table 5. Amount of honey production (ml/plot)
Methods (Rows) Bee types (columns)
B1 B2 B3 B4 B5 B6
M1 62
(A)
84
(B)
62
(C)
66
(D)
73
(E)
105
(F)
M2 86
(B)
92
(F)
69
(D)
65
(C)
81
(A)
84
(E)
M3 64
(C)
71
(D)
70
(E)
90
(F)
101
(B)
93
(A)
M4 69
(D)
77
(A)
97
(F)
72
(E)
82
(C)
115
(B)
M5 74
(E)
73
(C)
79
(A)
102
(B)
112
(F)
95
(D)
M6 102
(F)
84
(E)
111
(B)
88
(A)
94
(D)
104
(C)
LAYOUT OF LATIN AQUARE DESIGN
A
B
C
D
E
F
B C
D
E
F A
D
C
F
E
D
E
F
B
A
A B
E
C
F
A
B
C
D
F
A
B
C
D
E
Bee types (Column)
Method (row)
ENTERING DATA
SELECT
ANALYZE -> GENERAL LINEAR MODEL -> UNIVARIATE
SELECT THE DEPENDENT VARIABLE AND THREE
FACTORS –ROWS, COLUMNS, TREATMENTS
SELECT MODEL
IDENTIFY A MODEL THAT HAS ONLY MAIN
EFFECTS FOR ROWS, COLUMNS, TREATMENTS
THE ANOVA TABLE PRODUCED BY SPSS
Hypothesis Testing (Null Hypothesis)
From the table is obtained sig of method, bee types and
treatment.
Method : sig.= 0.000
Bee types : sig = 0.000
Treatment : sig. = 0.000
Significance level = 0.01 for method, bee types and
treatment.
HYPOTHESIS FOR METHODS
H0: there are no significantly different among any of the methods
(µ1 = µ2 = ….. = µn)
H1: at least , one method is significantly different from the others
 If the significance obtained > 0.01 , H0 is received
 If the significance obtained < 0.01, H0 is rejected
For methods: sig = 0.000
That means: 0.000 < 0.01, so H0 is rejected (H1 is received).
In other word: at least , one method is very significantly
different from the others. Its means that at least, there is one
method which can affect to the honey production.
HYPOTHESIS FOR BEE TYPES
H0: there are no significantly different among any of the bee types
(µ1 = µ2 = ….. = µn)
H1: at least , one bee type is significantly different from the others
 If the significance obtained > 0.01 , H0 is received
 If the significance obtained < 0.01, H0 is rejected
For bee types: sig = 0.000
That means: 0.000 < 0.01, so H0 is rejected (H1 is received).
In other word: at least , one bee types is very significantly
different from the others. Its means that at least, there is one
bee types which can affect to the honey production.
HYPOTHESIS FOR TREATMENTS
H0: there are no significantly different among any of the treatment
(µ1 = µ2 = ….. = µn)
H1: at least , one treatment is significantly different from the others
 If the significance obtained > 0.01, H0 is received
 If the significance obtained < 0.01, H0 is rejected
For fishermen: sig = 0.000
That means: 0.000 < 0.01, so H0 is rejected (H1 is received).
In other word: at least , one treatment is very significantly
different from the others. Its means that at least, there is one
treatment which can affect to the honey production.
CONCLUSION FOR HYPOTHESIS
TESTING
• The increasing amount of honey production is
caused by different use of method, bee types
and treatment.
• Different use of method, bee types and
treatment did influence the increasing
amount of honey production.
• It can be conclude that different method, bee
types and treatment can affect the production
of honey.
POST HOC TEST OPTION BUTTON
POST HOC TEST FOR METHODS
Homogeneous Subset for Methods
Method Mean
1 75.33±16.753a
2 79.50±10.407b
3 81.50±15.057bc
4 85.33±17.558cd
5 89.17±16.216d
6 97.17±10.284e
Means with the same superscript within the each
column are not significantly different at 1% level
(p<0.01)
Different methods for gaining honey production
Analysis for Method
• From the Post Hoc table, all method except
method 3-4 and 4-5 have sig < 0.01, that
means that they have very significant different
to the honey production.
• From the Post Hoc table obtained, for sig
values 0.016 (sig > 0.01) for method 3-4 and
4-5 and sig values 0.419 (sig > 0.01) for
method 2-3 have no significantly different
effect to the production of honey.
POST HOC TEST FOR BEE TYPES
Homogeneous Subset Bee types
Bee types Mean
1 76.17±15.289a
2 80.17±7.935ab
4 80.50±15.043b
3 81.33±18.896b
5 90.50±14.516c
6 99.33±10.893d
Means with the same superscript within the each
column are not significantly different at 1% level
(p<0.01)
Different Bee types for gaining honey production
Analysis of Post Hoc Test for Bee Types
• From the Post Hoc table, all bee types except
bee types 2-3, 2-4 and 4-3 have sig < 0.01, that
means that they have very significant different
to the honey production.
• From the Post Hoc table obtained, for sig
values (sig > 0.01), that means bee types 2-3,
2-4 and 4-3 have no significantly different
effect to the production of honey.
POST HOC TEST FOR TREATMENT
Homogeneous Subset for Treatment
Treatments Mean
C 75.00±16.025a
E 76.17±6.210ab
D 77.33±13.397ab
A 80.00±10.658b
F 99.67±8.311c
B 99.83±12.671c
Means with the same superscript within the each
column are not significantly different at 1% level
(p<0.01)
Different treatments for gaining honey production
Analysis of Post Hoc Test for Treatment
• From the Post Hoc table, all treatment except
treatment A-E, A-C, A-D, B-F, C-D, C-E, and D-E
have sig < 0.01, that means that they have very
significant different to the honey production.
• From the Post Hoc table obtained, for sig values
0.016 (sig > 0.01), that means treatment A-E have
no significantly different effect to the production
of honey. Meanwhile, for treatment A-C, A-D, B-
F, C-D, C-E and D-E have sig > 0.01, that means
these treatments have no significantly different
effect to the honey production.
Result and Discussion
• Based on post hoc table, we can conclude that the most effective
method, bee types and treatment that give higher production of
honey are method 6, bee types 6 and treatment B.
• Method 6 is most effective because the method used is more
convenient way to give proper feed amount to the bees and does
not disturb the bees during the production of honey.
• For bee types 6 , it is the most suitable to increase the production
of honey because this type of bees have many breeding or have
large in number so they can produce more honey.
• Whereas, for treatment B, it is the most effective because the feed
composition contain many nutrition value and high quality of feed
that can help the bees to produce more honey.
Recommendations
• Based on our research, we recommend that the
farmer should use Method 6, Bee Types 6 and
Treatment B to increase the amount of honey
production (ml/plot) because Method 6 is more
convenient way to give the proper feed amount
and Bee types 6 have more breeds or large
number compared to the other and treatment B
contain much more nutritional value, high quality
and have most suitable combination of nutrient
supply for production of honey.
THANK YOU!!!

More Related Content

What's hot

Latin square design
Latin square designLatin square design
Latin square design
Rojin Khadka
 
Introduction to ANOVA
Introduction to ANOVAIntroduction to ANOVA
Introduction to ANOVA
AKASH GHANATE
 
Analysis of variance ppt @ bec doms
Analysis of variance ppt @ bec domsAnalysis of variance ppt @ bec doms
Analysis of variance ppt @ bec doms
Babasab Patil
 
Data Transformation.ppt
Data Transformation.pptData Transformation.ppt
Data Transformation.ppt
Vishal Yadav
 
Analysis of variance anova
Analysis of variance anovaAnalysis of variance anova
ANOVA & EXPERIMENTAL DESIGNS
ANOVA & EXPERIMENTAL DESIGNSANOVA & EXPERIMENTAL DESIGNS
ANOVA & EXPERIMENTAL DESIGNS
vishwanth555
 
Test for equal variances
Test for equal variancesTest for equal variances
Test for equal variances
John Smith
 
Factorial Design
Factorial DesignFactorial Design
Factorial Design
Lucknow University India
 
Correlation and regression
Correlation and regressionCorrelation and regression
Correlation and regression
Huma Ansari
 
One way anova final ppt.
One way anova final ppt.One way anova final ppt.
One way anova final ppt.
Aadab Mushrib
 
Ch7 Analysis of Variance (ANOVA)
Ch7 Analysis of Variance (ANOVA)Ch7 Analysis of Variance (ANOVA)
Ch7 Analysis of Variance (ANOVA)
Farhan Alfin
 
Two factor factorial_design_pdf
Two factor factorial_design_pdfTwo factor factorial_design_pdf
Two factor factorial_design_pdf
Rione Drevale
 
The mann whitney u test
The mann whitney u testThe mann whitney u test
The mann whitney u test
Regent University
 
Pca analysis
Pca analysisPca analysis
Analysis Of Variance - ANOVA
Analysis Of Variance - ANOVAAnalysis Of Variance - ANOVA
Analysis Of Variance - ANOVA
Saumya Bhatnagar
 
Split-plot Designs
Split-plot DesignsSplit-plot Designs
Split-plot Designs
richardchandler
 
Completely randomized design
Completely randomized designCompletely randomized design
Completely randomized design
borahpinku
 
Design of experiments
Design of experiments Design of experiments
Exploratory Factor Analysis
Exploratory Factor AnalysisExploratory Factor Analysis
Exploratory Factor Analysis
Shailendra Tomar
 
Analysis of variance (anova)
Analysis of variance (anova)Analysis of variance (anova)
Analysis of variance (anova)
Sadhana Singh
 

What's hot (20)

Latin square design
Latin square designLatin square design
Latin square design
 
Introduction to ANOVA
Introduction to ANOVAIntroduction to ANOVA
Introduction to ANOVA
 
Analysis of variance ppt @ bec doms
Analysis of variance ppt @ bec domsAnalysis of variance ppt @ bec doms
Analysis of variance ppt @ bec doms
 
Data Transformation.ppt
Data Transformation.pptData Transformation.ppt
Data Transformation.ppt
 
Analysis of variance anova
Analysis of variance anovaAnalysis of variance anova
Analysis of variance anova
 
ANOVA & EXPERIMENTAL DESIGNS
ANOVA & EXPERIMENTAL DESIGNSANOVA & EXPERIMENTAL DESIGNS
ANOVA & EXPERIMENTAL DESIGNS
 
Test for equal variances
Test for equal variancesTest for equal variances
Test for equal variances
 
Factorial Design
Factorial DesignFactorial Design
Factorial Design
 
Correlation and regression
Correlation and regressionCorrelation and regression
Correlation and regression
 
One way anova final ppt.
One way anova final ppt.One way anova final ppt.
One way anova final ppt.
 
Ch7 Analysis of Variance (ANOVA)
Ch7 Analysis of Variance (ANOVA)Ch7 Analysis of Variance (ANOVA)
Ch7 Analysis of Variance (ANOVA)
 
Two factor factorial_design_pdf
Two factor factorial_design_pdfTwo factor factorial_design_pdf
Two factor factorial_design_pdf
 
The mann whitney u test
The mann whitney u testThe mann whitney u test
The mann whitney u test
 
Pca analysis
Pca analysisPca analysis
Pca analysis
 
Analysis Of Variance - ANOVA
Analysis Of Variance - ANOVAAnalysis Of Variance - ANOVA
Analysis Of Variance - ANOVA
 
Split-plot Designs
Split-plot DesignsSplit-plot Designs
Split-plot Designs
 
Completely randomized design
Completely randomized designCompletely randomized design
Completely randomized design
 
Design of experiments
Design of experiments Design of experiments
Design of experiments
 
Exploratory Factor Analysis
Exploratory Factor AnalysisExploratory Factor Analysis
Exploratory Factor Analysis
 
Analysis of variance (anova)
Analysis of variance (anova)Analysis of variance (anova)
Analysis of variance (anova)
 

Similar to Latin square

One-way ANOVA for Randomized Complete Block Design (RCBD)
One-way ANOVA for Randomized Complete Block Design (RCBD)One-way ANOVA for Randomized Complete Block Design (RCBD)
One-way ANOVA for Randomized Complete Block Design (RCBD)
Siti Nur Adila Hamzah
 
Introduction and crd
Introduction and crdIntroduction and crd
Introduction and crd
Rione Drevale
 
One-way ANOVA for Completely Randomized Design (CRD)
One-way ANOVA for Completely Randomized Design (CRD)One-way ANOVA for Completely Randomized Design (CRD)
One-way ANOVA for Completely Randomized Design (CRD)
Siti Nur Adila Hamzah
 
Tests of statistical significance : chi square and spss
Tests of statistical significance : chi square and spss Tests of statistical significance : chi square and spss
Tests of statistical significance : chi square and spss
Drsnehas2
 
Ch5 Hypothesis Testing
Ch5 Hypothesis TestingCh5 Hypothesis Testing
Ch5 Hypothesis Testing
Farhan Alfin
 
Chapter 5 experimental design for sbh
Chapter 5 experimental design for sbhChapter 5 experimental design for sbh
Chapter 5 experimental design for sbh
Rione Drevale
 
Designing Experiment
Designing ExperimentDesigning Experiment
Designing Experiment
PAUL VICTOR TAMURIA
 
Proportion test using Chi square
Proportion test using Chi squareProportion test using Chi square
Proportion test using Chi square
Parag Shah
 
Analysis of UA Metabolites in Urine by HPLC
Analysis of UA Metabolites in Urine by HPLCAnalysis of UA Metabolites in Urine by HPLC
Analysis of UA Metabolites in Urine by HPLC
Brittany B. Sanchez
 
Test hypothesis
Test hypothesisTest hypothesis
Test hypothesis
Homework Guru
 
Food Analysis Introduction, Properties and characterization
Food Analysis Introduction, Properties and characterizationFood Analysis Introduction, Properties and characterization
Food Analysis Introduction, Properties and characterization
Bharathi59577
 
Development of Tripe Snack and sensory evaluation by Kano Model.
Development of Tripe Snack and sensory evaluation  by Kano Model.Development of Tripe Snack and sensory evaluation  by Kano Model.
Development of Tripe Snack and sensory evaluation by Kano Model.
Dawa Rayamajhi Sherpa
 
Principles of experimental design
Principles of experimental designPrinciples of experimental design
Principles of experimental design
Farhan Alfin
 
Kamrul Presentation ICAC 2014.pptx
Kamrul Presentation ICAC 2014.pptxKamrul Presentation ICAC 2014.pptx
Kamrul Presentation ICAC 2014.pptx
DrGhorbanAliRoshani
 
Research methodology presentation.
Research methodology presentation.Research methodology presentation.
Research methodology presentation.
abhishek kumar
 

Similar to Latin square (15)

One-way ANOVA for Randomized Complete Block Design (RCBD)
One-way ANOVA for Randomized Complete Block Design (RCBD)One-way ANOVA for Randomized Complete Block Design (RCBD)
One-way ANOVA for Randomized Complete Block Design (RCBD)
 
Introduction and crd
Introduction and crdIntroduction and crd
Introduction and crd
 
One-way ANOVA for Completely Randomized Design (CRD)
One-way ANOVA for Completely Randomized Design (CRD)One-way ANOVA for Completely Randomized Design (CRD)
One-way ANOVA for Completely Randomized Design (CRD)
 
Tests of statistical significance : chi square and spss
Tests of statistical significance : chi square and spss Tests of statistical significance : chi square and spss
Tests of statistical significance : chi square and spss
 
Ch5 Hypothesis Testing
Ch5 Hypothesis TestingCh5 Hypothesis Testing
Ch5 Hypothesis Testing
 
Chapter 5 experimental design for sbh
Chapter 5 experimental design for sbhChapter 5 experimental design for sbh
Chapter 5 experimental design for sbh
 
Designing Experiment
Designing ExperimentDesigning Experiment
Designing Experiment
 
Proportion test using Chi square
Proportion test using Chi squareProportion test using Chi square
Proportion test using Chi square
 
Analysis of UA Metabolites in Urine by HPLC
Analysis of UA Metabolites in Urine by HPLCAnalysis of UA Metabolites in Urine by HPLC
Analysis of UA Metabolites in Urine by HPLC
 
Test hypothesis
Test hypothesisTest hypothesis
Test hypothesis
 
Food Analysis Introduction, Properties and characterization
Food Analysis Introduction, Properties and characterizationFood Analysis Introduction, Properties and characterization
Food Analysis Introduction, Properties and characterization
 
Development of Tripe Snack and sensory evaluation by Kano Model.
Development of Tripe Snack and sensory evaluation  by Kano Model.Development of Tripe Snack and sensory evaluation  by Kano Model.
Development of Tripe Snack and sensory evaluation by Kano Model.
 
Principles of experimental design
Principles of experimental designPrinciples of experimental design
Principles of experimental design
 
Kamrul Presentation ICAC 2014.pptx
Kamrul Presentation ICAC 2014.pptxKamrul Presentation ICAC 2014.pptx
Kamrul Presentation ICAC 2014.pptx
 
Research methodology presentation.
Research methodology presentation.Research methodology presentation.
Research methodology presentation.
 

Recently uploaded

BÀI TẬP BỔ TRỢ TIẾNG ANH 8 CẢ NĂM - GLOBAL SUCCESS - NĂM HỌC 2023-2024 (CÓ FI...
BÀI TẬP BỔ TRỢ TIẾNG ANH 8 CẢ NĂM - GLOBAL SUCCESS - NĂM HỌC 2023-2024 (CÓ FI...BÀI TẬP BỔ TRỢ TIẾNG ANH 8 CẢ NĂM - GLOBAL SUCCESS - NĂM HỌC 2023-2024 (CÓ FI...
BÀI TẬP BỔ TRỢ TIẾNG ANH 8 CẢ NĂM - GLOBAL SUCCESS - NĂM HỌC 2023-2024 (CÓ FI...
Nguyen Thanh Tu Collection
 
Digital Artifact 1 - 10VCD Environments Unit
Digital Artifact 1 - 10VCD Environments UnitDigital Artifact 1 - 10VCD Environments Unit
Digital Artifact 1 - 10VCD Environments Unit
chanes7
 
PIMS Job Advertisement 2024.pdf Islamabad
PIMS Job Advertisement 2024.pdf IslamabadPIMS Job Advertisement 2024.pdf Islamabad
PIMS Job Advertisement 2024.pdf Islamabad
AyyanKhan40
 
PCOS corelations and management through Ayurveda.
PCOS corelations and management through Ayurveda.PCOS corelations and management through Ayurveda.
PCOS corelations and management through Ayurveda.
Dr. Shivangi Singh Parihar
 
Your Skill Boost Masterclass: Strategies for Effective Upskilling
Your Skill Boost Masterclass: Strategies for Effective UpskillingYour Skill Boost Masterclass: Strategies for Effective Upskilling
Your Skill Boost Masterclass: Strategies for Effective Upskilling
Excellence Foundation for South Sudan
 
Liberal Approach to the Study of Indian Politics.pdf
Liberal Approach to the Study of Indian Politics.pdfLiberal Approach to the Study of Indian Politics.pdf
Liberal Approach to the Study of Indian Politics.pdf
WaniBasim
 
DRUGS AND ITS classification slide share
DRUGS AND ITS classification slide shareDRUGS AND ITS classification slide share
DRUGS AND ITS classification slide share
taiba qazi
 
Top five deadliest dog breeds in America
Top five deadliest dog breeds in AmericaTop five deadliest dog breeds in America
Top five deadliest dog breeds in America
Bisnar Chase Personal Injury Attorneys
 
World environment day ppt For 5 June 2024
World environment day ppt For 5 June 2024World environment day ppt For 5 June 2024
World environment day ppt For 5 June 2024
ak6969907
 
Film vocab for eal 3 students: Australia the movie
Film vocab for eal 3 students: Australia the movieFilm vocab for eal 3 students: Australia the movie
Film vocab for eal 3 students: Australia the movie
Nicholas Montgomery
 
A Independência da América Espanhola LAPBOOK.pdf
A Independência da América Espanhola LAPBOOK.pdfA Independência da América Espanhola LAPBOOK.pdf
A Independência da América Espanhola LAPBOOK.pdf
Jean Carlos Nunes Paixão
 
Lapbook sobre os Regimes Totalitários.pdf
Lapbook sobre os Regimes Totalitários.pdfLapbook sobre os Regimes Totalitários.pdf
Lapbook sobre os Regimes Totalitários.pdf
Jean Carlos Nunes Paixão
 
ANATOMY AND BIOMECHANICS OF HIP JOINT.pdf
ANATOMY AND BIOMECHANICS OF HIP JOINT.pdfANATOMY AND BIOMECHANICS OF HIP JOINT.pdf
ANATOMY AND BIOMECHANICS OF HIP JOINT.pdf
Priyankaranawat4
 
How to Add Chatter in the odoo 17 ERP Module
How to Add Chatter in the odoo 17 ERP ModuleHow to Add Chatter in the odoo 17 ERP Module
How to Add Chatter in the odoo 17 ERP Module
Celine George
 
clinical examination of hip joint (1).pdf
clinical examination of hip joint (1).pdfclinical examination of hip joint (1).pdf
clinical examination of hip joint (1).pdf
Priyankaranawat4
 
Pollock and Snow "DEIA in the Scholarly Landscape, Session One: Setting Expec...
Pollock and Snow "DEIA in the Scholarly Landscape, Session One: Setting Expec...Pollock and Snow "DEIA in the Scholarly Landscape, Session One: Setting Expec...
Pollock and Snow "DEIA in the Scholarly Landscape, Session One: Setting Expec...
National Information Standards Organization (NISO)
 
Chapter 4 - Islamic Financial Institutions in Malaysia.pptx
Chapter 4 - Islamic Financial Institutions in Malaysia.pptxChapter 4 - Islamic Financial Institutions in Malaysia.pptx
Chapter 4 - Islamic Financial Institutions in Malaysia.pptx
Mohd Adib Abd Muin, Senior Lecturer at Universiti Utara Malaysia
 
বাংলাদেশ অর্থনৈতিক সমীক্ষা (Economic Review) ২০২৪ UJS App.pdf
বাংলাদেশ অর্থনৈতিক সমীক্ষা (Economic Review) ২০২৪ UJS App.pdfবাংলাদেশ অর্থনৈতিক সমীক্ষা (Economic Review) ২০২৪ UJS App.pdf
বাংলাদেশ অর্থনৈতিক সমীক্ষা (Economic Review) ২০২৪ UJS App.pdf
eBook.com.bd (প্রয়োজনীয় বাংলা বই)
 
South African Journal of Science: Writing with integrity workshop (2024)
South African Journal of Science: Writing with integrity workshop (2024)South African Journal of Science: Writing with integrity workshop (2024)
South African Journal of Science: Writing with integrity workshop (2024)
Academy of Science of South Africa
 
Assessment and Planning in Educational technology.pptx
Assessment and Planning in Educational technology.pptxAssessment and Planning in Educational technology.pptx
Assessment and Planning in Educational technology.pptx
Kavitha Krishnan
 

Recently uploaded (20)

BÀI TẬP BỔ TRỢ TIẾNG ANH 8 CẢ NĂM - GLOBAL SUCCESS - NĂM HỌC 2023-2024 (CÓ FI...
BÀI TẬP BỔ TRỢ TIẾNG ANH 8 CẢ NĂM - GLOBAL SUCCESS - NĂM HỌC 2023-2024 (CÓ FI...BÀI TẬP BỔ TRỢ TIẾNG ANH 8 CẢ NĂM - GLOBAL SUCCESS - NĂM HỌC 2023-2024 (CÓ FI...
BÀI TẬP BỔ TRỢ TIẾNG ANH 8 CẢ NĂM - GLOBAL SUCCESS - NĂM HỌC 2023-2024 (CÓ FI...
 
Digital Artifact 1 - 10VCD Environments Unit
Digital Artifact 1 - 10VCD Environments UnitDigital Artifact 1 - 10VCD Environments Unit
Digital Artifact 1 - 10VCD Environments Unit
 
PIMS Job Advertisement 2024.pdf Islamabad
PIMS Job Advertisement 2024.pdf IslamabadPIMS Job Advertisement 2024.pdf Islamabad
PIMS Job Advertisement 2024.pdf Islamabad
 
PCOS corelations and management through Ayurveda.
PCOS corelations and management through Ayurveda.PCOS corelations and management through Ayurveda.
PCOS corelations and management through Ayurveda.
 
Your Skill Boost Masterclass: Strategies for Effective Upskilling
Your Skill Boost Masterclass: Strategies for Effective UpskillingYour Skill Boost Masterclass: Strategies for Effective Upskilling
Your Skill Boost Masterclass: Strategies for Effective Upskilling
 
Liberal Approach to the Study of Indian Politics.pdf
Liberal Approach to the Study of Indian Politics.pdfLiberal Approach to the Study of Indian Politics.pdf
Liberal Approach to the Study of Indian Politics.pdf
 
DRUGS AND ITS classification slide share
DRUGS AND ITS classification slide shareDRUGS AND ITS classification slide share
DRUGS AND ITS classification slide share
 
Top five deadliest dog breeds in America
Top five deadliest dog breeds in AmericaTop five deadliest dog breeds in America
Top five deadliest dog breeds in America
 
World environment day ppt For 5 June 2024
World environment day ppt For 5 June 2024World environment day ppt For 5 June 2024
World environment day ppt For 5 June 2024
 
Film vocab for eal 3 students: Australia the movie
Film vocab for eal 3 students: Australia the movieFilm vocab for eal 3 students: Australia the movie
Film vocab for eal 3 students: Australia the movie
 
A Independência da América Espanhola LAPBOOK.pdf
A Independência da América Espanhola LAPBOOK.pdfA Independência da América Espanhola LAPBOOK.pdf
A Independência da América Espanhola LAPBOOK.pdf
 
Lapbook sobre os Regimes Totalitários.pdf
Lapbook sobre os Regimes Totalitários.pdfLapbook sobre os Regimes Totalitários.pdf
Lapbook sobre os Regimes Totalitários.pdf
 
ANATOMY AND BIOMECHANICS OF HIP JOINT.pdf
ANATOMY AND BIOMECHANICS OF HIP JOINT.pdfANATOMY AND BIOMECHANICS OF HIP JOINT.pdf
ANATOMY AND BIOMECHANICS OF HIP JOINT.pdf
 
How to Add Chatter in the odoo 17 ERP Module
How to Add Chatter in the odoo 17 ERP ModuleHow to Add Chatter in the odoo 17 ERP Module
How to Add Chatter in the odoo 17 ERP Module
 
clinical examination of hip joint (1).pdf
clinical examination of hip joint (1).pdfclinical examination of hip joint (1).pdf
clinical examination of hip joint (1).pdf
 
Pollock and Snow "DEIA in the Scholarly Landscape, Session One: Setting Expec...
Pollock and Snow "DEIA in the Scholarly Landscape, Session One: Setting Expec...Pollock and Snow "DEIA in the Scholarly Landscape, Session One: Setting Expec...
Pollock and Snow "DEIA in the Scholarly Landscape, Session One: Setting Expec...
 
Chapter 4 - Islamic Financial Institutions in Malaysia.pptx
Chapter 4 - Islamic Financial Institutions in Malaysia.pptxChapter 4 - Islamic Financial Institutions in Malaysia.pptx
Chapter 4 - Islamic Financial Institutions in Malaysia.pptx
 
বাংলাদেশ অর্থনৈতিক সমীক্ষা (Economic Review) ২০২৪ UJS App.pdf
বাংলাদেশ অর্থনৈতিক সমীক্ষা (Economic Review) ২০২৪ UJS App.pdfবাংলাদেশ অর্থনৈতিক সমীক্ষা (Economic Review) ২০২৪ UJS App.pdf
বাংলাদেশ অর্থনৈতিক সমীক্ষা (Economic Review) ২০২৪ UJS App.pdf
 
South African Journal of Science: Writing with integrity workshop (2024)
South African Journal of Science: Writing with integrity workshop (2024)South African Journal of Science: Writing with integrity workshop (2024)
South African Journal of Science: Writing with integrity workshop (2024)
 
Assessment and Planning in Educational technology.pptx
Assessment and Planning in Educational technology.pptxAssessment and Planning in Educational technology.pptx
Assessment and Planning in Educational technology.pptx
 

Latin square

  • 1. Analysis of Variance (ANOVA) Latin Square Design (LS) Group 5  SITI NORHAJAR BINTI ZAKARIA UK 28316  TENGKU MURIANA BINTI TENGKU AZMAN UK 28331  SITI NUR ADILA BINTI HAMZAH UK 28361  MOHD SADDAM BIN ZAINUDIN UK 28366  ASMIZA BINTI ABDULLAH UK 28373  NOR ATIQAH BINTI LOKMAN UK 28376  NURFATANAZIRAH BINTI SAAD UK 28377  FARAH NABILA BINTI ALI UK 28380
  • 2. Content List of Presentation 1) The research Problem 2) Treatments and Explanations 3) Field Layout of Experimental Designs 4) Step-by-step Procedures of Experimental Designs 5) ANOVA Table 6) Hypothesis Testing (Null Hypothesis) 7) Conclusions of Hypothesis Testing 8) Post Hoc Test (i.e. Turkey Test) 9) Result & Discussion (Give some logical Reasons) 10) Summary 11) Recommendations
  • 3. RESEARCH PROBLEM A Latin square experiment is conducted to compare six composition of feed for producing honey. The feed composition (A, B, C, D and E) will be with normal composition (F). The experiment units are bees and the bee types will be used as columns and the way how to feed the bees (methods) was used as rows. One of the measured parameter is honey gain due to feed. Using P=0.01 and P=0.05 as the level of significance, the null hypothesis is stating that the feeds have no different effects on honey gain. The data (honey gain in ml/plot) are given as follow: Table 5. Amount of honey production (ml/plot) Methods (Rows) Bee types (columns) B1 B2 B3 B4 B5 B6 M1 62 (A) 84 (B) 62 (C) 66 (D) 73 (E) 105 (F) M2 86 (B) 92 (F) 69 (D) 65 (C) 81 (A) 84 (E) M3 64 (C) 71 (D) 70 (E) 90 (F) 101 (B) 93 (A) M4 69 (D) 77 (A) 97 (F) 72 (E) 82 (C) 115 (B) M5 74 (E) 73 (C) 79 (A) 102 (B) 112 (F) 95 (D) M6 102 (F) 84 (E) 111 (B) 88 (A) 94 (D) 104 (C)
  • 4. LAYOUT OF LATIN AQUARE DESIGN A B C D E F B C D E F A D C F E D E F B A A B E C F A B C D F A B C D E Bee types (Column) Method (row)
  • 6. SELECT ANALYZE -> GENERAL LINEAR MODEL -> UNIVARIATE
  • 7. SELECT THE DEPENDENT VARIABLE AND THREE FACTORS –ROWS, COLUMNS, TREATMENTS SELECT MODEL
  • 8. IDENTIFY A MODEL THAT HAS ONLY MAIN EFFECTS FOR ROWS, COLUMNS, TREATMENTS
  • 9. THE ANOVA TABLE PRODUCED BY SPSS
  • 10. Hypothesis Testing (Null Hypothesis) From the table is obtained sig of method, bee types and treatment. Method : sig.= 0.000 Bee types : sig = 0.000 Treatment : sig. = 0.000 Significance level = 0.01 for method, bee types and treatment.
  • 11. HYPOTHESIS FOR METHODS H0: there are no significantly different among any of the methods (µ1 = µ2 = ….. = µn) H1: at least , one method is significantly different from the others  If the significance obtained > 0.01 , H0 is received  If the significance obtained < 0.01, H0 is rejected For methods: sig = 0.000 That means: 0.000 < 0.01, so H0 is rejected (H1 is received). In other word: at least , one method is very significantly different from the others. Its means that at least, there is one method which can affect to the honey production.
  • 12. HYPOTHESIS FOR BEE TYPES H0: there are no significantly different among any of the bee types (µ1 = µ2 = ….. = µn) H1: at least , one bee type is significantly different from the others  If the significance obtained > 0.01 , H0 is received  If the significance obtained < 0.01, H0 is rejected For bee types: sig = 0.000 That means: 0.000 < 0.01, so H0 is rejected (H1 is received). In other word: at least , one bee types is very significantly different from the others. Its means that at least, there is one bee types which can affect to the honey production.
  • 13. HYPOTHESIS FOR TREATMENTS H0: there are no significantly different among any of the treatment (µ1 = µ2 = ….. = µn) H1: at least , one treatment is significantly different from the others  If the significance obtained > 0.01, H0 is received  If the significance obtained < 0.01, H0 is rejected For fishermen: sig = 0.000 That means: 0.000 < 0.01, so H0 is rejected (H1 is received). In other word: at least , one treatment is very significantly different from the others. Its means that at least, there is one treatment which can affect to the honey production.
  • 14. CONCLUSION FOR HYPOTHESIS TESTING • The increasing amount of honey production is caused by different use of method, bee types and treatment. • Different use of method, bee types and treatment did influence the increasing amount of honey production. • It can be conclude that different method, bee types and treatment can affect the production of honey.
  • 15. POST HOC TEST OPTION BUTTON
  • 16. POST HOC TEST FOR METHODS
  • 18. Method Mean 1 75.33±16.753a 2 79.50±10.407b 3 81.50±15.057bc 4 85.33±17.558cd 5 89.17±16.216d 6 97.17±10.284e Means with the same superscript within the each column are not significantly different at 1% level (p<0.01) Different methods for gaining honey production
  • 19. Analysis for Method • From the Post Hoc table, all method except method 3-4 and 4-5 have sig < 0.01, that means that they have very significant different to the honey production. • From the Post Hoc table obtained, for sig values 0.016 (sig > 0.01) for method 3-4 and 4-5 and sig values 0.419 (sig > 0.01) for method 2-3 have no significantly different effect to the production of honey.
  • 20. POST HOC TEST FOR BEE TYPES
  • 22. Bee types Mean 1 76.17±15.289a 2 80.17±7.935ab 4 80.50±15.043b 3 81.33±18.896b 5 90.50±14.516c 6 99.33±10.893d Means with the same superscript within the each column are not significantly different at 1% level (p<0.01) Different Bee types for gaining honey production
  • 23. Analysis of Post Hoc Test for Bee Types • From the Post Hoc table, all bee types except bee types 2-3, 2-4 and 4-3 have sig < 0.01, that means that they have very significant different to the honey production. • From the Post Hoc table obtained, for sig values (sig > 0.01), that means bee types 2-3, 2-4 and 4-3 have no significantly different effect to the production of honey.
  • 24. POST HOC TEST FOR TREATMENT
  • 26. Treatments Mean C 75.00±16.025a E 76.17±6.210ab D 77.33±13.397ab A 80.00±10.658b F 99.67±8.311c B 99.83±12.671c Means with the same superscript within the each column are not significantly different at 1% level (p<0.01) Different treatments for gaining honey production
  • 27. Analysis of Post Hoc Test for Treatment • From the Post Hoc table, all treatment except treatment A-E, A-C, A-D, B-F, C-D, C-E, and D-E have sig < 0.01, that means that they have very significant different to the honey production. • From the Post Hoc table obtained, for sig values 0.016 (sig > 0.01), that means treatment A-E have no significantly different effect to the production of honey. Meanwhile, for treatment A-C, A-D, B- F, C-D, C-E and D-E have sig > 0.01, that means these treatments have no significantly different effect to the honey production.
  • 28. Result and Discussion • Based on post hoc table, we can conclude that the most effective method, bee types and treatment that give higher production of honey are method 6, bee types 6 and treatment B. • Method 6 is most effective because the method used is more convenient way to give proper feed amount to the bees and does not disturb the bees during the production of honey. • For bee types 6 , it is the most suitable to increase the production of honey because this type of bees have many breeding or have large in number so they can produce more honey. • Whereas, for treatment B, it is the most effective because the feed composition contain many nutrition value and high quality of feed that can help the bees to produce more honey.
  • 29. Recommendations • Based on our research, we recommend that the farmer should use Method 6, Bee Types 6 and Treatment B to increase the amount of honey production (ml/plot) because Method 6 is more convenient way to give the proper feed amount and Bee types 6 have more breeds or large number compared to the other and treatment B contain much more nutritional value, high quality and have most suitable combination of nutrient supply for production of honey.