
Recommended
Recommended
More Related Content
Similar to X ray diffraction. Materials characterization .pptx
Similar to X ray diffraction. Materials characterization .pptx (20)
Recently uploaded
Recently uploaded (20)
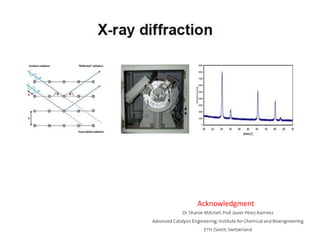
X ray diffraction. Materials characterization .pptx
- 2. X-ray Diffraction • Key crystallographic concepts and basics of diffraction • Practical aspects of XRD • Analysis of XRD diffraction data • In situ studies and complementary techniques • Examples
- 3. Crystallographic concepts The (200) planes of atoms in NaCl The (220) planes of atoms in NaCl
- 4. Molecular structure of crystalline solids LATTICE BASIS A Space LATTICE is an infinite, periodic array of mathematical points, in which each point has identical surroundings to all others. A CRYSTAL STRUCTURE is a periodic arrangement of atoms in the crystal that can be described by a LATTICE + ATOM DECORATION (called a BASIS).
- 5. Rotational symmetry Only 5 rotational symmetries (1, 2, 3, 4, 6) are allowed
- 7. Unit cells and unit cell vectors a b c Lattice parameters axial lengths: a, b, c interaxial angles: a, b, g unit vectors: In general: a ≠ b ≠ c a ≠ b ≠ g All period unit cells may be described via these vectors and angles. a b c
- 8. The 14 Bravais Lattices!
- 9. Crystallographic planes Axis x y z Intercept points 1 ∞ ∞ Reciprocals 1/1 1/∞ 1/∞ Smallest ratio 1 0 0 Miller indices (100) Crystallographic planes are expressed by Miller indices
- 12. Crystallographic concepts How many periodic distances are there within a lattice?
- 13. • A lattice plane is a plane which intersects atoms of a unit cell across the whole three‐dimensional lattice. • There are many ways of constructing lattice planes through a lattice. • The perpendicular separation between each plane is called the d-spacing. How many periodic distances are there within a lattice? Crystallographic concepts
- 14. • Each plane intersects the lattice at a/h, b/k, and c/l. • h, k, and l, are known as the Miller indices (hkl) and are used to identify each lattice plane. How do we describe lattice planes? Crystallographic concepts
- 15. Relationship between d-spacing and lattice constants Cubic: Tetragonal: Orthorhombic: Hexagonal: Rhombohedral: Monoclinic: Triclinic: 2 / 1 2 2 2 2 ) ( 1 l k h a dhkl 2 / 1 2 2 2 2 2 c l a k h dhkl 2 / 1 2 2 2 2 2 2 c l b k a h dhkl
- 16. Crystallographic concepts--Summary • Ordering in materials gives rise to structural periodicity which can be described in terms of translational, rotational and other symmetry relationships. • Crystalline materials composed of “infinite” array of identical lattice points. • The unit cell is the smallest three dimensional box which can be stacked to describe the 3D lattice of a solid. The edges (a, b, and c) and inter‐edge angles (α, β, and g) of the unit cell are known as the lattice parameters of a crystalline solid. • Relationship between unit cell, crystal systems, and Bravais lattices is described. • Lattice planes are two dimensional planes which intersect the three dimensional lattice in a periodic way, with a fixed perpendicular separation known as the d‐spacing. • Miller indices define the orientation of the plane within the unit cell.
- 17. X-ray – a brief history • In 1895 Roentgen discovered X-rays. • Invisible, travels in straight line like visible light • Can penetrate through human body, wood, metal and other opaque objects • In 1912, x-ray diffraction of crystals was discovered • Diffraction can reveal internal structure in the order of 10-10 m (1 Å). • These are electromagnetic radiation with shorter wavelength ( ~0.5 -2.5 Å), for visible light is 6000 Å.
- 18. X-ray generation • Bombard beam of electrons at metal target at high voltage • Ionization of inner shell electrons results in formation of an ‘electron hole’. • Upon relaxation of electrons from upper shells, a energy difference E (≈10‐10 m) = h is released in the form of X‐rays of specific wavelengths. • Most of the kinetic energy of electrons is converted into heat. • Less than 1% transform into x-rays • Commonly used metals are Cu Kα ( = 1.5418 Å) and Mo Kα ( = 0.71073 Å). Two principal methods for X‐ray generation
- 19. Two principal methods for X‐ray generation: 2) Accelerate electrons in a particle accelerator (synchrotron source). Electrons accelerated at relativistic velocities in circular orbits. As velocities approach the speed of light they emit electromagnetic radiation in the X‐ray region. • The X‐rays produced have a range of wavelengths (white radiation or Bremsstrahlung). • Results in high flux of X‐rays. • Laue experiment I Minimum and maximum determined by initial kinetic energy X-ray generation
- 20. X-ray diffraction pattern of a solid
- 21. Applications of XRD • Phase determination: qualitative – Identification of crystalline phases • Quantitative phase analysis – Relative composition of mixed phases • Calculation of lattice parameters – Structural variations under different conditions. • Analysis of crystalline size and strain • Structure solution – Complete structure refinement of unknown phases Crystal structure determines the properties of materials.
- 22. Diffractometer geometries Transmission geometry (Debye‐Scherrer geometry) Best for samples with low absorption. Capillaries can be used as sample holders (measurement of air sensitive samples / suspensions). Reflection geometry (Bragg‐Brentano geometry). Best for strongly absorbing samples. Requires flat sample surface. Easily adapted for in situ investigations.
- 23. XRD data analysis • The intensity of the diffraction signal is usually plotted against the diffraction angle 2θ [°], but d [nm] or 1/d [nm‐1] may also be used. • A 2θ plot is pointless if the wavelength used is not stated because the diffraction angle for a given d‐spacing is dependent on the wavelength. The most common wavelength used in PXRD is 1.54 Å (Cu Kα). • The “signals” in a diffractogram are called (Bragg or diffraction) peaks, lines, or reflections. How do we present X‐ray diffraction data?
- 25. Bragg’s law • In materials with a crystalline structure, X‐rays scattered by ordered features will be scattered coherently “in‐phase” in certain directions meeting the criteria for constructive interference: signal amplification. • The conditions required for constructive interference are determined by Bragg’s law. integer plane lattice with incidence of angle planes lattice between distance ngth ray wavele - X where sin 2 n d d n Bragg’s Law:
- 26. When will diffraction occur? • The periodic lattice found in crystalline structures may act as a diffraction grating for wave particles or electromagnetic radiation with wavelengths of a similar order of magnitude (10‐10m / 1 Å). • For solids there are three particles/waves with wavelengths equivalent to interatomic distances and hence which will interact with a specimen as they pass through it: X‐rays, electrons, and neutrons.
- 27. What type of materials can we study? • Gas: No structural order – see nothing. • Liquid/Amorphous solids: Order over a few angstroms – broad diffraction peaks • Ordered solids: Extensive structural order – sharp diffraction peaks. • Large crystal required. • Crystal orientation known. • Each lattice plane only present in one orientation. • No overlap of reflections. • Reflection intensities may be accurately measured. •Most common in heterogeneous catalysis •Assume all crystal orientations present. • Each lattice plane present at all orientations. •Many overlapping peaks. •Reflection intensities difficult to determine. Single crystals Polycrystalline powders
- 28. What determines the intensity of the diffraction peak? • X‐rays scattered by electrons • Greater the atomic number, Z, the higher the scattering factor (structure factor) of a given element (directly proportional). • Intensity proportional to sum of the scattering factors of atoms in a given lattice plane. • For Powder samples all planes with equivalent d‐spacing overlap. • Intensity dependent on number of overlapping planes. Electron density Multiplicity 2 F I
- 29. How can we satisfy the Bragg equation? • Vary θ • Bragg condition met once at a time. • With a fixed wavelength (laboratory source) data is collected as a function of increasing diffraction angle up to a given value of d (resolution dependent). Bragg’s Law: =2dsinθ To observe diffraction from a given lattice plane, Bragg’s law may be satisfied by varying either the wavelength, , or the Bragg angle, θ. • Vary • Bragg condition met many times simultaneously. • Faster but greater complexity in data analysis. • Requires synchrotron which is expensive. Laue diffraction Monochromatic diffraction:
- 31. Indexing a diffraction pattern of a cubic crystal • For cubic material, interplanar spacing is given as • Recall Bragg’s law: • Combining eq (1) & (2) • , a are constants, hence 2/4a2 is const. • sin2θ is proportional to h2+k2+l2, i.e., planes with higher Miller indices will diffract at higher θ. ) 1 ( 1 2 2 2 2 2 a l k h d (2) 4 sin or sin 4 sin 2 2 2 2 2 2 2 d d d n ) ( 4 sin 2 2 2 2 2 2 l k h a
- 32. Indexing • In cubic systems, the 1st peak in the XRD pattern will be due to diffraction from planes with the lowest miller indices • For the close packed planes – Simple cubic, (001), h2+k2+l2 =1 – BCC, (110), h2+k2+l2 = 2 – FCC, (111), h2+k2+l2 = 3 • Allowed reflection for cubic lattices – Primitive, h2+k2+l2 = 1,2,3,4,5,6,8,9,10,11,12,13, 14,16… – Body centered, h2+k2+l2 = 2,4,6,8,10,12,14,16… – Face centered, h2+k2+l2 = 3,4,8,11,12,16,19,20,24,27,32… – Diamond cubic, h2+k2+l2 = 3,8,11,16,19,24,27,32… Allowed diffraction: FCC: hkl all odd or all even BCC: h+k+l = even
- 33. Calculation of lattice parameter
- 34. Steps Step 1 : Identify the peaks and their proper 2θ values Step 2: Determine sin2θ
- 35. Step 3: Calculate the ratio sin2θ/ sin2θmin and multiply by the appropriate integers. Step 4: Select the result from (3) that yields h2 + k2 + l2 as a series of integers.
- 36. Step 5: Compare results with the sequences of h2 + k2 + l2 values to identify the Bravais lattice Step 6: Calculate lattice parameters
- 37. Phase determination (Qualitative) • The matching process: Search - Match : Manual or automated. • Generally, all expected reflections should be seen in the diffractogram, otherwise it is not a valid match. • Low signal to noise ratio will give weak reflections, not visible. • If measured pattern contains more reflections than the reference, more than one phase is present. • So keep the reference pattern, continue searching for references to explain the additional peaks. • Proceed until all peaks are accounted for. • Deviations in peak positions may be due to – Thermal expansion – Isostructural phase – Presence of substitutional atom – Impurities of similar Z but different atomic size
- 40. Quantitative phase analysis • Determining the relative proportions of crystalline phases present in unknown sample. • Ratio of peak intensities varies linearly as a function of weight fraction for any two phases (A and B) in a mixture. • Data on IA/IB value for all phases and calibration with mixture of known quantities is required. • Determining amorphous content of sample containing crystalline phase A. • Use internal standard of known crystallinity. • Data on appropriate XRD standard B is required. • Known amount of std B is added to specimen containing phase A.
- 41. Analysis of crystallite size and strain Factors determining the peak profile (shape and width): • Imperfections in Experimental setup : – This lead to instrumental broadening, which is due to slit width and goniometer radius, Instrumental broadening is fn of 2θ and is determined by measurement of a suitable reference. • Imperfections in Sample : – This causes sample broadening. – Periodicity in the crystal is not infinite (crystals have finite size), this leads to size broadening. – Lattice imperfections like dislocations, vacancies and substitutional lead to strain broadening. Ideal Real
- 42. Analysis of crystallite size • This related peak width to crystalline domain size. • Crystals are assumed to have uniform size and shape. • Scherrer const K depends on shape and is 0.94 for spherical crystals with cubic symmetry. Size broadening effect translates to crystal size: • Volume averaged crystal thickness , L, depends on crystal shape • For cubic crystallite : L = Lc = crystallite edge length (for reflections of lattice planes parallel to cube) and • For spherical crystallite, L < Lc = crystallite dia • Lvol = 3Lc/4 for all reflections. Scherrer equation Relates peak width to crystalline domain size
- 43. Analysis of microstrain broadening • Lattice strain (microstrain) arises from displacement of the unit cells about their normal position. • Often caused by dislocations, surface restructuring, lattice vacancies, interstitials, substitutionals etc. • Very common in nanocrystalline materials. • Strain is quantified as ε0 = Δd/d , where d is idealized d spacing and Δd the most extreme deviation from d. • The peak broadening due to strain: • Hence, observed peak broadening Bobs is given as: Bobs = Binstr + Bsample = Binstr + Bsize + Bstrain • Instrumental broadening Binstr can be determined experimentally with diffraction of standard or calculated with fundamental parameters. Bsize 1/ cosθ and Bstrain tanθ • Broadening may alter FWHM or integral breadth of the peak. tan 4 Bstrain o
- 44. Peak Position and Width