1. The document provides instructions for students to use a graphing calculator application called Nspire to explore and analyze graphs of quadratic equations.
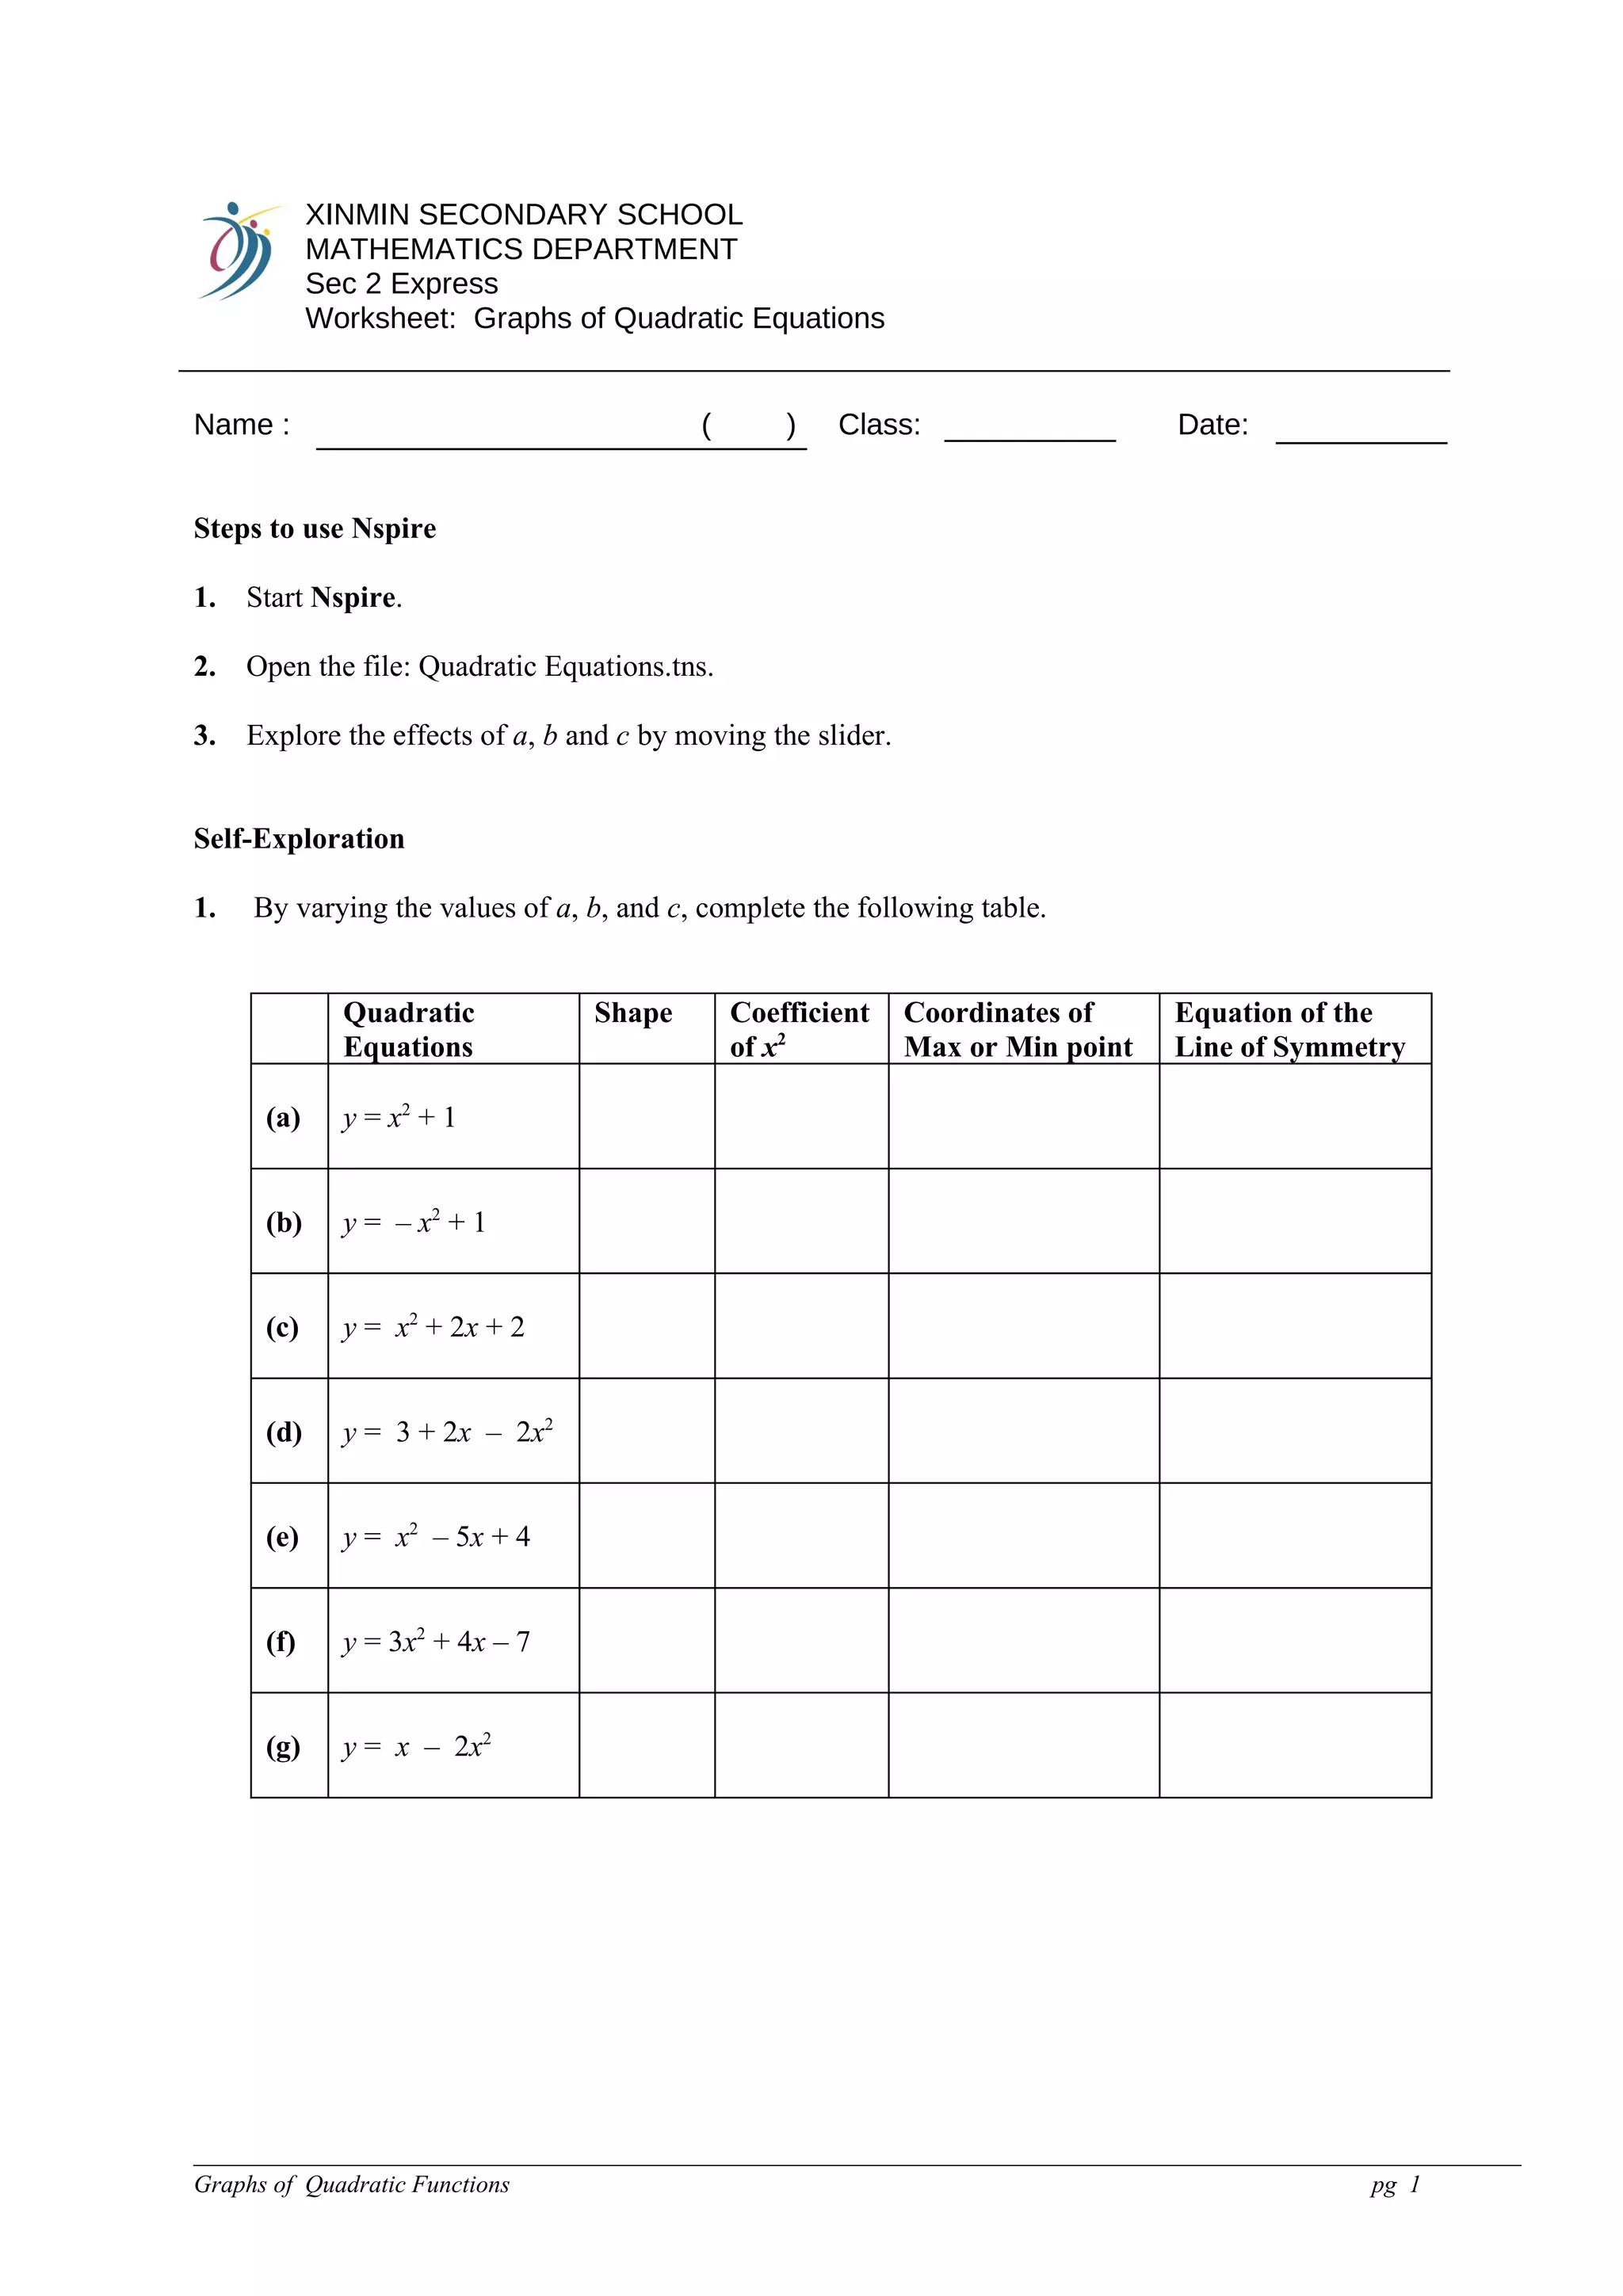
2. Students are asked to vary the values of a, b, and c in different quadratic equations and record the shape of the graph, location of maximum/minimum points, and equation of the line of symmetry.
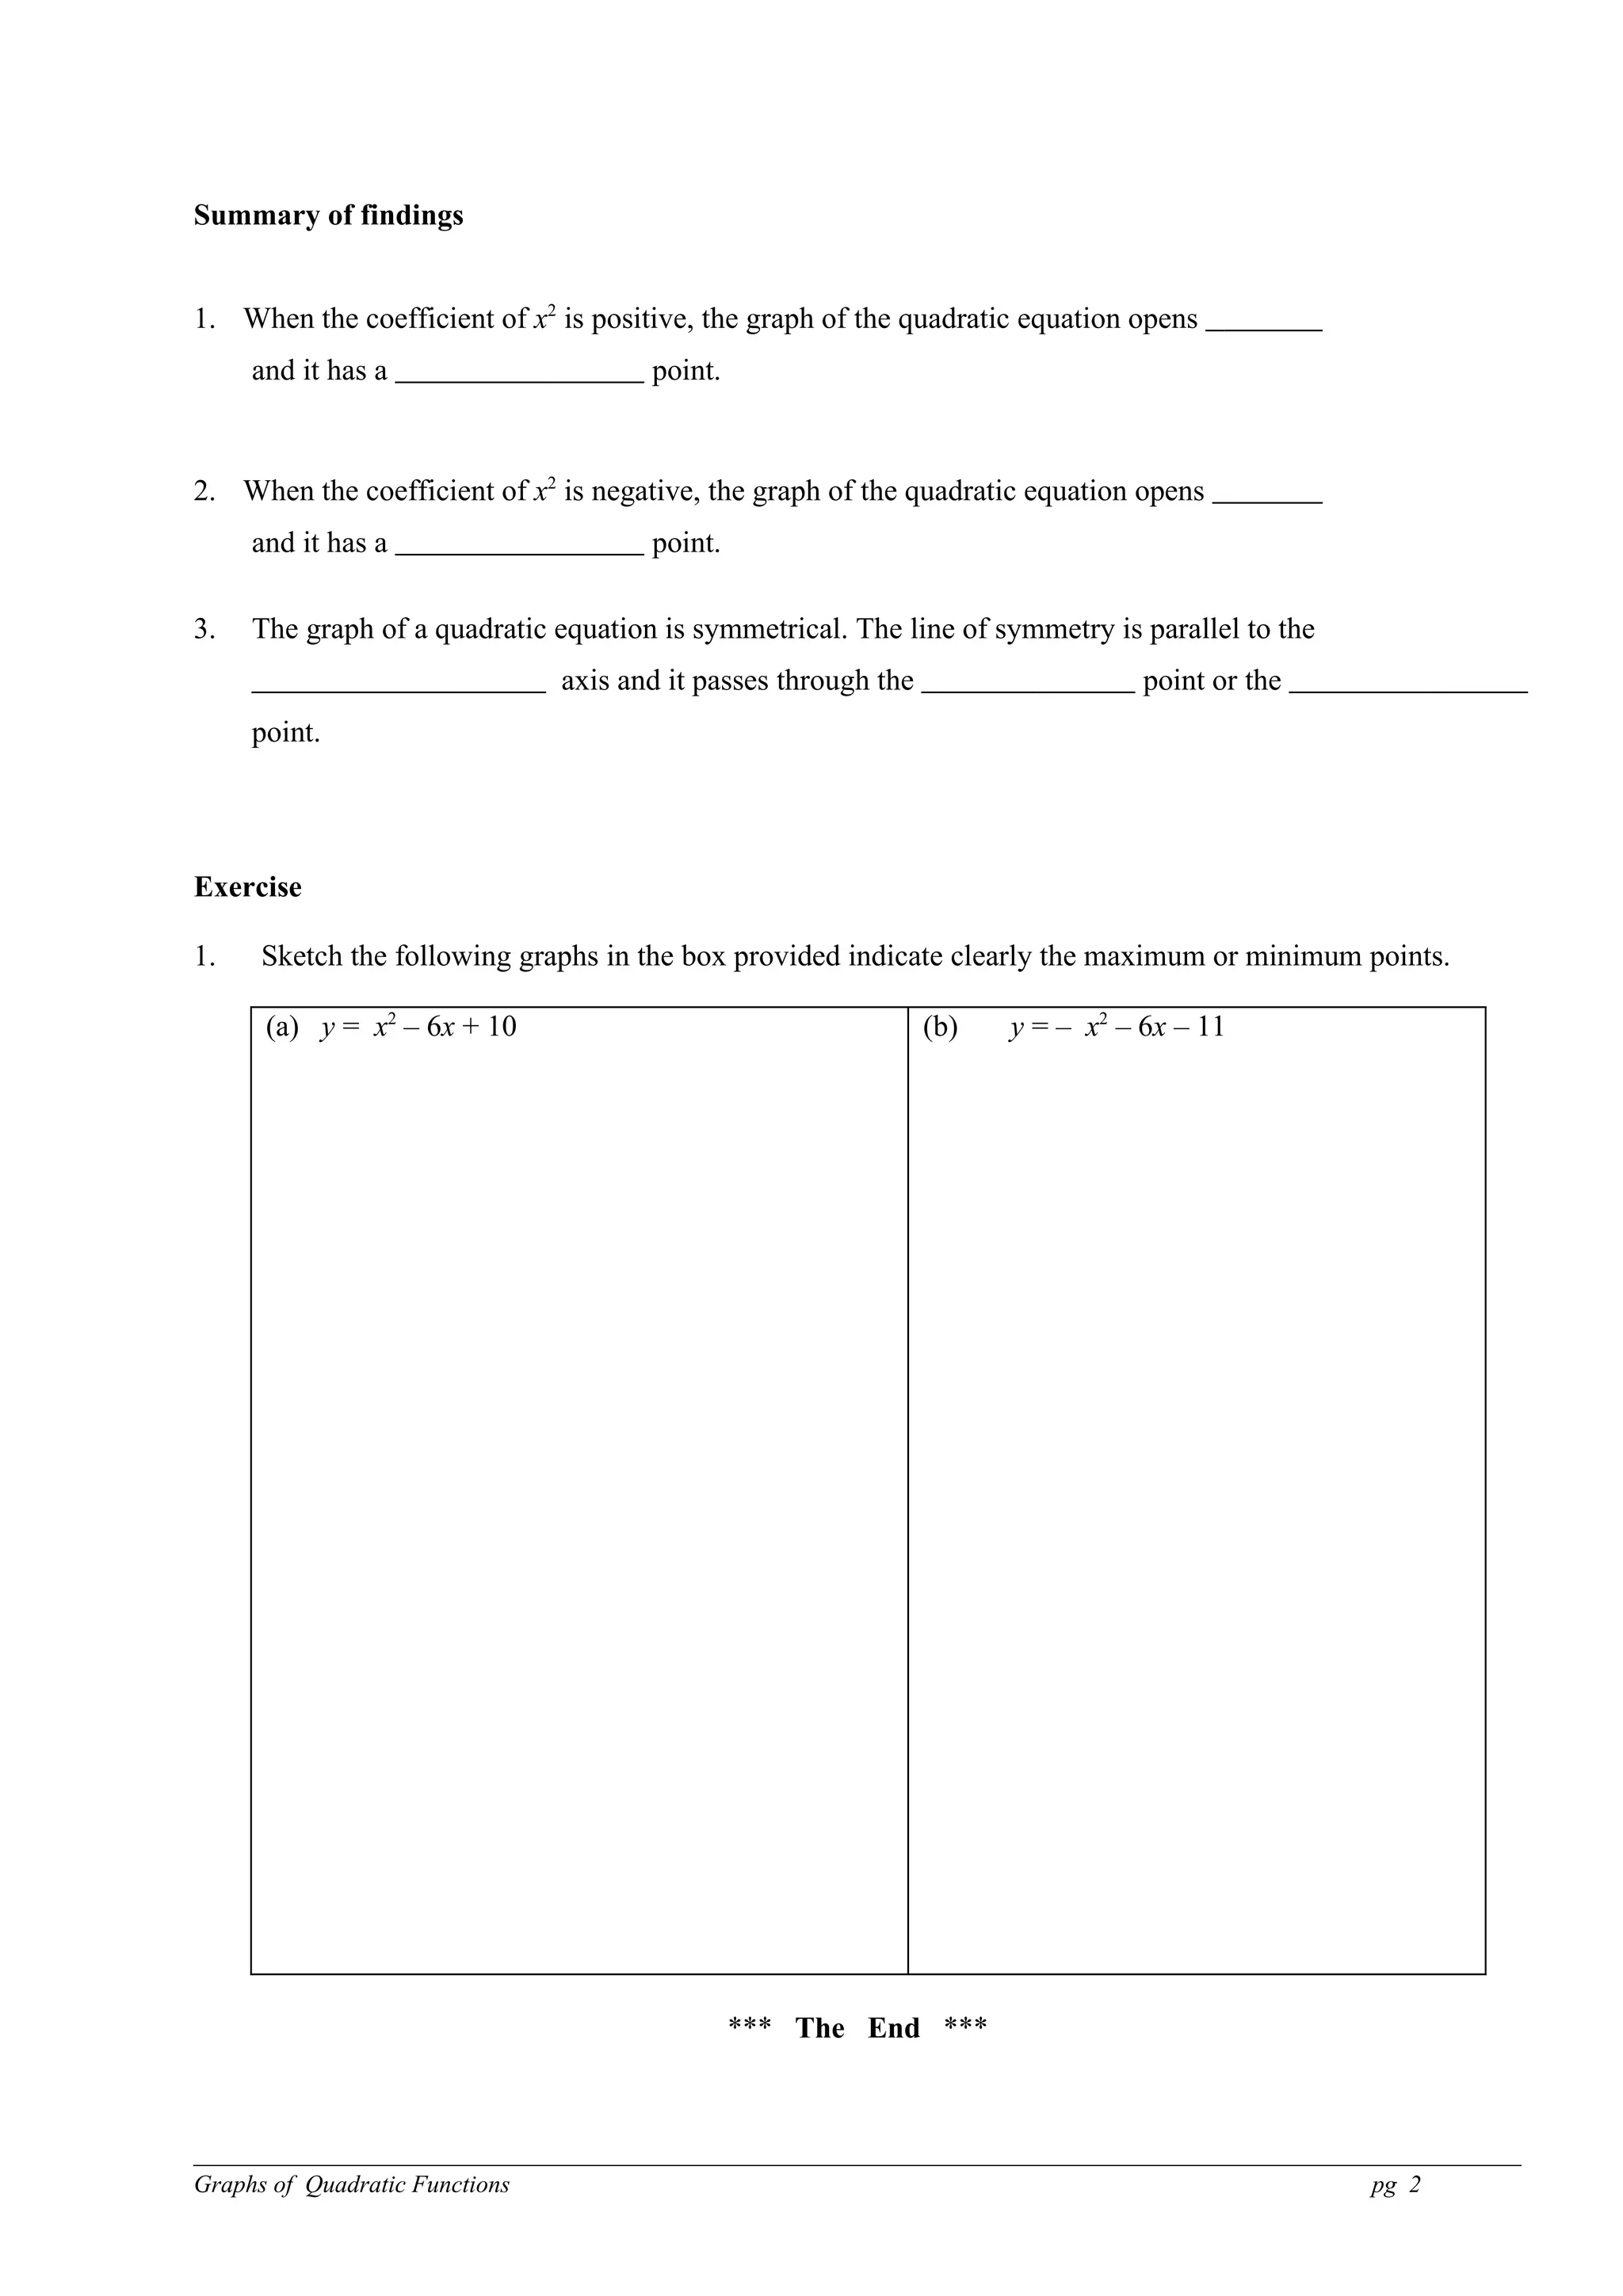
3. The summary explains that graphs of quadratic equations with a positive coefficient of x^2 open up and have a maximum point, while those with a negative coefficient of x^2 open down and have a minimum point. The graph is always symmetrical around the line of symmetry passing through the maximum or minimum point.