Downloaded 5,449 times


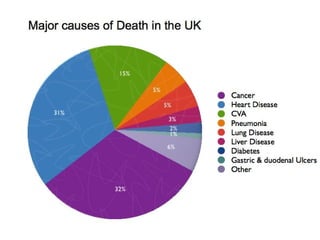


Cancer is caused by abnormal cell growth that spreads uncontrollably. It develops through a complex interaction between genes, environment, and chance. Cancer cells do not die like normal cells and continue growing and dividing in a disorderly fashion. The media needs to accurately report on cancer research studies and not oversimplify results or mislead the public. The UK has higher cancer death rates than some other countries, which may be partly due to lower spending on cancer medications.


