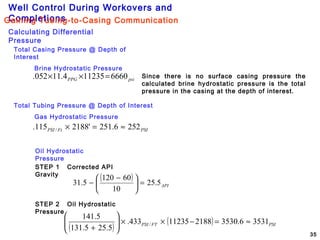
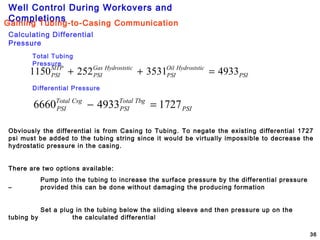
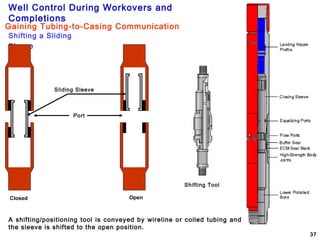
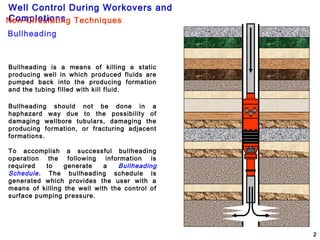
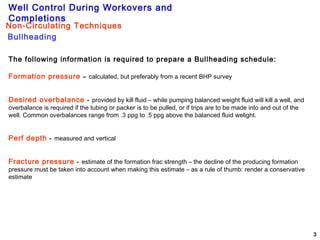
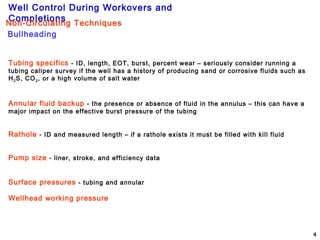
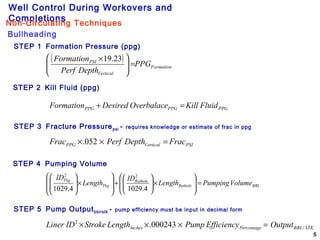
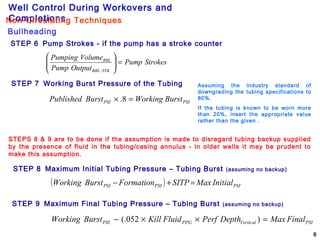
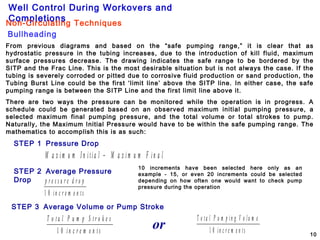
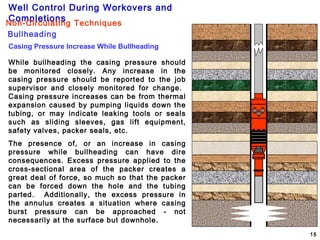
Bullheading is a common non-circulating method for killing live wells prior to workovers. It involves pumping kill fluid into the tubing to displace produced fluids back into the formation. A bullheading schedule is generated using formation pressure, desired overbalance, fracture pressure, tubing specifications, and pump data to safely control pumping pressures within the initial and final maximum pressures. The schedule provides checkpoints to monitor pumping pressure and volume throughout the operation. Special attention should be paid to any increases in casing pressure which could indicate downhole issues.
This is an academic lecture for Diploma in Engineering 7th Semester Mining and Mine Survey Technology. The Course related to this presentation is Well completion and testing
Presentation defines well completion as a sub-discipline of drilling operations. It introduces the various components of the well completion process. It then describes and explains basic areas of the completion process including the bottom-hole completion process, the perforation process, the upper completion with packers, tubing component equipment and devices, tubing configurations, the horizontal completions and the Christmas tree(production head)
Well Control is very important in Petroleum Engineering and necessary for being able to avoid hazards and controlling them as much as possible. This presentation provides valuable notes, instructions, and information about Well Control.
Although there are many types and brand name of liner hanger system, basic of the equipment and operations are same. After get trained from different service provider and conducting many kind of liner hanger operation I was assigned to teach fundamental of liner system to the related engineers within the company.
Linked presentation is from the training session and shares the fundamental knowledge of liner hanger system for interested people.
The presentation highlights the root causes of major drilling issues such as formation pressure uncertainty, subsurface feature like mud volcanoes, major fault, poor well planning & etc. Then it elaborates on consequences of all above on examples of wellbore instability, sticking, gumbo & so on.
This document was produced as part of my final year project of training to obtain a petroleum engineering diploma.
The aim of this project is to make a comparative study between continuous and intermittent gas lift systems based on real data from an oil well in Algeria, and to choose the system best suited to increase the production of the well.
This study was carried out by a manual design using the method of “fixed pressure drop” for the continuous gas lift system and “fallback gradient” method for intermittent gas lift system.
We were able to determine at the end of this study that the system best suited to the current conditions of our well would be the intermittent gas lift system and we also proposed that it should be combine with the "plunger lift " system in order to increase the efficiency of the intermittent gas lift system by eliminating problems linked to the phenomenon of" fallback " thus increase the production of our wells.
Gas Lift Design: Comparative Study of Continuous and Intermittent Gas Lift (C...Nicodeme Feuwo
This document was produced as part of my final year project of training to obtain a petroleum engineering diploma.
The aim of this project is to make a comparative study between continuous and intermittent gas lift systems based on real data from an oil well in Algeria, and to choose the system best suited to increase the production of the well.
This study was carried out by a manual design using the method of “fixed pressure drop” for the continuous gas lift system and “fallback gradient” method for intermittent gas lift system.
We were able to determine at the end of this study that the system best suited to the current conditions of our well would be the intermittent gas lift system and we also proposed that it should be combine with the "plunger lift " system in order to increase the efficiency of the intermittent gas lift system by eliminating problems linked to the phenomenon of" fallback " thus increase the production of our wells.
Surge Pressure Prediction for Running Linerspvisoftware
This white paper will review the engineering analysis behind trip operations for different pipe end conditions. The author will discuss the controlling parameters affecting surge pressure using SurgeMOD. There are 2 aspects of the surge and swab pressure analysis: one is to predict surge and swab pressure for a given running speed (analysis mode), while the other one is to calculate optimal trip speeds at different string depths without breaking down formations or causing a kick at weak zone (design mode). This article will address both issues. Examples of running liners in tight tolerance wellbore will be analyzed.
Production Optimization using nodal analysis. The nodal systems analysis approach is a very flexible method
that can be used to improve the performance of many well
systems. The nodal systems analysis approach may be used to analyze
many producing oil and gas well problems. The procedure can
be applied to both flowing and artificial
Improving Energy Efficiency of Pumps and Fanseecfncci
Pumps and Fans are energy consuming equipment that can be found in almost all Industries. Therefore, it is important to check if they are running efficiently. This presentation give an overview about energy saving opportunities in pump and fan equipment. It was prepared in the context of energy auditor training in Nepal in the context of GIZ/NEEP programme. For further information go to EEC webpage: http://eec-fncci.org/
Energy conservation related to pumps used in thermal power stationsManohar Tatwawadi
The presentation discusses about the conservation of energy in pumps and pumping stations as whole in Thermal Power Stations.The pumps efficiency is also discussed in details, how to calculate and the steps to increase efficiency of pumps as well as pumping stations.
Artificial Lift Whitepaper: Making Your ESP Talk To YouDean Murphy
The subject of this paper is ‘a technique to make your ESP talk to you’; when designing and
operating ESPs the first thing that you need to do is give the ESP a ‘mouth’, then you can attempt to
understand its language and let it talk to you.
Traditionally, the ESP ‘mouth’ was an amp chart and a fluid level shot on the annulus. Interpretation
of the data then told you something about motor load and pump intake pressure. Today’s ESP
technology is such that the prudent operator can obtain ESP operating parameters by using a
downhole sensor. The dilemma when faced with the wealth of data that comes from such a sensor
is ‘which parameters are most important?’. By recognising which variables respond most quickly to a
change in operating conditions, you can give your ESP the ability to talk to you.
The South Caspian Basin has many confirmed structures. It includes the offshore continuation of several major anticline trends extending from onshore side. The Umid Babek structure is one of the deepest structures of the Baku archipelago. It is strongly dislocated tectonically and is complicated by mud diapirism. Interpretation of 2D seismic data made it possible to determine the calculations for the area and depth in the Umid and Babek structures. The structures of Shah Deniz and Umid Babek are similar in terms of the history of their structural growth. Umid-Babek occupies the most advantageous position on the path of fluid migration from deep zones of depression and has favourable conditions for the accumulation and preservation of hydrocarbon deposits. U
RESULTS OF THE APPLICATION OF DIRECT-PROSPECTING TECHNOLOGY OF SATELLITE IMAG...Dr. Arzu Javadova
The results of reconnaissance studies within the Shakal and Halabja exploration blocks in Kurdistan are presented. Experimental studies were carried out using a mobile direct-prospecting technology, including modified methods of frequency-resonance processing and decoding of satellite images and photo images, vertical electric resonance scanning of the cross-section and a method of integral assessment of the oil and gas potential of large prospecting blocks and license areas. At the local survey site within the Shakal block, responses from oil, condensate, phosphorus and limestone were recorded. The lower boundary of the limestones was established at a depth of 4676 m. By scanning the cross-section from 2770 m, step 1 cm, the responses of oil from limestones were obtained from the intervals: 1) 2771-2794 m, 2) 2795.3-2815.45 m, 3) 2834.40-2854 m. During processing the image of the entire Halabja block, signals were recorded at the frequencies of oil, condensate, phosphorus gas, bacteria, sodium chloride and dolomite. At the 57 km hydrocarbon synthesis boundary, responses from oil, condensate and gas were recorded. When scanning the cross-section from 480 m to 4 km, step 50 cm, responses from oil were obtained from two intervals: 1) 1140-1200 m, and 2) 3310-3340 m. Within the local fragment of the block by scanning up to 5 km with a step of 1 m responses of oil from salt were recorded from the intervals: 1) 295-350 m, 2) 1190-1260 m, 3) 2015-2320 m). The response intervals within the 1st and 3rd horizons have been refined by scanning with a step of 5 cm. The results of experimental studies show that practical application of direct-prospecting methods and technologies will accelerate and optimize the exploration process for oil and gas.
The results of the application of mobile direct-prospecting technology of frequency-resonance processing and interpretation of satellite images and photographs at the sites of hydrogen production, drilling wells, as well as within areas of hydrogen degassing in various regions are presented. Experimental reconnaissance studies were carried out to study the features of the deep structure of the hydrogen degassing areas.
The developed mobile and low-cost technology include modified methods of satellite images and photo-images frequency-resonance processing and decoding, vertical electric-resonance scanning of a cross-section, as well as a method of integrated assessment of oil and gas potential of large prospecting blocks and license areas. Separate methods of direct-prospecting technology are based on the principles of the “substance” paradigm of geophysical research, the essence of which is searching for a specific substance - oil, gas, gas condensate, etc.
The materials of instrumental measurements indicate that in regions of basalt volcano's location with roots at different depths, signals at hydrogen frequencies are almost always recorded. When scanning the cross-section, responses from hydrogen are recorded from the upper edges of basaltic volcanoes to their roots. It can be assumed that basaltic volcanoes are a kind of channel through which hydrogen migrates to the upper horizons of the cross-section and further into the atmosphere. Within many basaltic volcanoes at a depth of 68 km, deep (living) water is synthesized. Hydrogen-rich water is curative and can be used for wellness purposes. All surveyed zones of longevity on Earth are located within basalt volcanoes, in which water synthesized at a depth of 68 km migrates to the surface and is used for water supply. Hydrogen deposits can be formed by basaltic volcanoes in adjacent sealed reservoirs. Within some survey areas, responses at hydrogen frequencies from limestones, dolomites, and marls were recorded at shallow depths. Hydrogen deposits formed near basalt volcanoes in different types of reservoirs can be discovered and localized during areal exploration using proven methods. Direct-prospecting technology can also be used to study reservoirs in crystalline rocks (basalts including). Detailed studies and wells drilling in promising areas can be planned and carried out for hydrogen and living water at the same time.
The result of the investigation indicates the advisability of using direct-prospecting methods of frequency-resonance processing of satellite images to detect zones of hydrogen accumulation in areas of basalt volcanoes location, as well as in areas of hydrogen degassing. The use of mobile and low-cost technology will significantly speed up the exploration process for hydrogen, as well as reduce the financial costs for its implementation.
A.J.On ecology issue of South Caspian Lankaran–Talish–Deniz and Khazar areas.pdfDr. Arzu Javadova
The problems deal with the natural conditions, biota and sediments of the South Caspian
within Lankaran–Talish–Deniz and Khazar offshore areas, as well as anthropogenic impact
on the ecological system of this region were discussed.
Taxonomic harmonization of Paratethyan brackish ostracods described by Livent...Dr. Arzu Javadova
Neogene ostracods from Paratethys are, potentially, a powerful biostratigraphic tool to depict the geological history of different basins [Styrian, Vienna, Pannonian, Dacian, Euxinic (former extent of the modern Black Sea basin), and Caspian-Aralic basins]. Yet, most species were described by different authors (Reuss, Méhes, Zalănyi, Livental) in mid-19th and early 20th centuries and, often, descriptions and illustrations are very poor. Very likely, the Neogene Paratethyan biodiversity is overestimated due to lack of literature exchange at time or the undervaluation of ecophenotypical intra-specific variability. As a consequence, often, under different specific (or even generic) names could be hidden the same species. Unfortunately, most of the historical ostracod collection are gone lost or destroyed and the only way to solve this problem is to get new samples from the type localities.
Recently, clays and silts cropping out at Babazanan (Azerbaijan), type locality of the species described by Livental in 1929, were re-sampled, and here we present the results of our taxonomical studies of the collected ostracods providing new definition of the specific characters, mainly based on SEM illustration. An updated synonymy, paleogeographic and stratigraphic distribution starting from the extant literature, will be also provided.
Microfauna of the Miocene Deposits in South Caspian_final versionof PRESENTAT...Dr. Arzu Javadova
Comprehensive geological, geophysical study, and exploration drilling resulted in the vast material that makes it possible to assess microfauna content of South Caspian Basin.
Commercial reservoirs have been established in the Miocene in the South Caspian Basin. The Miocene deposits in South Caspian Basin are of great practical and scientific interest as they underlie the formations of the thick Pliocene Productive series. The core samples taken from exploration wells of the Miocene deposits, where were recovered otholitite, abundant ostracod and foraminifera fauna. The studied sections allowed to define the detailed stratigraphy sequences into individual stratigraphic units: Pontian, Sarmatian, Conkian-Karaganian, Chokrakian, Maikopian deposits
The facies of the Miocene deposits in the South Caspian offshore part of Basin vary considerably and these different facial sedimentary environments affected the microfauna composition as well. This is confirmed by rather abrupt changes in microfauna features from different regions of South Caspian Basin. The Miocene deposits of South Caspian offshore part of basin is rich in microfauna and many of ostracod species here were common in the Tethys and Paratethys bioprovince and is known as brackish and shallow marine genus in the ecology of ostracod assemblages
Javadova Dr.A. Geological and geophysical assessment of the south caspian off...Dr. Arzu Javadova
For the geological and geophysical assessment of the South Caspian offshore Kapaz structure, seismic data were used with the construction of several structural maps. Four seismic horizons have been mapped: the top Pereriva, top Balakhany, top Surakhany suits, and top Akchagyl stage. The results of three wells drilled in the past were analyzed, the well- logs were correlated with neighboring exploration wells.
Interpretation of seismic data shows that the Kapaz structure is located on the border of the sedimentary sources of the paleo Volga and paleo Amudarya. Regional seismic indicates that the paleo Volga probably continued to be the main source of terrigenous deposits. However, the Paleo-Amu Darya became a more important source of sediments during the Apsheron time. This is evidenced by the presence of clinoforms in seismic profiles direction, which is shown from the shelf margin in the dip direction to the west and southwest direction. It is shown that the Paleo-Amu Darya system eventually overlapped and pushed on the margin of the paleo-Volga shelf, effectively sealing the underlying terrigenous reservoir rocks. Growing diapir folds and compartmentation (southern and northern flank) were also observed in the feature of the structure. The reserves' calculation was carried out for each block of the Kapaz structure in scenarios P90, P50 and P10
Results of reconnaissance survey _Profile TESZ-2021_FINAL_short version.pdfDr. Arzu Javadova
The results of a reconnaissance survey of a seismic profile on Ukraine territory are presented. Experimental studies were carried out with the aim of additional approbation of direct-prospecting methods and improvement of methodological techniques of their application in the exploration process for oil, gas and natural hydrogen, as well as in the study of the deep structural elements of the Earth. The results indicate that it is promising for the detection of HC deposits in the cross-section and the expediency of carrying out prospecting works of a detailed nature within it. In the northern part of the research area, by instrumental measurements a basalt volcanic complex has been localized, which is promising for of natural hydrogen and living water accumulations searching in the cross-section. During the cross-section scanning, responses at gas frequencies were recorded without interruption up to 5 km, which may indicate the presence of a deep channel within the surveyed area, through which oil, condensate and gas migrate to the upper horizons of the cross-section. The results of the survey indicate the advisability of direct-prospecting methods and technologies using when studying the deep structure of small areas and large blocks by geoelectric and seismic methods.
Within the framework of a new, "substance" (“matter”) paradigm of geophysical research, a "direct" search for a specific physical substance is carried out: gas, oil, gas hydrates, water, ore minerals and rocks (gold, platinum, silver, zinc, uranium, diamonds, kimberlites, etc.). The initial stage in the development of this paradigm can be considered the first research and development on the "direct" methods for oil and gas searching.
Прямопоисковая мобильная технология разведки на русском.pptDr. Arzu Javadova
В рамках новой, «вещественной» парадигмы геофизических исследований осуществляется «прямой» поиск конкретного физического вещества: газа, нефти, газогидратов, воды, рудных полезных ископаемых и горных пород (золота, платина, серебро, цинк, уран, алмазы, кимберлиты и др.).
A.j.on ecology issue of south caspian lankaran–talish–deniz and khazar areasDr. Arzu Javadova
Thus, the analysis of the borehole data, seismic data, and biostratigraphy confirmed that the Tertiary sediments consist of fluvial- deltaic–lacustrine sediments deposited in the isolated South Caspian Basin, particularly in the study area by several river systems.
The study area has several characteristics typical of landlocked marine environments: Low salinity; low HD conditions, causing stratification of the water column. High primary productivity of the water mass, generating conditions of dissolved oxygen supersaturation and deficits (of phosphorus and probably of oxygen at night). Also at the sediment level, the heterogeneity of the substrate and low benthic fauna content is typical of confined habitats, in which environmental conditions are especially difficult for the higher organisms.
The micro-pollutant concentration in both the water and sediment, a point also common to most confined habitats and related to the inflow from the catchment area. It is related to the fine fraction of the sediment and may be masked by the presence of numerous shell debris which “dilute” the muds and thereby the micro-pollutants and organic matter, usually settled on these fine sediment fractions. All the observations made on the study, substantial primary production, a paucity of benthos, etc are consistent with those made by different authors describing the Caspian Sea. The study area has high quantities of contaminants and low capabilities for dispersing potential intake, but on the other hand, has a distinct resistance to the influence of any future impediments
Geological & Prospective peculiarity of Kapaz field on South Caspian basin,Dr. Arzu Javadova
Kapaz field is located in the central part of the Apsheron-Pribalkhan threshold between the Azeri and Livano structures- in the west of the Caspian sea. Water depth changes from 90 m in the east to 130 m in the west, in the area. In the seismic cross-sections of the Kapaz field, deposits from Quaternary to Miocene are observed, the cross-sections were revised using the Ostracoda and Formaninifera fauna contents based on regional well correlations. The tectonic structures are an asymmetric anticline striking NW-SE. The folding undulated the upper Pliocene twice and the middle Pliocene thrice. Secondary undulations present as dome-shaped uplifts (3-5 1.5-2,0 km). The size on the fold in the base of the upper division of the middle Pliocene is 25 x2.5 km. The structure in the base of the upper division of the Middle Pliocene is displaced relative to the structure of the top of the mIddle Pliocene to the northwest along the fol axis 3.5-4 km. Oil and gas potential in the southwestern and northeastern slopes of the structure is associated with the deposits from the suite of Pereriva and also with the underlying suits of PS. Concerning Kapaz field evaluation, it is recommended to drill wells to strip up to the KaS as it was done in the Turkmenistan sector of the Caspian Sea in the Livanova, Gubkina, and Lam field. Taking into account the anomalous high-pressure layer below the suite of Pereriva every effort should be taken to strip up to the KaS successfully
To the geology of tertiary quaternary sediments of south-west part of the ...Dr. Arzu Javadova
The SW part of south Caspian offshore studied very poorly. Data studied from numerous offshore shallow engineering and deep exploration wells have provided useful information on the geology of the Tertiary- Quaternary sediments. The log, seismic data, and biostratigraphy confirmed that the Tertiary sediments consist of fluvial- deltaic–lacustrine sediments deposited in the isolated South Caspian Basin, particularly in the study area by several river systems. A Quarternary period is characterized by brackish water sediments. The "short" series of marine sediments of the deep and shallow facies of open sea bays, delta, and marine shallow waters are typical for the SW part of the Caspian.
Pliocene and Quaternary sediments unconformably overlie more ancient formations, until the Mesozoic sediments are located at a relatively shallow depth. In the Lankaran-Talysh Deniz, the Miocene sequences below the middle part of Pliocene Pereryva formation are pinching out against the basin margin. The thickness of these series increases stepwise across the main structures giving evidence of a rift-system developing at the beginning of major subsidence in the South Caspian during the early Tertiary. No hydrocarbon discovery except little oil and gas shows are found in SW of the Caspian due to several geological reasons such as a reservoir, vertical and lateral migration problem.
STRATIGRAPHIC PECULARITIES OF OSTRACOD DISTRIBUTION IN BAKU ARCHIPELAGO, THE ...Dr. Arzu Javadova
Poster presentation for Kazan russian conference.24 29.09.2018
Нами были изучены остракоды из пробуренных скважин северного и центрального Бакинского архипелага: Бахар, Бахар-2, Шах дениз, Аран дениз, Себаил, Ленкоран дениз, Курдаши, Инам, Песчаний и др. Каспийского моря, что позволило коррелировать состав остракодовой фауны четвертичных отложений (рис. 1). В нашем распоряжении было свыше 350 образцов, около 100 видов Leptocythere и Loxoconcha. В целом, выделенный нами состав остракод Южного Каспия позволяет расчленить четвертичные отложения на новокаспийский, хвалынский, хазарский, бакинский и апшеронский надгоризонты с соответствующими горизонтами и слоями (рис. 2). Характерный комплекс постплиоценовой фауны остракод хорошо коррелируется с прибрежными разрезами Апшеронского полуострова: Песчаный, Алят, Локбатан, Пирсагат, Нефтчала. При определении видового состава использовались СЭМ фотографии остракод, собранных нами из скважин Апшеронского и Бакинского архипелагов
Model Attribute Check Company Auto PropertyCeline George
In Odoo, the multi-company feature allows you to manage multiple companies within a single Odoo database instance. Each company can have its own configurations while still sharing common resources such as products, customers, and suppliers.
Synthetic Fiber Construction in lab .pptxPavel ( NSTU)
Synthetic fiber production is a fascinating and complex field that blends chemistry, engineering, and environmental science. By understanding these aspects, students can gain a comprehensive view of synthetic fiber production, its impact on society and the environment, and the potential for future innovations. Synthetic fibers play a crucial role in modern society, impacting various aspects of daily life, industry, and the environment. ynthetic fibers are integral to modern life, offering a range of benefits from cost-effectiveness and versatility to innovative applications and performance characteristics. While they pose environmental challenges, ongoing research and development aim to create more sustainable and eco-friendly alternatives. Understanding the importance of synthetic fibers helps in appreciating their role in the economy, industry, and daily life, while also emphasizing the need for sustainable practices and innovation.
The French Revolution, which began in 1789, was a period of radical social and political upheaval in France. It marked the decline of absolute monarchies, the rise of secular and democratic republics, and the eventual rise of Napoleon Bonaparte. This revolutionary period is crucial in understanding the transition from feudalism to modernity in Europe.
For more information, visit-www.vavaclasses.com
Operation “Blue Star” is the only event in the history of Independent India where the state went into war with its own people. Even after about 40 years it is not clear if it was culmination of states anger over people of the region, a political game of power or start of dictatorial chapter in the democratic setup.
The people of Punjab felt alienated from main stream due to denial of their just demands during a long democratic struggle since independence. As it happen all over the word, it led to militant struggle with great loss of lives of military, police and civilian personnel. Killing of Indira Gandhi and massacre of innocent Sikhs in Delhi and other India cities was also associated with this movement.
Welcome to TechSoup New Member Orientation and Q&A (May 2024).pdfTechSoup
In this webinar you will learn how your organization can access TechSoup's wide variety of product discount and donation programs. From hardware to software, we'll give you a tour of the tools available to help your nonprofit with productivity, collaboration, financial management, donor tracking, security, and more.
Introduction to AI for Nonprofits with Tapp NetworkTechSoup
Dive into the world of AI! Experts Jon Hill and Tareq Monaur will guide you through AI's role in enhancing nonprofit websites and basic marketing strategies, making it easy to understand and apply.
Palestine last event orientationfvgnh .pptxRaedMohamed3
An EFL lesson about the current events in Palestine. It is intended to be for intermediate students who wish to increase their listening skills through a short lesson in power point.
Honest Reviews of Tim Han LMA Course Program.pptxtimhan337
Personal development courses are widely available today, with each one promising life-changing outcomes. Tim Han’s Life Mastery Achievers (LMA) Course has drawn a lot of interest. In addition to offering my frank assessment of Success Insider’s LMA Course, this piece examines the course’s effects via a variety of Tim Han LMA course reviews and Success Insider comments.
Biological screening of herbal drugs: Introduction and Need for
Phyto-Pharmacological Screening, New Strategies for evaluating
Natural Products, In vitro evaluation techniques for Antioxidants, Antimicrobial and Anticancer drugs. In vivo evaluation techniques
for Anti-inflammatory, Antiulcer, Anticancer, Wound healing, Antidiabetic, Hepatoprotective, Cardio protective, Diuretics and
Antifertility, Toxicity studies as per OECD guidelines
The Roman Empire A Historical Colossus.pdfkaushalkr1407
The Roman Empire, a vast and enduring power, stands as one of history's most remarkable civilizations, leaving an indelible imprint on the world. It emerged from the Roman Republic, transitioning into an imperial powerhouse under the leadership of Augustus Caesar in 27 BCE. This transformation marked the beginning of an era defined by unprecedented territorial expansion, architectural marvels, and profound cultural influence.
The empire's roots lie in the city of Rome, founded, according to legend, by Romulus in 753 BCE. Over centuries, Rome evolved from a small settlement to a formidable republic, characterized by a complex political system with elected officials and checks on power. However, internal strife, class conflicts, and military ambitions paved the way for the end of the Republic. Julius Caesar’s dictatorship and subsequent assassination in 44 BCE created a power vacuum, leading to a civil war. Octavian, later Augustus, emerged victorious, heralding the Roman Empire’s birth.
Under Augustus, the empire experienced the Pax Romana, a 200-year period of relative peace and stability. Augustus reformed the military, established efficient administrative systems, and initiated grand construction projects. The empire's borders expanded, encompassing territories from Britain to Egypt and from Spain to the Euphrates. Roman legions, renowned for their discipline and engineering prowess, secured and maintained these vast territories, building roads, fortifications, and cities that facilitated control and integration.
The Roman Empire’s society was hierarchical, with a rigid class system. At the top were the patricians, wealthy elites who held significant political power. Below them were the plebeians, free citizens with limited political influence, and the vast numbers of slaves who formed the backbone of the economy. The family unit was central, governed by the paterfamilias, the male head who held absolute authority.
Culturally, the Romans were eclectic, absorbing and adapting elements from the civilizations they encountered, particularly the Greeks. Roman art, literature, and philosophy reflected this synthesis, creating a rich cultural tapestry. Latin, the Roman language, became the lingua franca of the Western world, influencing numerous modern languages.
Roman architecture and engineering achievements were monumental. They perfected the arch, vault, and dome, constructing enduring structures like the Colosseum, Pantheon, and aqueducts. These engineering marvels not only showcased Roman ingenuity but also served practical purposes, from public entertainment to water supply.
1. Well Control During Workovers and
Completions
1
Bullheading
Bullheading is a common method for killing live wells prior to moving a rig on to conduct a
workover. It is a non-circulating technique which uses a pump and kill fluid. The method
entails forcing produced fluids back into the producing formation while filling the tubing
with kill.
Lubrication and Bleeding
In some cases bullheading is not possible or desirable. Examples of this are: severely worn
tubing having low burst pressure, low formation fracture strength, and damaged or
deteriorated wellhead equipment with limited working pressure. In these cases, lubrication
and bleeding might be a more acceptable means of killing a well. This technique can also
be used to reduce surface pressure to a point where bullheading can be conducted.
The basic procedure for lubricating and bleeding requires the pumping of a measured
volume of kill fluid into the well, allowing it to fall, and then bleeding gas at the surface
while controlling surface pressure to predetermined limits.
Circulation Methods
Reversing is a common circulation method used for killing live wells before a workover.
Prior to the commencement of a workover, a circulating pathway must be established
between the casing and tubing. A few methods are available: tubing perforation, opening a
sliding sleeve, or pulling a gas lift valve or dummy, which are commonly performed by
slickline. Once surface pressures stabilize, kill fluid can be circulated throughout the well.
Normal circulation can also be used to conduct a kill operation.
Killing A Well Prior To A Workover – Non-Circulating Techniques
2. Well Control During Workovers and
Completions
2
Bullheading
Bullheading is a means of killing a static
producing well in which produced fluids are
pumped back into the producing formation
and the tubing filled with kill fluid.
Bullheading should not be done in a
haphazard way due to the possibility of
damaging wellbore tubulars, damaging the
producing formation, or fracturing adjacent
formations.
To accomplish a successful bullheading
operation the following information is
required to generate a Bullheading
Schedule. The bullheading schedule is
generated which provides the user with a
means of killing the well with the control of
surface pumping pressure.
Non-Circulating Techniques
3. Well Control During Workovers and
Completions
3
The following information is required to prepare a Bullheading schedule:
Formation pressure – calculated, but preferably from a recent BHP survey
Desired overbalance - provided by kill fluid – while pumping balanced weight fluid will kill a well, and
overbalance is required if the tubing or packer is to be pulled, or if trips are to be made into and out of the
well. Common overbalances range from .3 ppg to .5 ppg above the balanced fluid welight.
Perf depth - measured and vertical
Fracture pressure - estimate of the formation frac strength – the decline of the producing formation
pressure must be taken into account when making this estimate – as a rule of thumb: render a conservative
estimate
Bullheading
Non-Circulating Techniques
4. Well Control During Workovers and
Completions
4
Bullheading
Non-Circulating Techniques
Tubing specifics - ID, length, EOT, burst, percent wear – seriously consider running a
tubing caliper survey if the well has a history of producing sand or corrosive fluids such as
H2S, CO2, or a high volume of salt water
Annular fluid backup - the presence or absence of fluid in the annulus – this can have a
major impact on the effective burst pressure of the tubing
Rathole - ID and measured length – if a rathole exists it must be filled with kill fluid
Pump size - liner, stroke, and efficiency data
Surface pressures - tubing and annular
Wellhead working pressure
5. Well Control During Workovers and
Completions
5
STEP 1 Formation Pressure (ppg)
STEP 2 Kill Fluid (ppg)
STEP 3 Fracture Pressurepsi - requires knowledge or estimate of frac in ppg
STEP 4 Pumping Volume
STEP 5 Pump Outputbbl/stk - pump efficiency must be input in decimal form
( )
Formation
Vertical
PSI
PPG
DepthPerf
Formation
=
× 23.19
PPGPPGPPG FluidKillOverbalaceDesiredFormation =+
PSIVerticalPPG FracDepthPerfFrac =×× 052.
BBLRathole
Rathole
Tbg
Tbg
VolumePumpingLength
ID
Length
ID
=
×
+
×
4.10294.1029
22
STKBBLPercentageInches OutputEfficiencyPumpLengthStrokeIDLiner /
2
000243. =×××
Bullheading
Non-Circulating Techniques
6. Well Control During Workovers and
Completions
6
STEP 6 Pump Strokes - if the pump has a stroke counter
STEP 7 Working Burst Pressure of the Tubing Assuming the industry standard of
downgrading the tubing specifications to
80%.
If the tubing is known to be worn more
than 20%, insert the appropriate value
rather than the given .
STEP 8 Maximum Initial Tubing Pressure – Tubing Burst (assuming no backup)
STEP 9 Maximum Final Tubing Pressure – Tubing Burst (assuming no backup)
STEPS 8 & 9 are to be done if the assumption is made to disregard tubing backup supplied
by the presence of fluid in the tubing/casing annulus - in older wells it may be prudent to
make this assumption.
StrokesPump
OutputPump
VolumePumping
STKBBL
BBL
=
/
PSIPSI BurstWorkingBurstPublished =× 8.
( ) PSIPSIPSI InitialMaxSITPFormationBurstWorking =+−
PSIVerticalPPGPSI FinalMaxDepthPerfFluidKillBurstWorking =××− )052(.
Bullheading
Non-Circulating Techniques
7. Well Control During Workovers and
Completions
7
TEP 10 Maximum Initial Tubing Pressure – Frac (assuming no backup)
TEP 11 Maximum Final Tubing Pressure – Frac (assuming no backup)
PSI
Pump Strokes or BBL Pumped Tbg & Rathole
Displaced
SITP Line
Frac Line (based on no
backup
Tbg Burst Line (based on no
backup)
Max Initial
Pressures
Max Final
Pressures
Safe PumpingRange
The following is a graphical representation of calculated Initial and Final pressure along with Pumping
Volume.
( ) PSIPSIPSI InitalMaxSITPFormationFrac =−−
( ) PSIVerticalPPGPPG FinalMaxDepthPerfFluidKillFrac =××− 052.
Bullheading
Non-Circulating Techniques
8. Well Control During Workovers and
Completions
8
If tubing back up is to be considered the following calculations will take the place of the
Maximum Initial and Maximum Final pressures for burst used previously.
Maximum Initial Tubing Pressure (tbg burst consideration) - back up assumed
Maximum Final Tubing Pressure (tbg burst consideration) - back up assumed
The above calculations will result in higher values due to the inclusion of the annular
hydrostatic pressure as a back up. In some cases, the maximum initial and maximum final
pressure could be higher than the rated burst pressure. Naturally in these cases, the
working burst pressure would be used as the maximum pressure.
On the following page is a graph depicting the changes that would take place when annular
hydrostatic pressure is considered in calculating maximum initial and final pressures for
tubing burst.
( ) ( ) PSIVerticalPPGPSIPSI InitialMaxLengthFluidFluidAnnularFormationBurstWorking =××+− 052.
( )( )
( ) PSIVerticalPPG
VerticalPPGPSI
FinalMaxLengthFluidAnnular
LengthFluidKillBurstWorking
=××
+××−
052.
052.
Bullheading
Non-Circulating Techniques
9. Well Control During Workovers and
Completions
9
Tbg & Rathole
Displaced
Pump Strokes or BBL Pumped
SITP Line
Frac
Line
Tbg Burst Line (based on fluid
backup)
Max Final
Pressures
Safe PumpingRange
Max Initial
Pressures
Working Burst
Pressure
From the graph it can be seen that the tubing burst pressures may be greater than
calculated working tubing burst pressure and possibly greater than the working pressure of
the tree.
PSI
Bullheading
Non-Circulating Techniques
10. Well Control During Workovers and
Completions
10
From previous diagrams and based on the “safe pumping range,” it is clear that as
hydrostatic pressure in the tubing increases, due to the introduction of kill fluid, maximum
surface pressures decrease. The drawing indicates the safe range to be bordered by the
SITP and the Frac Line. This is the most desirable situation but is not always the case. If the
tubing is severely corroded or pitted due to corrosive fluid production or sand production, the
Tubing Burst Line could be the first ‘limit line’ above the SITP line. In either case, the safe
pumping range is between the SITP Line and the first limit line above it.
There are two ways the pressure can be monitored while the operation is in progress. A
schedule could be generated based on an observed maximum initial pumping pressure, a
selected maximum final pumping pressure, and the total volume or total strokes to pump.
Naturally, the Maximum Initial Pressure would have to be within the safe pumping range. The
mathematics to accomplish this is as such:
STEP 2 Average Pressure
Drop
STEP 1 Pressure Drop
M a x im u m I n itia l M a x im u m F in a l−
p r e s s u r e d r o p
in c r e m e n ts1 0
10 increments have been selected here only as an
example - 15, or even 20 increments could be selected
depending on how often one would want to check pump
pressure during the operation
STEP 3 Average Volume or Pump Stroke
T o t a l P u m p S t r o k e s
i n c r e m e n t s1 0
or
T o ta l P u m p in g V o lu m e
in c r e m e n ts1 0
Bullheading
Non-Circulating Techniques
11. Well Control During Workovers and
Completions
11
21
Based on the calculated average pressure drop and average pump strokes or volume
pumped, a schedule can be generated and recorded. The procedure for the schedule is as:
STEP 4 Pump Pressure
i n i t i a l p u m p p r e s s u r e a v e r a g e p r e s s u r e d r o p−
The first calculation renders a pump
pressure corresponding to a ‘check
point’ on the schedule. Additional similar
calculations complete the schedule.
STEP 5 Pump Strokes
0 s t r o k e s a v e r a g e s t r o k e s+
This calculation provides the first checkpoint once the
operation has started. Additional similar calculations
complete the schedule.
As an example, let’s use the information below to illustrate the creation of a schedule:
Initial Pump Pressure 2200 psi
Final Pump Pressure 800 psi (arbitrarily selected)
Total Strokes 4500 strokes
Checkpoints 10
Bullheading
Non-Circulating Techniques
12. Well Control During Workovers and
Completions
12
Pressure Drop (Initial Circulating Pressure to Final Circulating
Pressure)
2 2 0 0 8 0 0 1 4 0 0p s i p s i p s i− =
Average Pressure Drop (Base on 10
Checkpoints)
1 4 0 0
1 0
1 4 0
p s i
p s i c h e c k p o
i n c r e m e n t s
= / i n t
Having performed these two
calculations the pressure decline
portion of the schedule can be
completed.
The Initial Pressure of 2200 would be
the 1st entry. The average pressure
drop of 140 psi is subtracted from the
initial to obtain the 2nd checkpoint.
Repeating this process completes the
pressure side of the schedule.
2200
2060
1920
1780
1640
1500
1360
1220
1080
940
800
2200 - 140 = 2060
2060 - 140 = 1920
Additional iterations
complete the schedule
Bullheading
Non-Circulating Techniques
13. Well Control During Workovers and
Completions
13
A similar same thing can be done where the strokes or bbls to pump is concerned. In the
case where 4500 strokes is required to displace the tubing and rathole, the incremental
strokes increase of the schedule is generated as seen below.
0
450
900
1350
1800
2250
2700
3150
3600
4050
4500
Average Stroke Count
4 5 0 0
1 0
4 5 0
to ta l s tr o k e s
in c r e m e n ts s tr o k e s=
0 strokes + 450 = 450 strokes
450 strokes + 450 strokes = 900
strokes
……and so on…...
2200
2060
1920
1780
1640
1500
1360
1220
1080
940
800
0
450
900
1350
1800
2250
2700
3150
3600
4050
4500
PSI STK
S
The completed schedule appears a right.
The pump pressure is controlled by
adjusting the pump throttle to achieve the
desired decreasing pump pressures.
Bullheading
Non-Circulating Techniques
14. Well Control During Workovers and
Completions
14
Below is an example graphical representation of a bullheading operation.
The shaded area indicates a “safe pumping range” based on calculated pump pressures. The
center line in the shaded area indicates a “midpoint” or desired pump pressure line to follow.
The red lines indicate how pressures can be monitored at anytime during the operation.
Checking the pressure at 750 strokes would yield a pressure of about 2200 psi.
Checking the pressure at 2600 strokes would yield a pressure of about 1100 psi.
Pump Strokes or BBL Pumped
Pump
Pressure
Formation Taking
Fluid
Stabilized Initial Pump
Pressure
500 1000 1500 2000 2500 3000 3500 3750
0
1000
2000
3000
4000
5000 5000
4000
3000
2000
1000
Desired Pump
Pressure
Bullheading
Non-Circulating Techniques
15. Well Control During Workovers and
Completions
15
While bullheading the casing pressure should
be monitored closely. Any increase in the
casing pressure should be reported to the job
supervisor and closely monitored for change.
Casing pressure increases can be from thermal
expansion caused by pumping liquids down the
tubing, or may indicate leaking tools or seals
such as sliding sleeves, gas lift equipment,
safety valves, packer seals, etc.
The presence of, or an increase in casing
pressure while bullheading can have dire
consequences. Excess pressure applied to the
cross-sectional area of the packer creates a
great deal of force, so much so that the packer
can be forced down the hole and the tubing
parted. Additionally, the excess pressure in
the annulus creates a situation where casing
burst pressure can be approached - not
necessarily at the surface but downhole.
Casing Pressure Increase While Bullheading
Bullheading
Non-Circulating Techniques
16. Well Control During Workovers and
Completions
16
Gas Channeling
Gas channeling can occur during a bullheading
operation, especially so if the kill fluid lacks
appreciable viscosity and the pump rate is
somewhat slow. In that case, gas may migrate up
the tubing faster than it is being forced down the
tubing through pumping.
According to the previous graphs, once the tubing
and rathole volume are pumped, the tubing
pressure should be 0 psi and the well dead.
Oftentimes this is not the case. Even though the
SITP is 0 psi and the well ‘seems’ to be dead, wait
for a while, 30 minutes or more, and monitor the
SITP. If it starts to increase then gas channeling is
usually the problem. It is particularly troublesome
in highly deviated wells.
A possible remedy to this situation is to pump a
viscous pill ahead of the kill fluid to minimize the
gas channeling. This could be followed, if so
desired by a solids-laden pill, such as calcium
carbonate, which can be acidized out when
desired, and then that followed by the kill fluid. Of
course, formation permeability and sensitivity must
be considered before using a viscous or solids-
Gas Channeling
Kill Fluid
Bullheading
Non-Circulating Techniques
17. Well Control During Workovers and
Completions
17
Gas lubrication is the process of pumping fluid
into the tubing, allowing it to fall, and then
bleeding gas; all the while maintaining a
constant bottomhole pressure. The procedure
is sometimes known as pump and bleed.
Lubrication can be used to either entirely kill a
well prior to a workover or to reduce the SITP
prior to bullheading. Preceding a bullheading
operation is usually done if the tubing is
known or suspected to be in poor condition
and may not withstand the pressures
encountered during bullheading
There are two approaches to this procedure,
but regardless of the method used, the
objective is to introduce hydrostatic pressure
into the tubing by the means of a kill fluid.
Lubrication and Bleeding
Non-Circulating Techniques
18. Well Control During Workovers and
Completions
18
STEP 1 Select an overbalance (Working Range) such as 50 to 100psi
STEP 2 Calculate the hydrostatic increase base on the volume pumped, the wellbore
geometry, and the density of the fluid being pumped. This is accomplished using the
following:
IncreasecHydrostati
WtFluid
ID
RangeWorking
BBL
PPG
Tbg
Pumped =
××
×
.052.
4.1029
2
STEP 3 Pump kill fluid into the well until the observed pump pressure is equal to the
Working Range. Stop the pump and take note of the volume pumped. Use this volume in
performing the above calculation.
STEP 4 Allow time (at least 30 to 45 minutes – be patient) for the fluid to fall or “lubricate”
through the produced fluids in the tubing.
STEP 5 Bleed dry gas through the production choke while monitoring the SITP. The
“target” SITP is determined as follows:
Bleed SITP back to original SITP as this is compression.
Subtract from the SITP the hydrostatic added by kill fluid.
Lubrication and Bleeding - Volume Method
Non-Circulating Techniques
19. Well Control During Workovers and
Completions
19
BBL Pumped
PSI
Trend of declining SITP
Working Range
Pressure decline after pump is shut down
Pressure stabilization
Bleeding gas (bleed back to original
SITP and additional hydrostatic
added)
Resulting SITP
Below is an idealized plot of the Volume Method as described on the previous page.
Lubrication and Bleeding - Volume Method
Non-Circulating Techniques
20. Well Control During Workovers and
Completions
20
The Volume Method of lubrication is not without its shortcomings:
While pumping into the well as per the selected Working Range, produced fluids
can be forced back into the perfs equal to the hydrostatic pressure added by kill
fluid.
When gas is bled at the surface the SITP will decline but could re-build and
stabilize near the original SITP. This would make the operation appear to
be accomplishing nothing. Patience is needed in this case.
Eventually enough kill fluid hydrostatic will be added to the tubing to start to make
a difference and the SITP will begin to shows signs of decline. This occurrence is
especially like when the producing formation is quite permeable.
Due to this, the Volume Method is more applicable to drilling operations where
mud solids build open hole wall cake against permeable formations and limit fluid
invasion
Lubrication and Bleeding - Volume Method
Non-Circulating Techniques
21. Well Control During Workovers and
Completions
21
A better method of lubrication to use during workovers is the Pressure Method.
The volume of fluid pumped does not have to be monitored as it does in the
Volume Method.
The Pressure Method uses three pressures:
Pressure 1 P1: initial SITP
Pressure 2 P2: stabilized SITP after pumping
Pressure 3 P3: desired SITP after bleeding gas from the
well
To determine P2 and P3 perform the following:
3
2
2
1
P
P
P
=
Lubrication and Bleeding - Pressure Method
Non-Circulating Techniques
22. Well Control During Workovers and
Completions
22
Pressure Method Procedure:
STEP 1 Pump kill fluid into well to increase SITP to desired pressure considering
a working range.
STEP 2 Allow the tubing pressure to stabilize. Use the stabilized tubing pressure
as the value for P2.
STEP 3 Calculate P3 and bleed tubing to the calculated value. Repeat steps 1
through 3 until all the gas is out of the well or until another procedure
implemented based on having achieved a desired SITP.
Lubrication and Bleeding - Pressure Method
Non-Circulating Techniques
23. Well Control During Workovers and
Completions
23
Lubrication and Bleeding - Pressure Method
Non-Circulating Techniques
BBL Pumped
PSI
Trend of declining SITP
Working Range
Pressure decline after pump is shut down
Pressure stabilization
Bleeding gas (bleed to target
pressure)
Resulting SITP
Plot of Pressure Method
24. Well Control During Workovers and
Completions
24
Lubrication and Bleeding The Casing
Non-Circulating Techniques
Without Packer
Lubrication and bleeding can be performed on the casing
but consideration must be made with respect to the
presence or absence of a packer. If the well has been
completed without a packer then either the Volume
Method or Pressure Method can be used.
Selecting the working range would have the same criteria
used when performing Lube and Bleeding on the tubing.
25. Well Control During Workovers and
Completions
25
Kill fluid pumped in and produced fluids bled
Kill fluid would be pumped into and
produced fluids would be bled from the
production casing wing.
Regardless of the method selected, a
worksheet should be completed to track the
progress of the operation.
Lubrication and Bleeding The Casing
Non-Circulating Techniques
Without Packer
26. Well Control During Workovers and
Completions
26
Lubrication and Bleeding The Casing
Non-Circulating Techniques
With Packer
Conducting a Lube and Bleed operation on the casing side of a
well with a packer in the hole is another matter entirely. The
main “danger” is the possibility of parting the tubing or pumping
the packer down hole – neither of which are very desirable.
Information should be gathered about the following in order to
determine the feasibility of attempting a Lube and Bleed on a
well with a packer in place:
When the packer was initially set was it set in tension
or compression?
The OD of the tubing.
Tubing tensile strength.
Collapse pressure of the tubing.
The OD of the packer.
The burst pressure of the casing.
The density of the pack fluid left in place when the
well was completed or last worked over.
27. Well Control During Workovers and
Completions
27
Lubrication and Bleeding The Casing
Non-Circulating Techniques
With Packer
Forces
A few things come into play that create forces on the cross-
sectional area of the packer:
Hydrostatic pressure of the packer fluid
SICP
Applied surface pressure from the Lube and Bleed
operation
FORCE (lbs) is pressure exposed to a cross-sectional area
2
inchesPSI APForce ×=
The “area of interest”, in this case is the exposed area of the
packer, or as illustrated at right and for all practical purposes,
the area between the OD of the tubing and the ID of the
casing.
28. Well Control During Workovers and
Completions
28
Lubrication and Bleeding The Casing
Non-Circulating Techniques
With Packer
The force created across the exposed area of the packer is calculated as
such:
( ) LBSPSIODID ForcePTbgCsg =××− 7854.22
This calculation would have to be done for everything that exerts pressure on the
packer:
SICP
Applied surface pressure of the Lube and Bleed operation
Packer fluid hydrostatic pressure.
Once total force is calculated (a sum of all the forces) it is compared to estimated
tubing tensile strength. From that comparison a decision is made as to the
feasibility of performing a Lube and Bleed operation on the annulus housing a
seated packer.
29. Well Control During Workovers and
Completions
29
Lubrication and Bleeding The Casing
Non-Circulating Techniques
With Packer
Tubing Tensile Strength
The tensile strength of a steel tubular is determined by the grade of steel and the square
inches of steel of which the tubular is comprised.
Tubing grades are annotated as such:
N-80,
C-75
P-110
The numerical values indicating the minimum yield strength of the steel in thousands of
pounds per square inch of steel.
N-80 pipe = steel with a minimum yield of 80,000 psi
C-75 pipe = steel with a minimum yield of 75,000 psi
P-110 pipe = steel with a minimum yield of 110,000 psi
The tensile strength can be determined by multiplying the area of steel in square inches by
the minimum yield of the steel.
30. Well Control During Workovers and
Completions
30
Lubrication and Bleeding The Casing
Non-Circulating Techniques
With Packer
Tubing Tensile Strength
Tubing tensile strength is calculated using the following:
( ) PSIODOD YieldMinimumTbgTbg ××− 7854.22
The above formula will render tensile strength of new pipe. It is strongly advised
that some safety factor be applied to the calculated tensile strength. A common
practice is to downgrade the calculated tensile strength to 80% or even 70% if the
tubing is known to be worn to some degree.
Another means of gaining useful knowledge of the tubing tensile strength is to
consult any one of a number of tubing tables that are commercially available. In
most cases, the specifics are for new pipe and the user must make adjustments
as to his/her knowledge of the pipe condition.
31. Well Control During Workovers and
Completions
31
Lubrication and Bleeding The Casing
Non-Circulating Techniques
With Packer
Kill fluid pumped in and produced fluids bled
Kill fluid would be pumped into and
produced fluids would be bled from the
production casing wing.
Regardless of the method selected, a
worksheet should be completed to track the
progress of the operation.
32. Well Control During Workovers and
Completions
32
In some cases a circulating kill technique is preferred over a non-circulating one
necessitating communication between the tubing and the casing. If this is the case, a
means of communication between the two strings must be established. This is commonly
done by one of the three following methods which can be accomplished via wireline or
coiled tubing-conveyed wireline tools :
Shifting a sliding sleeve
Pulling a gas lift dummy from a side-pocket mandrel
Perforating the tubing
Anytime communication is established between the tubing and casing there exists the
possibility of a differential pressure at the point where communication is established. This
can be a problem. If there is a negative differential (more pressure in the casing than the
tubing at the point of communication), a wireline tool string could get blown up the hole
creating the very real possibility of a fishing job before the well is killed.
Sliding sleeves incorporate equalizing features to minimize this. The same is true for some
gas lift valves/dummies, but not in all cases. Therefore, it’s imperative that the gas lift
equipment be identified as to the presence or absence of this feature.
Regardless, it highly recommended that calculations be made as to the possible differential
existing at the desired point of communication and steps taken to minimize the differential
Gaining Tubing-to-Casing Communication
33. Well Control During Workovers and
Completions
33
Calculating Differential
Pressure
Surface Pressures
1150 psi SITP
0 psi SICP
Wellbore Fluids
Tubing:
0’-2188’ gas – average density of .115 psi/ft
2188’-11235’ – oil – measured API gravity
of 31.5o
@ 120o
F
Casing:
0’ – 11235’ – filled with 11.4 calcium
chloride
The task at hand is to open the sliding sleeve @ 11235’ in order
to circulate kill fluid around and kill the well before the workover
starts. Even though sliding sleeves have an equalizing feature,
it’s a good idea to determine if there is a differential across the
sleeve and then decide how to negate the effects of the
differential.
The differential, if present, is based on the total pressure in the
casing at the depth of interest compared to the total pressure in
the tubing at the depth of interest. The total pressure is a
combination of any surface pressure plus hydrostatic pressure.
This is to be applied to both sides of the well.
The information below will be used in the example:
Gaining Tubing-to-Casing Communication
34. Well Control During Workovers and
Completions
34
Oil Hydrostatic Pressure
STEP 1 Calculate API Gravity Corrected For
Temperature
( )
CorrectedAPI
TempObserved
TempObserved =
−
−
10
60
STEP 2 Oil Hydrostatic Pressure
( ) PSIColumnOilftpsi
Corrected
HPLength
API
=×
+
/433.
5.131
5.141
Gas Hydrostatic
Pressure
PSIColumnGasFTPSI cHydrostatiGasLengthVerticalGradientGasAverage =×/
Brine Hydrostatic Pressure
cHydrostatiBrineLengthWtFluid ColumnFluidPPG =×× .052.
NOTE: Calculating oil hydrostatic pressure is a two step process. Oil density is measured in API
degrees. The API hydrometer is calibrated to be accurate at 60 degrees F. Therefore it is
necessary to correct the observed density to the observed temperature.
Calculating Differential
Pressure
Gaining Tubing-to-Casing Communication
35. Well Control During Workovers and
Completions
35
Total Casing Pressure @ Depth of
Interest
Brine Hydrostatic Pressure
psiPPG 6660112354.11052. =×× Since there is no surface casing pressure the
calculated brine hydrostatic pressure is the total
pressure in the casing at the depth of interest.
Total Tubing Pressure @ Depth of Interest
Gas Hydrostatic Pressure
STEP 1 Corrected API
Gravity
PSIFtPSI 2526.251'2188115. / ≈=×
Oil Hydrostatic
Pressure
( )
API5.25
10
60120
5.31 =
−
−
STEP 2 Oil Hydrostatic
Pressure
( )
( ) PSIFTPSI 35316.3530218811235433.
5.255.131
5.141
/ ≈=−××
+
Calculating Differential
Pressure
Gaining Tubing-to-Casing Communication
36. Well Control During Workovers and
Completions
36
Total Tubing
Pressure
PSI
cHydroststiOil
PSI
cHydroststiGas
PSI
SITP
PSI 493335312521150 =++
Differential Pressure
PSI
TbgTotal
PSI
CsgTotal
PSI 172749336660 =−
Obviously the differential is from Casing to Tubing. To negate the existing differential 1727
psi must be added to the tubing string since it would be virtually impossible to decrease the
hydrostatic pressure in the casing.
There are two options available:
Pump into the tubing to increase the surface pressure by the differential pressure
– provided this can be done without damaging the producing formation
Set a plug in the tubing below the sliding sleeve and then pressure up on the
tubing by the calculated differential
Calculating Differential
Pressure
Gaining Tubing-to-Casing Communication
37. Well Control During Workovers and
Completions
37
Gaining Tubing-to-Casing Communication
Shifting a Sliding
Sleeve
OpenClosed
Sliding Sleeve
Port
A shifting/positioning tool is conveyed by wireline or coiled tubing and
the sleeve is shifted to the open position.
Shifting Tool
38. Well Control During Workovers and
Completions
38
Gas Lift Equipment
Gaining Tubing-to-Casing Communication
Gas lift equipment is installed in an oil well in anticipation of formation
pressure declining before all recoverable reserves are produced. In the case
of the side pocket equipment, numerous side pocket mandrels are run in the
tubing string. As the illustration shows, the mandrel contains a profile for
the gas lift dummies or valves. If the mandrels are run in the initial
completion, dummies are installed which can be removed at a later date and
replaced with valves
.
With the valves in place, gas is injected in the casing and enters the
mandrel via the gas ports. The ports align with a port on the gas lift valve
which then conveys the gas into the oil in the tubing string. The gas entering
the oil lightens the column hydrostatically, thus allowing the remaining
formation pressure to produce the oil.
A kickover tool, orients the pulling or running tool to the side pocket for
valve or dummy installation or extraction. Once the valve or dummy is out of
the pocket, the pocket can then be used as a means of casing-to-tubing
communication.
Courtesy of Halliburton
39. Well Control During Workovers and
Completions
39
Three commonly used and very reliable kickover
tools are from left to right: the Camco AK
Kickover Tool, the Camco L Kickover Tool, and
the Camco L-2D Kickover Tool.
The appropriate pulling or running tool for the gas
lift valve would be installed below the kickover
tool.
Camco Kickover
Tools
Gas Lift Equipment
Gaining Tubing-to-Casing Communication
40. Well Control During Workovers and
Completions
40
Gas Lift – Pulling A Dummy Or
Valve
STEP 1 The tool string is
run below the desired gas
lift mandrel.
STEP 2 The tool string
is raised above the
mandrel. As this
happens the tool string
rotates and begins to
orient to the side
pocket.
STEP3 The kickover tool
kicks the pulling tool into the
side pocket to engage the
gas lift valve.
41. Well Control During Workovers and
Completions
41
Gas Lift
STEP4 The pulling tool
engages and latches the
fishing neck of the gas lift
valve
STEP5 Upward manipulation
of the tool string pulls the lift
valve from the side pocket.
42. Well Control During Workovers and
Completions
42
Tubing Perforation
Tubing perforated just
above the packer
Gaining Tubing-to-Casing Communication
A perforator, be it mechanical or shot charge,
is lowered to the desired depth which is usually
as close to the packer as possible. The
perforator is activated and communication with
the annulus is established.
Although an explosive E-line conveyed
explosive charge is more efficient, it may be
more desirable to use a mechanical perforator
to prevent any possible damage or unwanted
perforation of the production casing.
43. Well Control During Workovers and
Completions
43Otis Type A Mechanical Perforator
Slip Stop
Collar Stop
Tubing Perforation
Gaining Tubing-to-Casing Communication
The mechanical perforator does not offer the accurate depth
control of an E-line perforator but can still get the job done.
Either the slip stop or collar stop can be used as a perforating
platform for the mechanical perforator.
44. Well Control During Workovers and
Completions
44
Tubing Perforation
Gaining Tubing-to-Casing Communication
To perforate the tubing using a mechanical
perforator, a tubing stop must first be set at a
desired depth.
Next the perforator is run and activated. After
communication is established between the tubing and
the casing, the perforator is pulled from the hole
followed by the tubing stop.
Wireline Tool String
Perforator
Tubing Stop
45. Well Control During Workovers and
Completions
45
Surface Pressure Stabilization
After successful communication between the
tubing and casing has been established,
time should be given for surface pressure to
stabilize, even though exhaustive
calculations have been performed in the
effort to predict the surface pressures based
on “known” or anticipated fluids in place
versus formation pressure. In some cases,
it’s a “best guess” of the actual stabilized
surface pressures.
Factors affecting this can be, but are not
limited to, unknown fluid density in both the
tubing and casing, especially so in a
workover. Over time, the brine in the packer
fluid can crystallize and find its way to the
packer. This can make it initially impossible
to gain string-to-string communication, even
though a “communication window” has been
opened via sliding sleeve, gas lift
equipment, or perforation. The brine can
settle and pack making it impossible for fluid
to flow through it. This also makes the
density of the liquid in the annulus an
unknown.
46. Well Control During Workovers and
Completions
46
Another problem that can exist is that the
exact density of the fluids in the tubing may
not be unknown. Additionally, there may
exist a differential between the casing and
the tubing. If this is the case, the possibility
of u-tubing of these fluids exists and would
occur until a pressure equilibrium is
established.
Therefore, prior to any kill method being
attempted, be it circulating or non-
circulating, surface pressures must be
allowed to stabilize.
Following the stabilization of surface
pressure, a circulating kill procedure can be
implemented which will be discussed later in
the chapter.
Surface Pressure Stabilization
47. Well Control During Workovers and
Completions
47
Friction
Pressure
Friction pressure is the pressure created by circulating a fluid through a
circulating system at a given rate. Factors affecting the magnitude of friction
pressure include:
Fluid properties
Circulating system geometry
Pump rate
Knowledge of friction pressure has two uses:
Provides information regarding circulating pump pressure when killing a
well
Provides information about annular friction while circulating which adds
to wellbore stress
After the well is initially dead and circulated entirely with kill fluid, it is advised
that a few slow pump rates be taken.
Rate 1 Normal average operating speed of the pump
Rate 2 Half the normal average operating speed of the pump
Rate 3 As slow as the pump can pump for an extended duration
Record corresponding pressure with each rate.
48. Well Control During Workovers and
Completions
48
Friction
Pressure
Annular friction, which is created in the casing when fluid is pumped, adds to
bottom hole pressure. In drilling environments, annular friction makes up a small
portion of the total friction pressure created, but in workovers, this is not the case
due to the reduced diameters involved, especially the production casing. Even
when using solids-free fluid, appreciable friction pressure can be created in the
somewhat “tight” confines of a producing well annulus.
To that end, it is prudent to calculate an estimate of the annular friction pressure
created by each slow pump rate for both normal and reverse circulation, since
reverse circulation is used so frequently in workovers.
The following set of formulas can be used to generate reasonable estimates of
workstring and annular friction pressure as well as the equivalent stress created
at the bottom of the hole.
49. Well Control During Workovers and
Completions
49
Friction
Pressure
WORKSTRING FRICTION
PRESSURE
STEP 1 Workstring Fluid Velocity ft/sec
( )
( ) SecFT
Tbg
BBLGalBPM
Velocity
ID
Flowrate
/2
/
45.2
42
=
×
×
STEP 2 Reynolds Number
( )
R
CP
TbgSecFtPPG
N
ityVisFluid
IDVelocityFluidWtFluid
=
×××
cos
.928 /
If the Reynolds Number ≥ 2100 the flow is Turbulent – Go to STEP
3
If the Reynolds Number ≤ 2100 the flow is Laminar – Go to STEP
4
STEP 3 Turbulent Friction Pressure
( )
( ) PSI
Tbg
MDFluid
Friction
ID
DepthityVisVelocityWtFluid
=
×
×××
2
25.75.175.
1000
cos
50. Well Control During Workovers and
Completions
50
Friction
Pressure
STEP 4 Laminar Friction Pressure
( )
( ) PSI
Tbg
MDFluidCP
Friction
ID
DepthVelocityityVis
=
×
××
2
1500
cos
ANNULAR FRICTION PRESSURE
STEP 1 Annular Fluid Velocity ft/sec
( )
( )( ) SecFt
TbgCsg
BBLGalBPM
Velocity
ODID
Flowrate
/22
/
45.2
42
=
−×
×
STEP 2 Reynolds Number
( )( )
R
CP
TbgCsgFluidPPG
N
ityVis
ODIDVelocityWtFluid
=
−×××
cos
.928
If the Reynolds Number ≥ 2100 the flow is Turbulent – Go to STEP
3
If the Reynolds Number ≤ 2100 the flow is Laminar – Go to STEP
4
52. Well Control During Workovers and
Completions
52
During the course of a workover, a kick can
occur for a variety of reasons. A kick can be
defined as any unwanted intrusion of formation
fluids into the wellbore, and if not detected early
on, and handled properly, most assuredly can
result in a surface blowout.
The main causes of kicks during workovers are:
• Failure to keep the hole full during trips
• Swabbing
• Insufficient fluid weight
• Loss of circulation
Failure to Keep Hole Full During Trips
As a workstring is pulled from the hole, the fluid
level in the well drops due to the displacement
of the workstring. As the fluid level drops
hydrostatic pressure decreases, and if the
hydrostatic pressure of the workover fluid
decreases below formation pressure, formation
fluids will flow into the well.
Kicks During
WorkoversTripping
53. Well Control During Workovers and
Completions
53
Prior to Tripping
Circulate the hole clean prior to the trip.
Calculate the volume required for a slug if one is to be pumped.
Calculate workstring displacement and faithfully record hole fill/displacement data on trip
sheets.
Limit pipe speed to minimize surge/swab pressures – especially when running or pulling
tools with large OD’s such as packers, mills, etc..
Line up and use a trip tank.
Discuss with driller/operator the purpose of trip.
Prepare the rig floor.
Kicks During
WorkoversTripping
Statistics indicate that the most serious well control incidents during
completions and workovers occur while the workstring is being tripped!!
54. Well Control During Workovers and
Completions
54
As a rule of thumb, the slug should be mixed to maintain a
minimum of 2 to 3 stands of dry pipe.
Tripping
Kicks During
Workovers
If a slug is to be pumped consult with the driller or unit operator as to his
knowledge of how well or how poorly the workstring drains. This information can
be used in determining how far down the fluid level should be after the slug has
been pumped and the wellbore is once again stable.
The procedure on the following page will provide information as to the volume of
slug to pump based on the desired dry pipe and the desired slug weight.
Additional information provided is the anticipated displacement created by the
slug.
Tripping should NEVER begin until the well is stabilized after pumping a slug –
otherwise the driller or unit operator has no way of accurately monitoring the
displacement of the workstring.
Slugging
55. Well Control During Workovers and
Completions
55
STEP 1 SLUG LENGTH (ft)
STEP 2 SLUG VOLUME BBL
STEP 3 SLUG DISPLACEMENT BBL
( )
( ) FT
PPGPPG
PPGFt
LengthSlug
WtFluidWtFluidSlug
WtFluidPipeDryDesired
=
−
×
..
.
BBL
Workstring
Ft VolumeSlug
ID
LengthSlug =
×
4.1029
2
BBL
Workstring
FT ntDisplacemeSlug
ID
PipeDryDesired =
×
4.1029
2
Sluggin
g
56. Well Control During Workovers and
Completions
56
Workstring Displacement – Pulling Dry
STEP 1 Workstring Displacement (Per 5 Stands)
DisplacedFTFt BBLWtPipe =×× 450.0003638. /#
The formula above will provide a reasonably accurate displacement volume for
both upset and non upset pipe, including hevi-weight drill pipe and drill collars. If
the workstring is tapered and contains pipe of varying weight, the calculation
above should be performed for each weight category.
The workstring displacement is generally monitored as such:
Workstring or Drill Pipe: 5-stand groups
Hevi-Weight Drill Pipe: 3-stand groups
Drill Collars: 1-stand groups
Total workstring displacement should also be calculated and compared to the
observed displacement on every trip.
Anytime the observed hole fill (when tripping out) or hole flow (when tripping in)
becomes noticeably different from calculated values the trip should be stopped,
the well monitored for flow or loss of fluid, and a reasonable determination made
as to why the well is behaving the way it is. NEVER should a trip proceed with
well experiencing excessive flow or fluid loss.
57. Well Control During Workovers and
Completions
57
Workstring Displacement Per Stand
Workstring Displacement – Pulling Wet
If the workstring becomes plugged and will not drain, then it must be pulled wet.
The following will provide an accurate value for wet displacement. Usually when
pulling wet, the workstring displacement is monitored on a “per stand” basis
regardless of the weight of the pipe or whether the string is tapered or not.
( ) Ft
WorkstringPipe
ft Length
ID
Wt ×
+×
4.1029
0003638.
2
/#
58. Well Control During Workovers and
Completions
58
Trip sheets should be used to record hole fill volumes for all trips. The trip sheet allows for
comparison of actual vs. calculated fluid volumes so that any discrepancies can be easily
detected. A trip tank should also be used during all trips to assist with accurate hole fill
requirements.
A trip sheet need not be a complicated document. Below is an example of a simple trip sheet
that provides the required information to monitor hole fill.
Stand Group Calculated
Displacement
Observed
Displacement
Discrepancy Cumulative
Displacement
Cumulative
Discrepancy
Remarks
Tripping
Kicks During
Workovers
59. Well Control During Workovers and
Completions
59
Trip tanks are the most reliable
means of monitoring pipe
displacement while tripping, however
many smaller workover rigs are not
equipped with trip tanks. An
alternative to this will be discussed
later.
If a trip tank is present on the rig it
should be calibrated based on its
volume and dimensions so that
volume changes can be readily
detected and accurately monitored.
Seen below is an example of a trip
tank. The tank volume should be at
least equal to the total displacement
of the workstring.
Use of a Trip Tank
Tripping
Kicks During
Workovers
60. Well Control During Workovers and
Completions
60
If a trip tank is not calibrated there are easy ways of measuring the change in trip tank level.
Measurements of the tank need to be taken for HEIGHT, WIDTH, and DEPTH (all in feet).
With these measurements the tank volume can be determined as well as inches per bbl and
bbl per inch.
H e i g h t W i d th D e p thF e e t F e e t F e e t× × × .1 7 8 1
T a n k V o l u m e
T a n k H e i g h t
B B L
I n c h e s
T a n k H e i g h t
T a n k V o l u m e
I n c h e s
B B L
Tripping
Kicks During
Workovers
Tank Volume in BBL
BBL Per Inch
Inches Per BBL
Determining Trip Tank Volume
61. Well Control During Workovers and
Completions
61
Occasionally a vertical cylindrical tank (frac tank) is used
as a trip tank. Calculating the volume in this situation is
different from the vertical rectangular tank, but not
difficult. The two dimensions required are the DIAMETER
in inches and the HEIGHT in feet.
Tank Volume in BBL
Tripping
Kicks During
Workovers
Ft
inches
Height
IDTank
×
4.1029
2
T a n k V o l u m e
T a n k H e i g h t
B B L
I n c h e s
T a n k H e i g h t
T a n k V o l u m e
I n c h e s
B B L
BBL Per Inch
Inches Per BBL
Determining Trip Tank Volume
62. Well Control During Workovers and
Completions
62
Tripping
Kicks During
Workovers
What If You Don’t Have A trip Tank
If a trip tank is unavailable on can easily be fashioned from just about anything
that will retain liquid: a 55 gallon drum, a large plastic trash can, etc. The volume
and calibration of these containers can be calculated as explained on the
preceding pages and a trip can be conducted successfully and safely. And
remember, if need be, 8.4 or roughly 8 ½ 5 gallon buckets is a BBL.
There’s really no reason why workstring displacement can not accurately be
monitored during the course of a workover, no matter how ill-equipped the rig.
63. Well Control During Workovers and
Completions
63
Tripping
Kicks During
Workovers
Swabbing
Swab Pressure is a negative pressure created
anytime the workstring is moved in an upward
direction. The magnitude of the swab pressure
created is based on:
Speed of the upward pipe movement
Clearance between the workstring and casing
Workover fluid properties
Excessive swab pressure can cause a dead
well to kick, and if not handled properly can
lead to a surface blowout.
64. Well Control During Workovers and
Completions
64
STEP 1 FORCE AROUND THE WORKSTRING
STEP 3 FORCE AROUND THE DRILL COLLARS
W o r k s t r i n g O D S u r f a c e P S I2
7 8 5 4× ×.
D r i l l C o l l a r O D S u r f a c e P S I2
7 8 5 4× ×.
STEP 2 MINIMUM ALLOWABLE WORKSTRING LENGTH
F o r c e o n W o r k s t r i n g
A d j u s t e d W o r k s t r i n g W e i g h t
F e e t
F T# /
=
STEP 4 MINIMUM ALLOWABLE COLLAR LENGTH
F o r c e o n D r i l l C o l l a r s
D r i l l C o l l a r W e i g h t
F e e t
F T# /
=
If collars are being used
Tripping With The Well
Flowing
Tripping
Kicks During
Workovers
65. Well Control During Workovers and
Completions
65
Estimating the weight of the workstring at any given time during the trip is a
simple matter of adding the weight of the BHA to the weight of the remaining drill
pipe in the hole. The following formula can be used to determine the weight of
each section of the drill string, i.e., tubing and/or BHA.
W e i g h t L e n g t h I n H o l e T o t a l W e i g h tF T L B S# / × =
As stated above, this formula can be applied to both sections of the workstring to
arrive at the weight of each individual section. By adding the total weights of the
two sections one arrives at the weight of the string.
T o t a l W o r k s t r i n g W e i g h t T o t a l C o l l a r W e i g h t S t r i n g W e i g h t+ =
Tripping
Kicks During
Workovers
66. Well Control During Workovers and
Completions
66
Unlike drilling, where mud weights generally increase as the hole is deepened, fluid weight
in a completion or workover is, for the most part, fairly consistent. Should the fluid weight
decrease due to dilution from produced fluids or accidental dilution on the surface, a kick is
liable to occur. The fluid weights should be monitored for proper values at all times during
the workover work.
When using brines the pits should be covered to prevent dilution from ambient humidity. The
higher the brine density the more affinity it will have for fresh water and the more prone it is
to becoming “cut” by the contamination from humidity. Not only this, but a high density brine
can be quite expensive and reconditioning the fluid will be an added cost to the completion
or workover - one which can easily be avoided.
Insufficient Fluid Weight
Loss of Circulation
Another source of a kick, although not as common as the preceding three, is loss of
circulation. When fluid is lost to the hole it is generally assumed to be lost to the producing
formation, and in many cases it is. But this is not always the case. If communication has
been established to an upper zone with a pore pressure greater than the producing
formation, a flow can take place from the invaded zone into the wellbore and into the
producing formation. Not only would a kick be in progress with formation fluids entering the
wellbore, but an underground blowout (zone-to-zone flow) as well. This type of well control
situation can be difficult, at best, to contain and can oftentimes lead to severe damage to
the producing formation, loss of an appreciable amount of production, if not the loss of the
productive interval brought about by the required kill techniques.
Kicks During
WorkoversCauses of Kicks
67. Well Control During Workovers and
Completions
67
Unseating Packers
Several different types of packers may be used in a completion and more than one are
generally left in the hole, especially for the nearly universal gravel-packed producing
zone(s). Therefore a workover usually involves unseating or pulling the seal assembly from
several packers, most of which will have some accumulation of formation fluids trapped
below them.
The fluids accumulate in the dead space between the bottom of the packer rubber and the
topmost opening in the tubing extension below the seal nipples. If the well has not
previously been completely killed on the tubing side, then the entire rat-hole below the
packer may contain formation fluids. If the well makes any gas at all, the trapped volume
will be full of gas because of gravity segregation.
When the packer is unseated or the seals pulled above the packer bore, the trapped gas
escapes into the annulus and starts migrating up the wellbore.
The release of the gas above the packer does not itself threaten to make the well flow at the
moment it occurs because the bottomhole pressure has not been changed significantly.
However there is seldom any immediate surface indication that the trapped gas is there and
the crew may be unaware of the possible danger.
Kicks During
WorkoversCauses of Kicks
68. Well Control During Workovers and
Completions
68
Tripping with Fluid Losses
Fluid losses to the formation are commonplace in workover/completion operations. The rate
of such loss varies with formation permeability, fluid viscosity, degree of overbalance, pipe-
induced pressure surges, and pressures caused by circulation of the wellbore.
These losses add another dangerous dimension to tripping the pipe, already established as
the most kick-prone activity in any oil/gas well operation.
A wide range of viscosifiers and solids are used to control loss rates. In preparation for
tripping, plans generally call for bringing the fluid loss down to a maximum that varies from
10 to 20 barrels per hour, depending on the stage of the completion, formation sensitivity,
and the difficulty of achieving the desired cap without undue formation damage.
If the loss rate, once brought down to an acceptable range, remains consistent while
tripping, monitoring the proper fill on the way out is more straight forward.
Despite the numerous differences between drilling/completion/workover work, the warning
signs that indicate an actual or potential well control problem while tripping are unchanged.
We still watch for a flow, a pit gain, or the hole not taking the right volume. All of these
conditions are much easier to assess if the fluid loss rate is known and stable.
Unfortunately the loss rate can vary with pipe movement itself and the simple passage of
time.
Kicks During
WorkoversCauses of Kicks
69. Well Control During Workovers and
Completions
69
Fishing
Efforts to recover tools or pipe lost in the hole can add to the likelihood of a kick or the
difficulty of controlling one in several ways:
• More trips
• Fish swabbing or interfering with circulation
• Long periods with the hole uncalculated
Fishing by its very nature greatly increases the number of trips. While this is true also of
fishing while drilling, all of the differences described earlier combine to make that increase
more risky in the workover and completion environment.
The fish itself, especially if it includes a packer or a multi-way circulating port, can add
greatly to in-hole pressure surges. If it is blanked off or the fishing tool cannot seal on its
top, the fish becomes a barrier to full-hole circulation - the longer the fish, the greater the
effect.
If the fish is long, or the fishing is done by wireline, the hole may be uncirculated for
extended periods, during which formation fluids may be working in the wellbore where they
cannot be removed. The gas in the hole can migrate during trips and cause well flow.
All of these considerations lean toward the possibility of a kick at that worst possible time -
when the worksting is far off bottom or out of the hole.
Finally, in a prolonged fishing job another disquieting element sneaks into the picture - the
human one. Repetitive trips and concentration on the details of the fishing job itself tend to
develop complacency or at least relaxation of vigilance.
Kicks During
WorkoversCauses of Kicks
70. Well Control During Workovers and
Completions
70
Cleaning Out Fill
Circulating to remove fill from the active wellbore occurs with frequency in completions and
workovers. It is a routine operation in most cases, involving short intervals of loosely
packed sand, scale, coal fill, or other debris following such operations as perforating,
testing, or gravel packing. The fill is merely a temporary impediment to the next step in the
program. It is most often cleaned out and without incident, generally by reversing out under
a closed annular preventer or tubing stripper while lowering the pipe fitted with appropriate
cleanout tools.
However, sometimes the fill results from sanding up of the well while on production or from a
kick that brought formation solids into the wellbore. These problems can effectively seal off
the producing zone from the hole above the fill, possibly at considerable distances off
bottom.
Then when the fill is cleaned out, usually circulating the long way because of the extended
intervals involved, any break in the continuity of the fill can expose trapped formation fluids.
This can lead to repeated requirements to circulate the well clean under the choke or
through a blooie line.
Kicks During
WorkoversCauses of
Kicks
71. Well Control During Workovers and
Completions
71
When a wash tool or muleshoe breaks
completely through the fill it may turn out to
be a bridge a long way off bottom. Under
these conditions a long column of formation
fluids can exist below the bridge, and the
hydrostatic available above the bottom of the
workstring may be inadequate to hold the
formation pressure. The general effect is a
kick off bottom with the rat-hole full of gas
and oil.
On the other hand, if the breakthrough
occurs near enough to the perforations that
the well is considerably overbalanced, the
fluid level in the annulus can drop suddenly
and allow the well to kick. Either way, the
result is an off-bottom kick with
unpredictable lost returns to complicate the
kill.
Cleaning Out Fill
Kicks During
WorkoversCauses of
Kicks
72. Well Control During Workovers and
Completions
72
• Flow increase without an increase in pump
rate
• Pit level increase
• Well flows with the pump off
Flow
Increase
Pit Level Increase Well Flowing With Pumps Off
While Circulating
Kicks During
Workovers
73. Well Control During Workovers and
Completions
73
Kicks During
Workovers
The three main indicators of unintentional
kicks all deal with flow from the formation
into the wellbore.
One common workover procedure deals with
the plugging and abandonment of one zone
and the initiation of production from another.
This is usually done by setting bridge plug
above the zone to be abandoned and then
placing cement on the bridge plug. In other
instances merely a cement plug is placed
across perforations. In either case, it’s
always a good idea to check the well for flow
after waiting for the cement to cure. There is
a possibility for cement contamination from
formation fluids which can prevent the
cement from setting up properly. When this
happens gas can channel its way through
the cement.
If this happens, another cement plug has to
be placed over the failed one. Additionally,
additives should be mixed with the cement to
minimize or inhibit contamination.
74. Well Control During Workovers and
Completions
74
Additional warning signs can appear prior to or in conjunction with a kick.
Gas cutting of the
workover fluid
Kicks During
Workovers
Although gas cutting unto itself is not an
indicative sign of a kick, it should be at
least a warning to the crew that gas has
invaded the wellbore. Gas can reduce
the density of the workover fluid at the
surface because of the expansion of the
gas as it surfaces, but the overall
reduction in hydrostatic pressure is
usually minimal. Which is not to say that
gas breaking out of the fluid at the
surface should be ignored.
75. Well Control During Workovers and
Completions
75
Oil shows in the
workover fluid
Oil shows in the workover fluid will, to a
small degree, reduce the hydrostatic
pressure of the fluid column, but only
minimally so. But like gas, it is a sign
of formation fluid invasion and should
be checked out.
Additional warning signs can appear prior to or in conjunction with a kick.
Kicks During
Workovers
76. Well Control During Workovers and
Completions
76
Prior to beginning the trip, there should be at least one bottoms-up circulation. During this
time the returning fluid density should be checked on a regular basis, every 5 to 10 minutes,
and recorded. Along with this, there should be notes made as to any show of formation
fluids. After the bottoms-up circulation is completed, the well should be allowed to remain
static for a period of time to make sure it’s dead before the trip out begins.
Inadequate Hole Fill During Trips
The most reliable indicator of a well control problem while tripping is fill-up volumes that
don’t correspond, within reason, to calculated values. Should this occur anytime during the
trip, the trip should be stopped and the well monitored closely for flow. And when in doubt,
don’t hesitate to shut-in the well.
If fill-up trends continue to show discrepancies, stop the trip and return to bottom. Once on
bottom be prepared to shut-in the well and circulate the well on a choke.
Likewise when tripping in the hole, the volume being returned due to displacement should be
monitored. If the volume returned is greater than calculated displacement, be prepared to
shut-in.
Well Flowing While The Pipe Is Stationary (Tripping In)
This should be fairly obvious, but all too often, crews get so involved with the business of
tripping in the hole, that the hole can go unmonitored. Flow while the pipe is stationary can
go undetected for quite some time. MONITOR THE DISPLACEMENT TRIPPING IN AND OUT
OF THE WELL.
While Tripping
Kicks During
Workovers
77. Well Control During Workovers and
Completions
77
Shut-In Procedures - On Bottom Circulating – Surface Stack
1. With the pump(s) running, pick up off bottom to pre-determined space off height to
ensure a tool joint is not across the stack.
2. Stop the pump(s) and check for flow.
3. If flow exists, shut-in the top set of pipe rams.
4. Gain casing access by opening the appropriate valve on the choke line side of the
stack.
5. Open the valve downstream of the choke.
6. Record SITP and SICP and estimate of pit gain.
7. At this point, the annular preventer, if one is installed, could be closed and the top
pipe rams opened.
Shut-In Procedures - On Bottom Circulating – Surface Stack
Containing a kick and keeping the influx volume to a minimum can not be overemphasized.
The shut-in, or containment procedures, can vary depending on the type of unit in use, coiled
tubing, snubbing, small tubing, or conventional workover rig and the operation in progress at
the time of the kick - on bottom circulating or tripping. The shut-in procedures given below
will apply to a conventional workover rig and small tubing unit. Containment procedures for
coiled tubing and snubbing units will be handled in their respective chapters.
The shut-in procedures given below are done under the premise of the “hard shut-in.” Due to
the limited wellbore volumes available in a completed well or one being worked over, it is
imperative that minimal time be expended in shutting in a well.
Kicks During
Workovers
78. Well Control During Workovers and
Completions
78
1. Stop the trip and position the pipe ensuring there is not a tool joint across
the stack.
2. Secure the workstring by installing a full opening safety valve - close the
safety valve after installation.
3. Shut-in the top pipe rams.
4. Gain casing access by opening the appropriate valve on the choke line side
of the stack.
5. Open the valve downstream of the choke.
6. Record SICP and estimate of pit gain.
7. Have an inside BOP (workstring check valve) available in case stripping is
required.
8. At this point, the annular preventer, if one is installed, could be closed and
the top pipe rams opened.
Shut-In Procedures While Tripping – Surface Stack
Kicks During
Workovers
79. Well Control During Workovers and
Completions
79
Additional Considerations:
Have crossovers on the floor so that the full opening safety valve and inside BOP can
be installed onto any component of the workstring.
Be familiar with the closing volumes of the preventers to be used.
Visually inspect the BOP stack and choke manifold for leaks shortly after shut-in.
Have someone continuously monitoring and recording shut-in pressures every minute.
Kicks During
Workovers
80. Well Control During Workovers and
Completions
80
Immediately following shut-in, the casing pressure should be monitored and pressure
recorded on a regular basis. Thirty-second intervals would not be unrealistic,
especially if the workover fluid lacks viscosifying agents. Untreated workover fluids
characteristically have little to no static surface tension and therefore gas migration is
certain to occur. Unless the pressure is continually monitored during the first few
minutes after shut-in, it may be impossible to ascertain a stable shut-in casing
pressure which would be the casing pressure to maintain during pump start-up
assuring bottomhole pressure maintenance. With gas migration in progress, a highly
possible outcome could be a bottomhole pressure substantially greater than formation
pressure which could cause a loss of fluid to the perfs, possible damage to the
producing formation, or formation fracture.
PSI
Time
Hypothetical stabilization point
may not be of long duration
Continual pressure
increase due to gas
migration
Kicks During
Workovers
81. Well Control During Workovers and
Completions
81
The illustration at left describes
the pressures at work in a
stabilized shut-in situation. The
total hydrostatic on either side
of the well is imposed upon by
formation pressure. Any
difference, or differential,
appears on the surface and
indicates the amount of
hydrostatic that must be
replaced to at least balance
formation pressure.
Often times in a completion or
workover, there is no SITP,
provided the shut-in took place
properly. The lack of pressure
on the tubing indicates the fluid
density in the tubing at least
balances formation pressure. A
presence of tubing pressure
could be due to trapped
pressure.
Hydrostatic
of Workover
Fluid
Hydrostatic
of Influx
SITP SICP
+ +
+
Formation Pressure Total PressureTotal Pressure
Kicks During
Workovers
Hydrostatic
of Workover
Fluid
82. Well Control During Workovers and
Completions
82
As seen from the previous page, the combination of shut-in pressure and hydrostatic
pressure on either side of the well creates a total pressure equal to formation pressure.
Or in essence, bottomhole pressure equaling formation pressure. Any pressure in the
wellbore which creates a bottomhole pressure in excess of formation pressure would
show up at the surface.
Sources of trapped pressure are:
• The pump inadvertently left running after shut-in
• Pumping into a shut-in well
• Surface pressure increase caused by migrating gas unable to expand
When shut in pressures are initially recorded following stabilization, it’s a good idea to
determine if these pressures are accurate, i.e., representative of just the differential
between formation pressure and wellbore hydrostatics. The following procedure can be
used to detect the presence of trapped pressure and to remedy the situation if any is
found. Perform this only after surface pressures have stabilized.
STEP 1 Bleed a small amount of fluid through the choke (1/4 to 1/2 bbl) - surface
pressures will initially decrease, build, and then stabilize.
STEP 2 Observe SITP - if the SITP stabilized at a value less than the previously
observed stable pressure, trapped pressure was detected and at least, partially
bled off.
STEP 3 Bleed another small amount of fluid through the choke and once again observe
the stabilized SITP.
STEP 4 True, or accurate, SITP is realized when consecutive and identical values
appear on the tubing gauge - in most cases in completions and workovers, the
SITP should bleed to 0 psi.
Kicks During
Workovers
83. Well Control During Workovers and
Completions
83
Kicks During
Workovers
SHUT IN SURFACE PRESSURES
In both cases, the SITP and SICP are measuring the same thing:
Differential pressure between the total hydrostatic pressure on either side of the
well with respect to formation pressure.
In most cases, the casing pressure is greater than the tubing pressure due to the
reduced annular hydrostatic pressure caused by the presence of influx fluid/s
which are of lesser density than the workover fluid.
And as previously stated, in most cases during a workover, the SITP will be 0 psi
because Kill Weight Fluid is already in the wellbore.
If the SITP does not bleed to 0 psi (check the pressure with more than one
pressure gauge), then check the density of the workover fluid – it may have
become inadvertently light because of contamination of excessive formation fluid
or by accidental dillution.
84. Well Control During Workovers and
Completions
84
Shut-in Tubing Pressure is the difference between hydrostatic and formation
pressure.
Kill weight fluid is calculated using the Shut-in Tubing Pressure.
Always round up to next highest tenth ppg.
The following two formulas can be used to calculate Kill Weight Fluid:
Kill Weight Fluid should be the exact fluid weight required to balance
formation pressure (no overbalance margin or safety factor).
Kicks During
Workovers
( ) Pits
Vertical
PSI
WtFluid
DepthPerf
SITP
+
×052.
( )
Pits
Vertical
WtFluid
DepthPerf
SITP
.
23.19
+
×
Either formula will render the same results
85. Well Control During Workovers and
Completions
85
Kicks During
Workovers
Wellbore
Volume
In any well control operation it is necessary to know
the wellbore volume. The following two formulas are
used to accomplish this:
BBLMeasured
Tbg
VolumeLength
ID
=×
4.1029
2
Tubing Volume
Annular Volume
( )
BBLMeasured
TbgCsg
VolumeLength
ODID
=×
−
4.1029
22
86. Well Control During Workovers and
Completions
86
Gas Migration
After a well is shut-in the gaseous phase of the kick can start migrating up the
hole. This is especially true during workovers and completions due to the lack
of viscosity in the workover fluid. Migrating rates can vary from a few hundred
feet per minute upwards to as high as several thousand feet per minute.
If pumping can start soon after the well is shut in and stabilized, gas migration
is not an issue. But if pumping is delayed, for what ever reason, gas will begin
to migrate up the hole. Evidence of migration is steadily increasing surface
pressures.
Gas behaves according to a “pressure-to-volume” relationship:
If exerted pressure increases the volume decreases.
If exerted pressure decreases the volume increases.
If the volume is not allowed to expand, the pressure within the gas
remain unchanged.
87. Well Control During Workovers and
Completions
87
Gas Migration
The following information will be
used to illustrate what can happen to
migrating gas in a well:
Formation Pressure: 5500 psi
Annular Hydrostatic: 5000 psi
Tubing Hydrostatic: 5500 psi
SITP: 0 psi
SICP: 500 psi
0 PSI
500 psi
88. Well Control During Workovers and
Completions
88
Gas Migration
The gas has migrated halfway up the hole but no fluid has been bled
from the well. Since the gas volume has not changed it still contains
its original pressure, in this case, 5500 psi.
5500 psi
2500 psi
hydrostatic above the
gas
2500 psi
hydrostatic below the gas
3000 psi
2500 psi
Bottom hole pressure = 8000 psi
5500
2500 HP
2500 HP
8000 psi
3000 psi
Annulus
5500
HP
8000 psi
2500 psi
Tubing
89. Well Control During Workovers and
Completions
89
Gas Migration
The gas has migrated to the surface- no fluid has been bled from the
well. Since the gas volume has not changed it still contains its original
pressure, in this case, 5500 psi.
5500 psi
5000 psi
hydrostatic below the gas
5500 psi
5000 psi
Bottom hole pressure = 10500 psi
5500
5000 HP
10500
psi
5500 psi
Annulus
5500
HP
10500
psi
5000 psi
Tubing
90. Well Control During Workovers and
Completions
90
Gas Migration
It should be obvious from the preceding two pages that if gas migrates up the
hole in an unexpanded state, bottom hole and surface pressure can increase
dramatically which can lead to excessive fluid loss to the formation and undue
stress on surface pressure control equipment and the casing.
There are two methods available to handle this situation which will maintain
bottom hole pressure equal to, or slightly greater than formation pressure, and
keep surface pressures to a minimum.
The first method involves using the choke to maintain a constant pressure on the
workstring while migration is in progress. The second method, again, involves
using the choke to bleed off measured amounts of fluid along a prescribed
schedule. Neither method is difficult and requires a minimum of equipment.
It should be understood that these methods are to be employed only if pumping is
not possible at the time migration starts, and the methods should be used until
pumping is possible, and at that time, the well put on choke and circulated.
It should also be understood that neither of these two methods will kill the well.
They are simply used to prevent excessive increases in bottom hole and surface
pressures.
91. Well Control During Workovers and
Completions
91
0 psi
500 psi
We’ll use the earlier example to illustrate this
method. The SITP is 0 psi indicating that the
hydrostatic pressure of the fluid in the hole at least
balances the formation pressure. There is pressure
on the casing due to the presence of gas in the
annulus which has decreed the annular hydrostatic.
Gas Migration
Constant Tubing Pressure
92. Well Control During Workovers and
Completions
92
200 psi
700 psi
Gas Migration
Constant Tubing Pressure
MethodShortly after the well is shut in the gas begins to migrate
in an unexpanded state. Evidence of the migration is
seen at the surface by increasing surface pressures.
Since the surface pressure have increase by 100 psi,
bottom hole pressure has also increased by 100 psi.
It’s a good idea to incorporate a small overbalance and
this initial increase in surface pressure can be used for
that. Keep monitoring the tubing pressure as migration
continues. Allow a second pressure increase to take
place. This second increase will be used for bleeding
fluid.
Bottom hole pressure has
increased by 200 psi above
formation pressure
PSI
TIME
Casing
Tubing
200 psi increase
100 psi for overbalance
100 psi for fluid bleeding
0
100
200
300
400
500
600
700
800
93. Well Control During Workovers and
Completions
93
Gas Migration
Constant Tubing Pressure
Method
200 psi
700 psi
Bottom hole pressure has
increased by 200 psi above
formation pressure
PSI
TIME
Casing
Tubing
200 psi increase
100 psi for overbalance
100 psi for fluid
bleeding
0
100
200
300
400
500
600
700
800
Following the initial increase of 200 psi, bleeding can
take place. Fluid is to be bled through a choke from the
annulus side only.
Monitor the casing pressure while bleeding decreasing
the casing pressure by, in this case, 100 psi, then close
the choke. Monitor the tubing pressure. If the bleeding
was performed correctly, the tubing pressure will
decrease by 100 psi and stabilize. Because of the
annular bleeding, annular hydrostatic is now decreased.
This may cause a slight increase in casing pressure.
Fluid bled and
pressures stabilize
94. Well Control During Workovers and
Completions
94
Gas Migration
Constant Tubing Pressure Method
100 psi
620 psi
Bottom hole pressure has
increased by 100 psi above
formation pressure
PSI
TIME
Casing
Tubing
0
100
200
300
400
500
600
700
800
100 psi increase
Migration continues after the first bleeding cycle and
surface pressures have increased by another 100 psi.
Perform another bleeding cycle.
Fluid bled and
pressures stabilize
95. Well Control During Workovers and
Completions
95
Gas Migration
Constant Tubing Pressure Method
PSI
TIME
Casing
Tubing
0
100
200
300
400
500
600
700
800
Continued bleeding cycles would result in what is seen plotted below. Casing
pressure would increase due to the constant decrease in hydrostatic pressure but
tubing pressure would remain essentially constant. This means that bottom hole
pressure is maintained constant at a level just above formation pressure resulting
in minimal fluid loss to the formation.
Gradually increasing casing pressure
Constant tubing pressure
96. Well Control During Workovers and
Completions
96
Gas Migration
Volumetric Method
0 psi
500 psi
Obstruction in tubing
In this situation a kick has been taken but
due to an obstruction in the tubing,
circulation is impossible. Shortly following
shut in the gas begins to migrate. Because
of the obstruction there is no tubing
pressure to monitor, and the Constant
Tubing Pressure Method can not be used
on the annulus because of its ever-
changing hydrostatic pressure caused by
the required bleeding.
The method used to handle this situation is
called the Volumetric Method.
97. Well Control During Workovers and
Completions
97
Gas Migration
Volumetric Method
The Volumetric Method is used when pumping is impossible due to an obstruction
in the workstring. In this situation the casing pressure would increase but the
tubing pressure would remain at 0 psi.
Similar to the Constant Tubing Pressure Method, the annular surface pressure is
allowed to increase by an overbalance and an amount used for bleeding.
However, in this case, the volume to bleed from the annulus is calculated based
on the surface pressure increase, the wellbore geometry at the point where fluid
is leaving the annulus, and the density of the fluid in the hole. The following is
used to calculate this volume.
( )
BleedtoBBL
WtFluidODID
IncreasePSI
TbgCsg
=
××− .052.
4.1029
22
98. Well Control During Workovers and
Completions
98
Gas Migration
0 psi
700 psi
PSI
TIME
200 psi increase
100 psi for overbalance
100 psi for fluid bleeding
0
100
200
300
400
500
600
700
800
900
1000
1100
1200
Similar to the Constant Tubing Pressure Method, surface
pressure is allowed to increase for an overbalance and an
amount used for bleeding. In this case, 100 psi increments will
be used again.
Information for an example calculation is as follows:
Csg ID: 5.125”
Tbg OD: 2.875”
Fluid Wt. 10.4 ppg
Volumetric Method
99. Well Control During Workovers and
Completions
99
Gas Migration
( )
BBL
psi
323.3
4.10052.875.2125.5
5.1029
100
22
≈=
××−
Volumetric Method
The calculated volume is rounded off to
accommodate rig equipment and volumes that can be
realistically measured.
PSI
TIME/BBL BLED
200 psi increase
100 psi for overbalance
100 psi for fluid bleeding
0
100
200
300
400
500
600
700
800
900
1000
1100
1200
During the first cycle three bbl of fluid is to be bled from the annulus through
the choke while maintaining a constant casing pressure. The length of time
required for this depends on the migration rate of the gas.
After bleeding the calculated volume the choke is closed and casing pressure
is monitored while migration progresses. Another 100 psi increase would
signal the beginning of the second cycle.
First bleeding cycle
100. Well Control During Workovers and
Completions
100
Gas Migration
Volumetric Method
PSI
0
100
200
300
400
500
600
700
800
900
1000
1100
1200
The second cycle take place with the bleeding of 3 bbl of fluid from the annulus while
holding the casing pressure constant. The procedure continues until gas reaches the surface
or when pumping is possible. If gas reaches the surface the casing pressure should be
monitored. As long as casing pressure increases continue the bleeding procedures. Casing
pressure will finally peak when all the gas reaches the surface when migration stops.
TIME/BBL BLED
Second bleeding cycle
Once gas reaches the surface, it should be either
circulated out or removed by lubrication and bleeding.
The gas should not be bled without replacing it with
fluid. Doing so would create a serious well control
situation that could lead to a surface blowout.
101. Well Control During Workovers and
Completions
101
Example:
A 100 psi surface pressure increase has taken place in 45 minutes. The fluid in the hole is
8.5 ppg water. Based on this the migration rate can be calculated as such:
Gas Migration
Gas Migration Rate
( ) HrFt
Hours
RateMigration
TimeWtFluid
IncreasePSI
/
.052.
=
××
( ) FeetMigrated
WtFluid
IncreasePSI
=
×052.
( ) HrFt
Hoursppg
psi
/30265.301
75.5.8052.
100
≈=
××
( ) Feet
ppg
psi
22624.226
5.8052.
100
≈=
×
If the tubing is obstructed it may be desired to find the depth of the obstruction with wireline
and possibly remove it or perforate above the obstruction in order to kill the well by
circulation. The following two formulas can be used to determine the depth of the bottom of
the gas and how fast or slow the gas is moving up the hole. If it is decided to perforate the
tubing, make sure the perforation occurs below the kick to prevent contamination of the
workstring fluid.
102. Well Control During Workovers and
Completions
102
Gas Migration
Uncontrolled Gas
Expansion
All kick management methods, circulating and non-circulating, deal with controlling gas
expansion in a wellbore, and for good reason - uncontrolled gas expansion can be
catastrophic which is why there should be constant and consistent monitoring of pit levels,
return flow rates, and fluid density.
Gas expansion is affected by the following:
Pressure exerted on the gas
Gas volume
Temperature
For simplicity temperature will be ignored in this example of uncontrolled gas expansion.
Gas expansion can be described by the following relationship:
2
1
P
P P1 - initial pressure exerted on the
gas
P2 - new pressure exerted on the gas
103. Well Control During Workovers and
Completions
103
Gas Migration
Uncontrolled Gas
Expansion
The following information will be used to
illustrate the potential for uncontrolled gas
expansion:
Well Depth: 10000 feet
Fluid Weight: 9.5 ppg
Kick Volume: 10 bbl
Casing ID: 5 ¼”
104. Well Control During Workovers and
Completions
104
Gas Migration
Uncontrolled Gas
Expansion
The initial pressure exerted on the gas is a combination of wellbore hydrostatic
pressure and surface pressure.
Length of the Gas
'373'47.37310
25.5
4.1029
2
≈=×
KickBBL
Length & Hydrostatic Pressure of Fluid Above the
Gas
FeetGasofFtFT 962737310000 =−
PSIFeetPPG 47567.475596275.9052. ≈=×× P1 = 4756PSI
As the gas moves up the hole the hydrostatic pressure above the gas decreases
thus allowing the gas to expand.
105. Well Control During Workovers and
Completions
105
Gas Migration
Uncontrolled Gas
Expansion
The gas has migrated up the hole to the depth
of 5000’. The expanded gas volume is
calculated as follows:
( ) BBLBBL
FeetPPG
PSI
25.1910
50005.9052.
4756
=×
××
BBLVolumeKickInitial
P
P
×
2
1
The gas moved halfway up the hole and almost
doubled in volume.
106. Well Control During Workovers and
Completions
106
Gas Migration
Uncontrolled Gas
Expansion
The gas is now at a depth of 2500 feet. The
expanded gas volume is calculated based on
the initial pressure versus the new pressure
exerted on the gas.
( ) BBLBBLBBL
FeetPPG
PSI
3951.3810
25005.9052.
4756
≈=×
××
Based on the reduction in hydrostatic pressure
above the gas it has expanded almost 4 times
its initial volume.
107. Well Control During Workovers and
Completions
107
Gas Migration
Uncontrolled Gas
Expansion
The gas is now at the surface where the only
pressure exerted on the gas is atmospheric
pressure. The expanded volume of the gas is:
BBLBBL
PSI
PSI
3245.32310
7.14
4756
≈=×
In thus case the uncontrolled gas expansion
exceeds the wellbore volume. Hopefully, if gas
enters a wellbore and starts to migrate or is
circulated up the hole and expands, the
displacement of fluid caused by this expansion
will be noticed by someone on location and
appropriate actions taken. Otherwise the well
will surely blowout.
108. Well Control During Workovers and
Completions
108
A method of killing a well should allow for regaining control of the well without doing harm to the producing
formation, and should also exert a bottom hole pressure that is at least equal to, or slightly greater than
formation pressure. As previously stated, the SITP is used as a bottom hole pressure gauge and is
indicative of any existing differential between formation pressure and the fluid hydrostatic in the workstring.
A pressure existing on the tubing gauge indicates the required additional hydrostatic pressure needed to
balance formation pressure, and this additional hydrostatic is converted into its equivalent in mud weight via
the kill weight mud formula.
SITP > 0 psi means the fluid weight must be increased
(with the tubing at or very near bottom)
There are two methods available to use if the condition exists dictating a fluid weight increase:
Wait & Weight Method
This method is, in theory, a one-circulation kill method. The crew “waits” until the fluid is at the proper kill
“weight” and then pumps kill weight fluid only with no additional safety factors in the form of additional
weight. The overbalance at the bottom of the hole is provided by annular friction once circulation is under
way. In most cases this method creates the least amount of wellbore stress and the lowest ultimate annular
surface pressure.
Constant Pump Pressure
The Driller’s Method is designed to be a two-circulation kill operation. During the first bottoms-up circulation
the kick is pumped from the well. Fluid weight is increased during this time and is pumped into the well on
the second circulation. Like the Wait & Weight, an overbalance is provided for at the bottom of the hole in
the form of annular friction pressure. This method usually creates higher wellbore stresses and higher
ultimate annular surface pressure than the Wait & Weight. One advantage of the method is that circulation
can begin shortly after shut-in pressures have stabilized.
Circulating Kill Techniques
109. Well Control During Workovers and
Completions
109
If there is no pressure on the tubing with the bit at or near bottom, no differential
exists and no fluid weight increase is needed.
SITP = 0 psi means no fluid weight increase
In this instance, with no SITP, the Constant Pump Pressure method is used,
which is exactly what needs to take place. The pump pressure is held constant
while the well is circulated at a steady rate. After bottoms-up is achieved, the
well should be dead. Prudence however, dictates that the well be circulated for a
while longer just to make sure the annulus is completely free of influx.
SITP > 0 psi
Wait & Weight Method
Concerns about ultimate annular surface pressure (gas kick)
Driller’s Method
Desire to begin killing shortly after surface pressure
stabilization
SITP = 0 psi
Constant Pump Pressure
Kill the well at a constant pump pressure and pump rate
Circulating Kill Techniques
110. Well Control During Workovers and
Completions
110
Circulating Kill Techniques
Constant Pump Pressure
By far the most commonly used circulation method is Constant Pump Pressure. Its
name implies exactly what is to be done – maintain a constant pump pressure, at
a constant pump rate, once the well is successfully brought on choke.
To bring the well on choke perform the following:
STEP 1 Observe and record the SICP
STEP 2 Crack the choke and bring the pump online.
STEP 3 While bringing the pump up to the selected kill rate, manipulate the
choke to maintain a constant casing pressure.
STEP 4 After the pump is at the kill rate, manipulate the choke to maintain a
constant pump pressure until the well is dead.
111. Well Control During Workovers and
Completions
111
The Wait and Weight Method gets it’s name from the fact that there is a
“waiting” time while the mud weight is increased or “weighted” up prior to
circulating the influx from the hole. The W & W Method is only required for
killing a kick that requires a heavier fluid weight (called the kill weight fluid).
Generally the well can be killed in one complete circulation. But, since it is only
recommended to use a balancing kill fluid weight, additional circulation will be
required to increase the fluid weight by a suitable safety factor after the well is
dead.
Advantages Include
Pressures exerted on the wellbore and on control equipment will generally
be lower than when using the Driller’s Method. The difference is most
significant if the influx is gas, and/or large volume kicks.
The maximum pressure exerted on the wellbore is the lowest is can be
The maximum annular surface pressure is as low as possible given the
situation
The well will be under pressure for less time.
Circulating Kill Techniques
Wait & Weight Method
112. Well Control During Workovers and
Completions
112
1. Determine a suitable circulation rate.
The upper limit for the circulation rate is generally set by the maximum allowable
annular friction pressure such that extreme ECD’s are not created.
2. Kill Weight Fluid (KWF).
The kill weight fluid, which is a known value. The fluid in the pits must be weighted-up
to the Kill Weight.
3. Calculate the workstring and annulus volumes and Surface to Bit and
bottoms up pump strokes.
The workstring and annular volumes need be known to determine where the influx and kill
weight fluid is within the circulation path during the well kill. This data is usually obtained
from the completed kill sheet.
Vertical and Low Angle Wells
Circulating Kill Techniques
StrokesTotal
OutputPump
VolumeWellbore
STKBBL
BBL
=
/
113. Well Control During Workovers and
Completions
113
4. Calculate the anticipated Initial Circulating Pressure (ICP).
The ICP should be calculated in order to estimate the circulating pressure that will be
required to maintain constant BHP at the start of the well kill.
5. Calculate the Final Circulating Pressure (FCP).
As the workstring is displaced with kill weight fluid, the circulating standpipe pressure
must be reduced to take into account the increased hydrostatic pressure of the mud in
the pipe. The standpipe pressure must also compensate for the increase in friction
pressure due to pumping a heavier weight fluid.
Once the workstring is completely displaced with KWM, the static workstring pressure
should be zero. The required circulating standpipe pressure at this point is just the
SCR pressure adjusted for the KWF.
6. Construct a circulating drillpipe pressure schedule vs. pump strokes.
The choke operator needs to manipulate the control choke to follow the schedule of
circulating drillpipe pressure (required to maintain constant BHP) verses the
accumulated pump strokes during the well kill. This will ensure the well kill is going
smoothly and help identify any potential problems that may occur.
Vertical and Low Angle Wells
Circulating Kill Techniques
114. Well Control During Workovers and
Completions
114
1. Bring pump on line as per Pump Start-up
procedure.
2. Compare the actual Initial Circulating Pressure to
that shown (calculated) on the Tbg. Pressure
Schedule. Re-construct the Tbg. Circulating
Schedule if necessary.
3. Adjust the choke as necessary to control the
drillpipe pressure according to the schedule.
Continue until kill weight fluid returns to the
surface.
Always be alert to potential problems. If
ANY problem is suspected, STOP the pump
and CLOSE the well in.
4. Stop the pump and close the choke. SITP and the
SICP should be equal or nearly equal to zero. If
so, open choke and check for flow. If not, bring
pump back on line and circulate through the
choke to further condition the mud.
Pump
Strokes
Circ.
Pressure (psi)
0 ICP (psi)
FCP (psi)
Strokes
To Bit
(1)
(2)
(3)
(4)
(5)
(6)
(7)
(8)
(10)
(9)
Circulating Pressure Schedule
Vertical and Low Angle Wells
Circulating Kill Techniques
115. Well Control During Workovers and
Completions
115
Choke and Standpipe Pressure
WELL DATA:
Well depth 11,480 ft BHA 6 ½”, 591 ft
Shoe depth 6,560 ft Pipe 5” OD DP
MW 14.2 ppg Method Driller’s
Kick EMW 15.2 ppg Influx 20 bbls gas
SIDPP 600 psi SCR 500 psi @ 30 spm
Volume Pumped (bbls)
SurfacePressure(ps
drillpipe
Volume 800600400200
SCR
SIDPP
Annulus
Volume
200
400
600
800
1000
1200
1600
1400
1800
Choke Pressure (W and M
Method)
Choke Pressure (Driller’s Method)
SCR (FCP)
Stand Pipe Pressure
A B
C
D
E
Circulating Kill Techniques
116. Well Control During Workovers and
Completions
116
1. Bring pump on line as per Pump Start-up.
2. Compare the actual Initial Circulating Pressure to the
pre-calculated ICP. If the actual measured ICP is
greater that the pre-calculated ICP, correct the kill
sheet and use the actual ICP.
If the actual ICP is less than the calculated ICP,
stop the pump and close the well in. Determine
if there are any problems in the circulating
system.
3. Adjust the choke as necessary to control drillpipe
pressure constant until all influx is circulated from
well.
Always be alert to potential problems. If ANY
problem is suspected, STOP the pump and
CLOSE the well in.
4. Stop the pump and close the choke. SITP and SICP
should be equal or near equal. If so (and necessary),
then kill the well using the W & W method. If not,
bring the pump back on line and circulate through
choke to condition wellbore fluids.
Circulating Kill Techniques
117. Well Control During Workovers and
Completions
117Volume Pumped (bbls)
Pressure(psi)
1800
1600
1400
1200
1000
800
600
400
200
200 400 600 800
Stand Pipe Pressure
Choke Pressure
A
B
C
D
E
First Circulation - Choke and Standpipe Pressure
WELL DATA:
Well depth 11,480 ft BHA 6 ½”, 591 ft
Shoe depth 6,560 ft Pipe 5” OD DP
MW 14.2 ppg Method Driller’s
Kick EMW 15.2 ppg Influx 20 bbls gas
SIDPP 600 psi SCR 500 psi @ 30 spm
Circulating Kill Techniques
118. Well Control During Workovers and
Completions
118
Second Circulation - Choke and Standpipe Pressure
Volume Pumped (bbls)
SurfacePumped(psi)
SCR
SIDPP
drillpipe
Volume
Annulus
Volume 800600400200
200
400
600
800
1000
1200
1600
1400
1800
SCR2
Stand Pipe Pressure
Choke Pressure
WELL DATA:
Well depth 11,480 ft BHA 6 ½”, 591 ft
Shoe depth 6,560 ft Pipe 5” OD DP
MW 14.2 ppg Method Driller’s
Kick EMW 15.2 ppg Influx 20 bbls gas
SIDPP 600 psi SCR 500 psi @ 30 spm
Circulating Kill Techniques
119. Well Control During Workovers and
Completions
119
Pump Operator
1. Begin slow and easy; it should take at least a full minute to bring the pump up to the planned kill rate.
2. Monitor the pump rate increase and drillpipe and casing pressures. Communicate these values to the Choke
Operator.
3. Pump pressure should rise steadily and casing pressure should remain relatively constant. If any unusual pressure
behavior is seen - stop pumping and communicate to the Choke Operator to close-in the well.
Choke Operator's Responsibilities
1. Upon word from the Pump Operator that the pump has started, crack open the choke slightly and monitor the
drillpipe and casing pressures.
2. As the pump comes up to kill rate, adjust choke as necessary to control casing pressure constant at the shut-in
value until the pump is up to desired kill rate.
3. Be aware of unusual pressure behavior and communicate to the Pump Operator the drillpipe and casing pressures.
Be prepared to instruct the Pump Operator to shut down the pump if unusual pressures are seen.
4. When the pump has reached the proper kill rate, continue to control casing pressure constant until the casing and
drillpipe pressures have stabilized.
5. Record drillpipe pressure as the correct Initial Circulating Pressure (ICP). Compare it to the pre-calculated ICP
value.
Note: If actual ICP is greater than the calculated ICP, use the actual ICP and correct same on the Kill Sheet.
If the actual ICP is less than the calculated ICP, stop the pumps, close in the well and determine if a problem
exists in the circulating system. Then retry bringing the pump on line.
Circulating Kill Techniques
120. Well Control During Workovers and
Completions
120
WELL DATA:
Well depth 11,480 ft BHA 6 ½”, 591 ft
Shoe depth 6,560 ft Pipe 5” OD DP
MW 14.2 ppg Method Driller’s
Kick EMW 15.2 ppg Influx 20, 30, 40, 50 bbls gas
200
400
600
800
1000
1200
1600
1400
1800
Volume Pumped (bbls)
ChokePressure(psi)
800600400200
20 BBLS
30 BBLS
40 BBLS
50 BBLS
Driller’s Method for Various Influx Volumes
Circulating Kill Techniques
121. Well Control During Workovers and
Completions
121
Wait and Weight Method for Various Influx Volumes
WELL DATA:
Well depth 11,480 ft BHA 6 ½”, 591 ft
Shoe depth 6,560 ft Pipe 5” OD DP
MW 14.2 ppg Method Wait and Weight
ChokePressure(psi)
20 BBLS
30 BBLS
40 BBLS
50 BBLS
200
400
600
800
1000
1200
1600
1400
1800
Volume Pumped (bbls)
800600400200
Circulating Kill Techniques
122. Well Control During Workovers and
Completions
122
Precautions When
ReversingAlthough reversing out is a common procedure in some operations, considerable forethought should be
given to reversing out a kick, especially a gas kick. The choke pressure profiles seen on pages 18 and 19
reflect the required surface pressure supplied by the choke to make up for the lack of hydrostatic pressure
in the annulus. And as seen in the illustrations, the trend is for back pressure to increase. This is expected
given the expansion of the gas that has to be allowed. With gas expansion comes a decrease in overall
annular hydrostatic pressure thus the required increase in back pressure.
20 BBLS
30 BBLS
40 BBLS
50 BBLS
Volume Pumped (bbls)
Required choke pressure is
increasing due to gas expansion
which causes a decrease in
annular hydrostatic pressure
Required Back Pressure
Circulating Kill Techniques
123. Well Control During Workovers and
Completions
123
Occasionally the decision is made to reverse out a kick - reasons being:
To minimize contamination of expensive workover fluid
Limit or minimize ultimate pressure on the casing due to a large influx
Save time
As long as the kick fluid is liquid, or primarily liquid, risks are minimal, but if the
kick is predominantly gas, there are specific items to consider, namely the
potentially rapid change in surface pressures and the equipment used when the
reverse procedure is implemented.
The well diagram on the following page will be used as an example to illustrate
the differences between normal and reverse circulation where a gas kick is
concerned.
Reversing Out Kicks
Circulating Kill Techniques
124. Well Control During Workovers and
Completions
124
0 psi 407 psi
WELL DATA
10000’ 2 7/8” TBG - 58 BBL Vol.
10000’ 5.5” ID Csg - 214 BBL
Form Press EMW: 10 ppg = 5200 psi
Kick Volume: 20 bbl
Kick Length: 936’
Kick Hydrostatic Pressure: 94 psi
Fluid Weight: 10.3 ppg
SITP: 0 psi
SICP: 407 psi
Reversing Out Kicks
Circulating Kill Techniques
The information below will be used as baseline data for the
example of comparing normal and reverse circulation of a gas
kick in a workover environment.
Stabilized Shut-in
Conditions
Editor's Notes
Lecture:
Lecture:
Lecture:
Step1 - Prior to selecting “desired value” - set a pressure limit to minimize risk of formation damage or excessive fluid loss
Step 2 - If formation drinks, pressure will fall to stabilized value. Use that for “P2” - not theoretical value. Also - consider reducing amount of increase on next cycle.
Step 3 - P3 becomes P1 for next cycle
Lecture:
Bullet 2 Such as when waiting to increase mud weight or when shut down for bad weather
Bullet 3: If Maasp a concern - use low end of range (50 psi)
Lecture
Bullet 3 - Additional circulating time may be required to circulate mud with added safety margin.
Lecture:
Pt. A = SICP
A to B = Kill mud displaced in drillpipe - casing pressure same as in driller's
Gas expanding (and lengthening) as it moves uphole
Pt B = Kill weight mud starts up annulus
From this point on all annulus pressures lower than driller's
B to C = Gas continues expanding and lengthening (dashed line)
Note annulus pressure lower than driller's (solid line)
D to E = Original mud behind influx displaced out until point E
Pt E = Kill mud arrives at choke
Lecture:
Pt. A = SICP
A to B = Drop in cp as influx shortens when leaving bha annulus
B to D = Gas expanding (and lengthening) as it moves uphole
Choke pressure required to balance kick zone pressure increases
Choke operator closing to maintain correct DPP
At point C - gas length same as when shut-in around bha)
Pt. D = Gas arrives at choke
Choke operator closes to ensure choke pressure doesn't drop
significantly as gas passes across choke
D to E - Gas vented from well
PHyd of mud column increasing to replace exiting gas
Choke operator opens to reduce back pressure to maintain correct DPP
Pt. E - Gas out of well
Choke press. will stabilize to value determined by original underbalance
Lecture:
Well circulated to kill weight during this circulation
First establish correct ICP
Then reduce standpipe pressure as dp displaced to kill wt. (accd to DPP schedule)
Little choke manipulation while kill weight pumped down dp
Once kill weight starts up annulus, choke is opened to maintain correct FCP
Once hole displaced to kill weight, choke pressure to maintain FCP will be zero.
In practice, choke wide open and may not be possible to keep standpipe pressure down to FCP
Lecture:
Lecture:
Dip in wait and weight curves due to added Phyd of kill mud
Note that in driller's method , maximum pressure always higher