Download as PDF, PPTX
![a)
b) c)
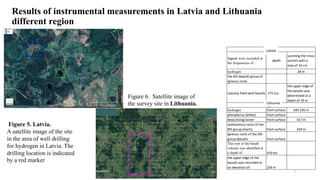
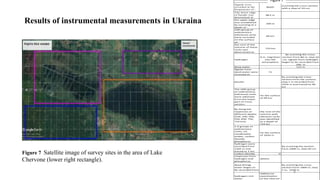
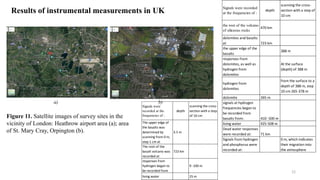
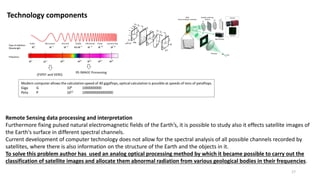
Results of instrumental measurements in
UK & Scotland
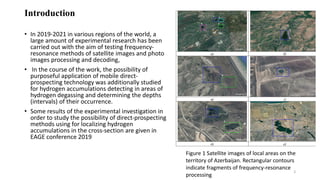
Figure 12. Areas of investigation in England: photograph of
Doune Hill and Moorland in Scotland [2] (a); satellite
image of a well at Preston New Road (Lancashire) (b);
photographs of crop circles in England [5] (c).
The results of frequency-resonance processing of satellite
images and photographs of areas of peat bogs in Rivne
and Chernigov regions in Ukraine showed that they are
all located above basalt volcanoes, in the contours of
which hydrogen migrates into the atmosphere
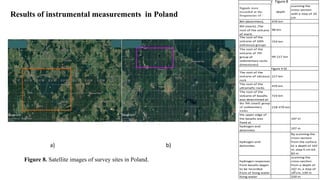
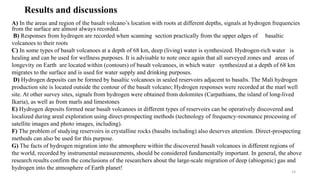
Drilling site in England. During processing a satellite image of a well
for shale gas location in England (figure 8b), responses from
hydrogen and basalts were also recorded. Signals from basalts were
recorded up to 95 km
Signals were
recorded at the
frequencies of :
depth
scanning the
cross-section
with a step of 10
cm
a volcano filled
with sedimentary
rocks of the 9th
group (marls). The
root of the volcano
was identified at:
723 km
Signals from
basalts were
recorded in
4.8-98000 m.
responses from the
9th group of
sedimentary rocks
(marls)
98-723
km
hydrogen from
basalts began to be
recorded from
6 m
living wate 7.5 m
Peatland site in Scotland
Crop circles in England.
On the surface of 0 m
from the upper part of
cross-section, responses
from hydrogen and
phosphorus were
recorded for all circles,
which indicate of these
elements’ migration into
the atmosphere within
areas of circles location
13](https://image.slidesharecdn.com/presentation1finalshortened-220828192009-122dbb9f/85/Presentation1-final-shortened-pdf-13-320.jpg)

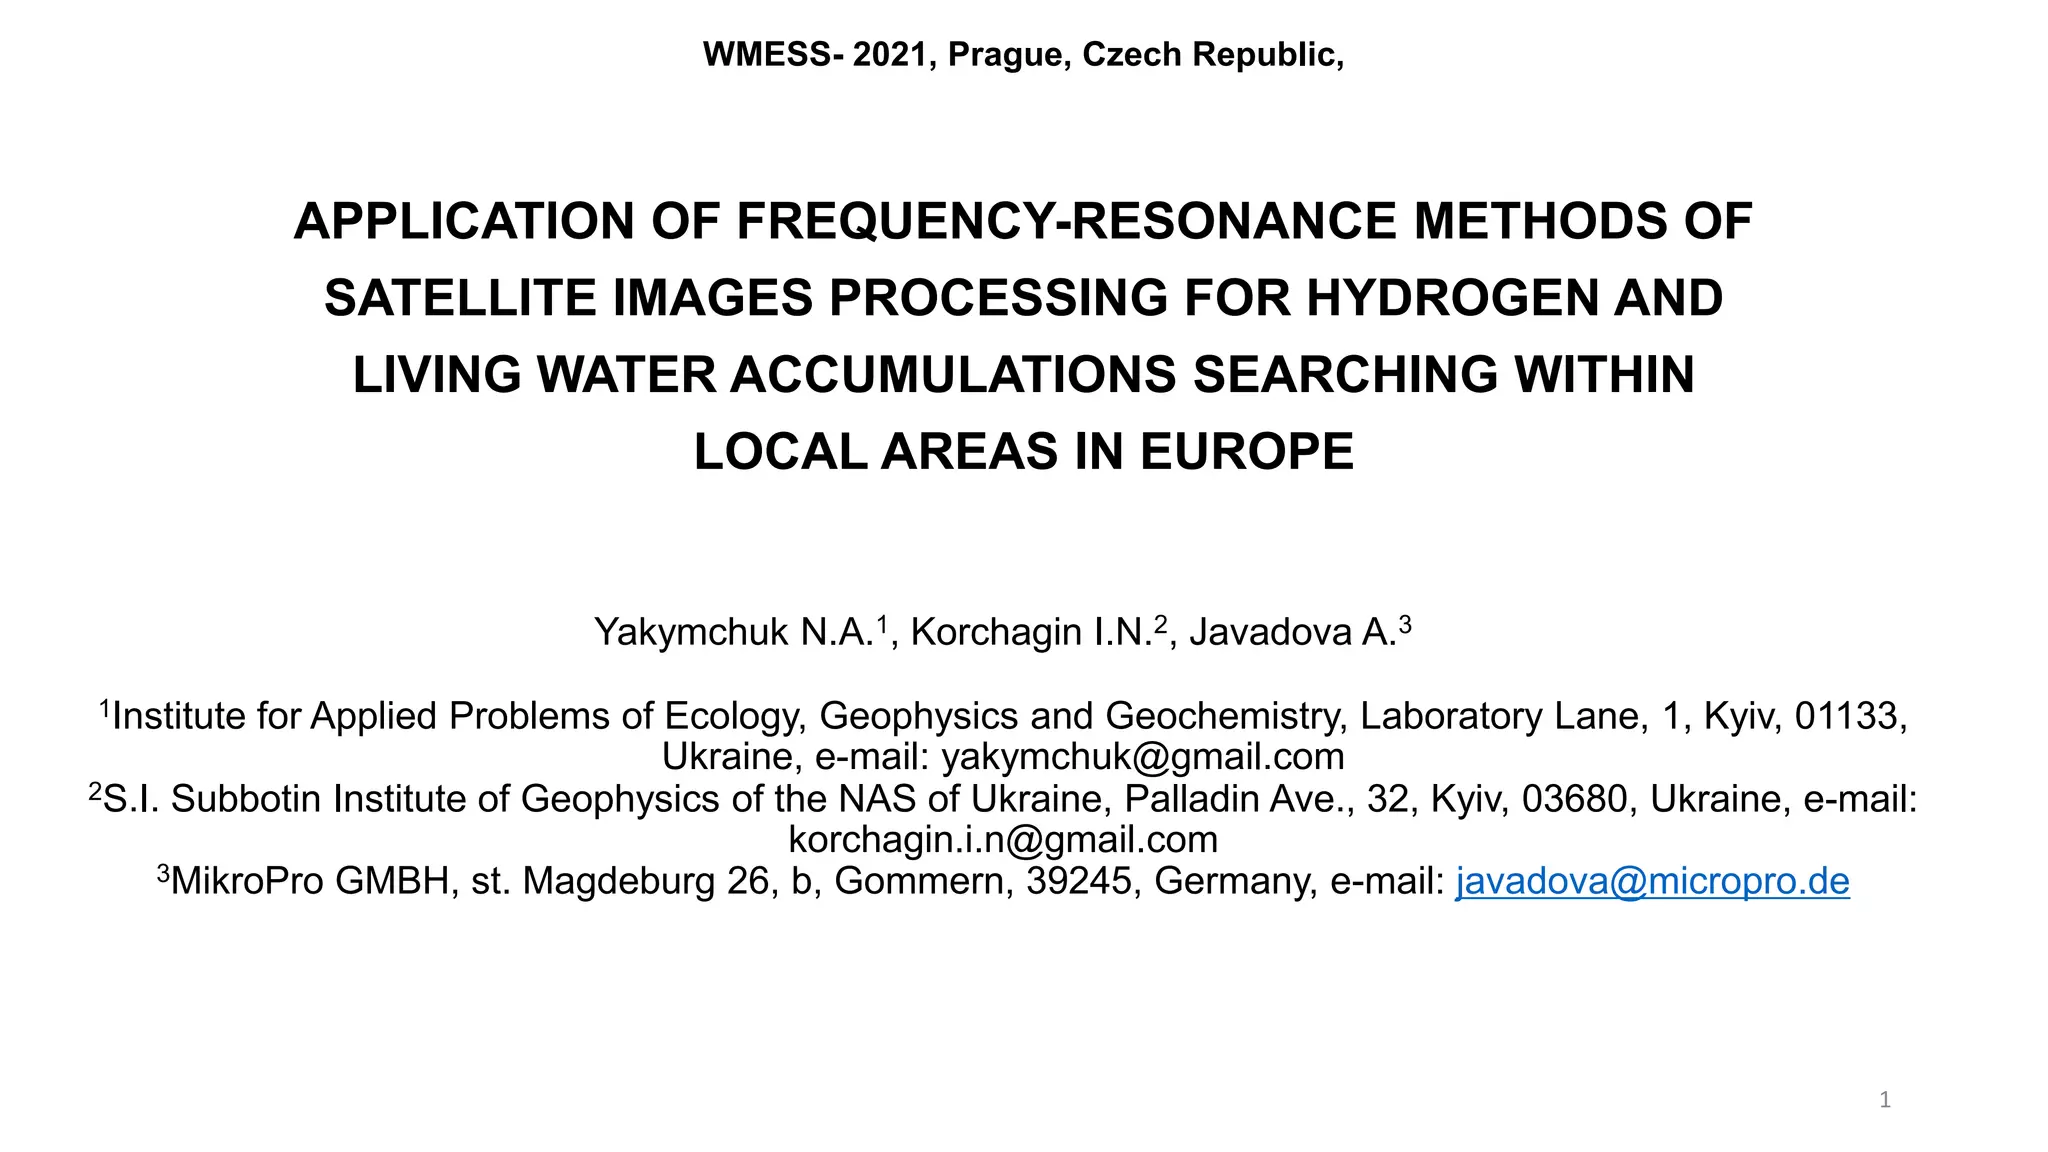
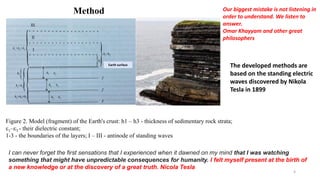
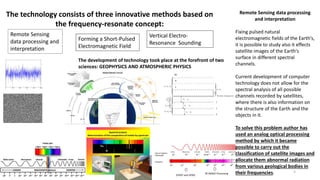
The document discusses the application of frequency-resonance methods for processing satellite images to detect hydrogen and living water accumulations across various regions in Europe. It highlights past research on natural hydrogen sources, the technology developed for detection, and experimental results from several locations including Latvia, Lithuania, and Greece. The findings emphasize the potential for discovering and localizing hydrogen deposits using innovative geological methodologies.


![Getting Started with Apache Spark: Big Data Made Simple [Free Meetup]](https://cdn.slidesharecdn.com/ss_thumbnails/apachesparkgettingstarted-260203175547-8361bcc3-thumbnail.jpg?width=640&height=640&fit=bounds)


