QNBFS Weekly Market Report April 27, 2017
•
0 likes•83 views

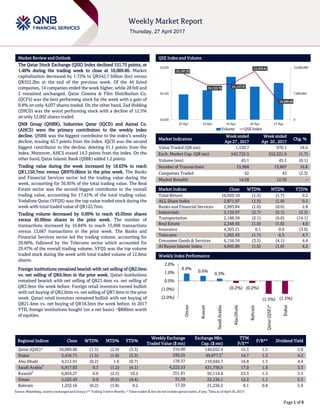
The Qatar Stock Exchange (QSE) Index declined 151.75 points, or 1.48% during the trading week to close at 10,089.86.

Recommended
Recommended
More Related Content
What's hot
What's hot (20)
Similar to QNBFS Weekly Market Report April 27, 2017
Similar to QNBFS Weekly Market Report April 27, 2017 (20)
More from QNB Group
More from QNB Group (20)
Recently uploaded
Recently uploaded (20)
QNBFS Weekly Market Report April 27, 2017
- 1. ` Page 1 of 9 Market Review and Outlook QSE Index and Volume The Qatar Stock Exchange (QSE) Index declined 151.75 points, or 1.48% during the trading week to close at 10,089.86. Market capitalization decreased by 1.72% to QR542.7 billion (bn) versus QR552.2bn at the end of the previous week. Of the 44 listed companies, 14 companies ended the week higher, while 28 fell and 2 remained unchanged. Qatar Cinema & Film Distribution Co. (QCFS) was the best performing stock for the week with a gain of 8.8% on only 4,037 shares traded. On the other hand, Zad Holding (ZHCD) was the worst performing stock with a decline of 12.5% on only 12,002 shares traded. QNB Group (QNBK), Industries Qatar (IQCD) and Aamal Co. (AHCS) were the primary contributors to the weekly index decline. QNBK was the biggest contributor to the index’s weekly decline, erasing 42.7 points from the index. IQCD was the second biggest contributor to the decline, deleting 41.1 points from the index. Moreover, AHCS erased 14.3 points from the index. On the other hand, Qatar Islamic Bank (QIBK) added 1.2 points. Trading value during the week increased by 18.63% to reach QR1,150.7mn versus QR970.06mn in the prior week. The Banks and Financial Services sector led the trading value during the week, accounting for 36.95% of the total trading value. The Real Estate sector was the second biggest contributor to the overall trading value, accounting for 17.41% of the total trading value. Vodafone Qatar (VFQS) was the top value traded stock during the week with total traded value of QR122.7mn. Trading volume decreased by 0.09% to reach 45.05mn shares versus 45.09mn shares in the prior week. The number of transactions increased by 16.84% to reach 15,968 transactions versus 13,667 transactions in the prior week. The Banks and Financial Services sector led the trading volume, accounting for 29.68%, followed by the Telecoms sector which accounted for 29.47% of the overall trading volume. VFQS was the top volume traded stock during the week with total traded volume of 12.8mn shares. Foreign institutions remained bearish with net selling of QR2.0mn vs. net selling of QR6.9mn in the prior week. Qatari institutions remained bearish with net selling of QR21.4mn vs. net selling of QR3.9mn the week before. Foreign retail investors turned bullish with net buying of QR2.0mn vs. net selling of QR7.6mn in the prior week. Qatari retail investors remained bullish with net buying of QR21.4mn vs. net buying of QR18.3mn the week before. In 2017 YTD, foreign institutions bought (on a net basis) ~$800mn worth of equities. Market Indicators Week ended Apr 27 , 2017 Week ended Apr 20 , 2017 Chg. % Value Traded (QR mn) 1,150.7 970.1 18.6 Exch. Market Cap. (QR mn) 542,725.5 552,221.6 (1.7) Volume (mn) 45.1 45.1 (0.1) Number of Transactions 15,968 13,667 16.8 Companies Traded 42 43 (2.3) Market Breadth 14:28 12:30 – Market Indices Close WTD% MTD% YTD% Total Return 16,920.10 (1.5) (1.7) 0.2 ALL Share Index 2,871.97 (1.5) (1.8) 0.1 Banks and Financial Services 2,993.84 (1.0) (0.6) 2.8 Industrials 3,132.97 (2.7) (5.1) (5.3) Transportation 2,188.58 (2.1) (6.0) (14.1) Real Estate 2,348.45 (1.0) (1.6) 4.6 Insurance 4,303.21 0.1 0.6 (3.0) Telecoms 1,262.43 (1.7) 6.3 4.7 Consumer Goods & Services 6,156.54 (3.5) (4.1) 4.4 Al Rayan Islamic Index 4,045.89 (1.6) (1.8) 4.2 Market Indices Weekly Index Performance Regional Indices Close WTD% MTD% YTD% Weekly Exchange Traded Value ($ mn) Exchange Mkt. Cap. ($ mn) TTM P/E** P/B** Dividend Yield Qatar (QSE)* 10,089.86 (1.5) (2.9) (3.3) 316.00 149,032.4 15.3 1.5 3.8 Dubai 3,416.71 (1.5) (1.8) (3.2) 330.25 99,877.5# 14.7 1.3 4.2 Abu Dhabi 4,512.91 (0.2) 1.6 (0.7) 178.37 119,044.7 16.8 1.3 4.4 Saudi Arabia# 6,917.03 0.3 (1.2) (4.1) 4,222.53 431,758.5 17.0 1.6 3.3 Kuwait# 6,854.27 0.6 (2.5) 19.2 251.81 92,114.8 23.3 1.3 3.5 Oman 5,525.43 0.9 (0.5) (4.4) 31.59 22,136.1 12.2 1.1 5.3 Bahrain 1,332.16 (0.2) (1.8) 9.2 17.20 21,336.5 8.1 0.8 5.9 Source: Bloomberg, country exchanges and Zawya (** Trailing Twelve Months; * Value traded ($ mn) do not include special trades, if any; # Data as of April 26, 2017) 10,197.33 10,153.76 10,157.37 10,205.61 10,089.86 0 7,000,000 14,000,000 10,020 10,120 10,220 23-Apr 24-Apr 25-Apr 26-Apr 27-Apr Volume QSE Index 0.9% 0.6% 0.3% (0.2%) (0.2%) (1.5%) (1.5%)(2.0%) (1.0%) 0.0% 1.0% 2.0% Oman Kuwait SaudiArabia AbuDhabi Bahrain Qatar(QSE)* Dubai
- 2. Page 2 of 9 News Economic & Corporate News KPMG: GCC value-added tax framework provides roadmap for Qatar – Following the release of the unified agreement for value-added tax (VAT) for the Gulf Cooperation Council (GCC) countries by Saudi Arabia, Philippe Norré, Head (Indirect Taxes) at KPMG in Qatar, stated, “This milestone was paving the way for the implementation of VAT in 2018.” It also provides companies with a sufficiently detailed framework to start preparation for VAT in 2018; manage risks and capture optimization opportunities. In principle, VAT will be levied on the supply of goods and services at a standard rate of 5%. Certain supplies of goods and services are to be zero-rated or VAT exempt (not taxable but also with no right to recover VAT paid). Based on the framework agreement, each GCC member state (including Qatar) will now need to issue its own domestic legislation to locally implement VAT. Norré also anticipates that the authorities in Qatar, having been part of all GCC level discussions, will prepare and release the local legislation on VAT in time for implementation of VAT in 2018. Norré said, “VAT will impact all businesses in Qatar and outside Qatar, either directly or indirectly. Today, companies need to think carefully about their procurement processes, operating models, customer and suppliers’ alignment, legal structure and systems to be well prepared for this significant development that is set to change the business landscape. But the upcoming changes not only raise a need for risk management, they also allow companies to implement steps around cost, process and systems optimization.” (Gulf-Times.com) BMI: Qatar to outperform GCC peers on advantage of diversification – According to BMI, Qatar is slated to outperform the other Gulf Cooperation Council (GCC) countries on its first-mover advantage in diversification, and that the oil price recovery will support the GCC, enabling the governments ease their austerity drive to help boost investors and consumers’ sentiments. Highlighting that the implementation and progress of the diversification plans greatly vary across countries, BMI said the countries that are the most advanced in the process, namely the UAE and Qatar, would benefit from a first-mover advantage and outperform their peers. Forecasting Qatar’s real gross domestic product growth of 3.5% in 2017 and 3.7% in 2018, underpinned by heavy sovereign infrastructure investment, ahead of 2022 FIFA World Cup, BMI said, “Doha is looking to use the competition as a catalyst for wider economic diversification, and improved infrastructure and the increased international exposure that comes with the event will indeed help it develop non-hydrocarbons sectors such as tourism, finance and education.” (Gulf-Times.com) VAT expected to lift Qatar's revenue from 1 to 2% of GDP – Qatar, along with other GCC countries, expects that the introduction of Value Added Tax (VAT) would help grow the revenues of the respective countries at a significant rate. Gulf countries are working towards introducing a harmonized VAT in 2018. In a statement at the just concluded International Monetary and Financial Committee’s (IMFC) 35th meeting in Washington, the 13-member Qatar Group Countries said VAT could raise revenues anywhere from 1 to 2% of GDP. Addressing the Washington meet on behalf of the 13-member Group, the UAE Minister of State for Finance, Obaid Humaid Al Tayer said despite the recent price pick up in oil prices has provided some relief, oil-exporting countries have intensified their efforts to adjust their economies to persistently low oil prices. These efforts have typically involved a mix of higher taxes with cuts in public expenditure, including to the subsidy bill, prioritized investments geared toward diversification, and financing to allow a gradual adjustment path. (Peninsula Qatar) QFC Authority: Big growth potential in global Islamic banking market – The size of the Shari’ah-compliant banking and financial market, which has grown to nearly $2tn, has great untapped growth potential, as a significant number of Muslim population still do not have access to interest-free financing services, noted a top official of Qatar Financial Centre (QFC) Authority. Dr Haitham Al Salama Chief Economic Advisor at QFC Authority, was speaking on the rise of Islamic Finance across the globe at “Islamic Fintech: Are Islamic banks Ready to be disruptive?” at a panel discussion of Thomson Reuters Future of Technology event. Dr Haitham said, “Islamic finance has enjoyed double digit growth rates over the past decade, and the total asset of the sector has reached $2tn globally. The world's Muslim population of around 1.6bn has low access to financial services, which presents a big growth potential for the sector.” He also highlighted how Fintech is disrupting the industry, adding, “Fintech is expected to change the traditional models of Islamic financial services and support the sector growth by creating new instruments, increasing efficiency and reducing the cost of operations. It will also improve access and therefore, increase the asset base of the sector.” (Peninsula Qatar) Qatar Petroleum-ExxonMobil’s GPP gets green signal for LNG export to NFTA countries – Qatar Petroleum announced that Golden Pass Products (GPP) has received authorization from the US Department of Energy to export LNG to Non-Free Trade Agreement countries. Golden Pass Products, which is developing the LNG export project, is owned by affiliates of Qatar Petroleum and ExxonMobil, who are world leaders in the LNG business with Qatar Petroleum being the largest LNG exporter in the world. Qatar Petroleum President and CEO Saad Sherida Al Kaabi said, “This approval marks an important milestone for the project, in which both shareholders have invested significant efforts, and sets the stage to help meet the world’s growing need for clean energy.” Al Kaabi added, “I would like to take this opportunity to thank the United States Department of Energy and all concerned authorities for their support." Al-Kaabi said, "Today’s announcement paves the way for further progress in the Golden Pass export project towards a final investment decision in 2018, and I would like to take this opportunity to thank our partner ExxonMobil and the employees of Golden Pass for their efforts in this direction.” (Gulf-Times.com) QNCD reduces price of cement products – Qatar National Cement Company (QNCD) has decided to reduce the factory price for its various cement products. The new rates came into effect on April 25, the company said. QNCD General Manager Mohamed Ali al-Sulaiti said the board of directors at its
- 3. Page 3 of 9 meeting in Doha on April 25, decided to introduce discounted prices for cement produced by the company "as part of its keenness to increase its participation in the local market and develop the construction sector in the country." Accordingly, the loose regular cement would be sold at the factory for QR230 a ton (QR250 earlier), the resistant cement QR250 a ton (QR270 earlier), QR11 for the bag of regular cement (QR13 earlier), and QR12 for the bag of resistant cement (QR14 earlier). However, al-Sulaiti pointed out that prices would not change for the other products of the company, according to the board's decision. (Gulf-Times.com) AHCS' bottom line increases 8.6% QoQ in 1Q2017 – Aamal Company’s (AHCS) bottom-line increased 8.6% QoQ to QR114.53mn in 1Q2017. However, on YoY basis, net profit fell 11.4%. EPS amounted to QR0.18 in 1Q2017 as compared to QR0.21 in 1Q2016. The company's revenue came in at QR830.83mn in 1Q2017, registering a decline of 0.7% QoQ. However, on YoY basis, revenue rose 22.3%. AHCS’ Chairman HE Sheikh Faisal bin Qassim al-Thani said, “The 1Q2017 has seen our revenues grow very strongly, by more than 22%; this has been driven by a combination of both organic and acquisition means following an upping of our stake in El Sewedy Cables through our 50% owned joint venture, Senyar Industries.” According to AHCS Vice Chairman and Managing Director Sheikh Mohamed bin Faisal al-Thani, with currently over 35% of the company’s net profit derived from industrial manufacturing, “we are well placed to continue to be one of the winners as Qatar continues to diversify away from being a hydrocarbon based economy through an intensive government-driven infrastructure development program, as laid out in the country’s 2030 Vision and accelerated by the FIFA World Cup due to be held in 2022.” Net capital investment expenditure fell to QR25.1mm in 1Q2017 as compared to QR46.3mn in 1Q2016, reflecting the 1Q2016 fleet expansion at the Aamal maritime transportation services subsidiary, the company’s spokesman said, adding the group’s financing gearing (net debt to net debt plus equity) reduced further to 0.4%.Total assets were valued at QR10.1bn comprising current assets of QR2.41bn and non-current assets of QR7.69bn. The company’s total equity stood at QR8.45bn on capital base of QR6.3bn at the end of March 31, 2017. (QSE, Gulf-Times.com) ORDS reports ~QR584mn net profit in 1Q2017 – Ooredoo (ORDS) reported net profit of ~QR584mn in 1Q2017 as compared to QR360.79mn in 4Q2016. EPS amounted to QR1.82 in 1Q2017 as compared to QR2.74 in 1Q2016. ORDS said the group revenue increased to QR8bn, an improvement of 2% YoY. In local currency terms, growth was driven by Ooredoo Qatar, Indosat Ooredoo, Ooredoo Oman, Ooredoo Tunisia, Ooredoo Myanmar and Ooredoo Maldives. ORDS said “Excluding foreign exchange translation impact, revenues would have increased by 3% YoY.” ORDS said data revenue increased to 43% of group revenue and attributed it to “continued strong data growth” from consumer and enterprise customers. Revenue from data contributed QR3.5bn in 1Q2017. The company’s customer base increased by 26% to reach 149mn, driven by strong growth across major markets. In Qatar, the number of ORDS customers remained stable at 3.5mn. ORDS’ Chairman HE Sheikh Abdulla bin Mohamed bin Saud al-Thani said “Our relentless focus on the digital strategy and delivering world-class infrastructure and innovative products is paying dividends. Another milestone in our digital strategy was the launch of our 4.5G Pro network in Qatar in February. We are one of the first operators globally to offer this cutting edge technology, which increases mobile data speeds to up to 800 Mbps.” (QSE, Gulf-Times.com) QFBQ’s net loss narrows significantly to QR9.56mn in 1Q2017 – Qatar First Bank (QFBQ) reported net loss of QR9.56mn in 1Q2017 compared to net loss of QR269.07mn in 4Q2016 and QR19.60mn in 1Q2016. The bank reported revenues of QR121.5mn in 1Q2017. QFBQ’s Acting CEO Khaled Abdullah al-Khoori said, “We envision that the global economic backdrop will remain challenging for the remainder of this year; however, we will continue to push ahead to develop innovative financial solutions and source attractive investment opportunities for our individual and institutional clients.” Total assets were down 3% to QR5.8bn compared to year-end 2016. However, the investment portfolio expanded 14% YoY and the Sukuk book by 14%. The bank’s income from placement with financial institutions grew 46% YoY, mainly from cash deployment in Shari’ah-compliant money market funds, and income from financing assets by 42% to record additional income of QR6mn. On the private equity front, QFBQ’s investments in Memorial Healthcare Group, one of Turkey’s largest premier hospital chains, achieved healthy growth on revenue and EBITDA levels, both growing 10% YoY, and benefiting from a relatively stable currency fluctuation. (QSE, Gulf-Times.com) IQCD reports net profit of QR927.94mn in 1Q2017, in line with our estimate – Industries Qatar (IQCD) reported net profit of QR927.94mn in 1Q2017 (as compared to QR229.93mn in 4Q2016 & QR697.03mn in 1Q2016), in line with our estimate of QR891.36mn (+4.1% variation). Earnings per share fell to QR1.53 in 1Q2017 from QR1.15 in 1Q2016, in-line with our estimate of QR1.47. An IQCD spokesman said, the QoQ improvement was mainly due to the absence of one-off expenses in 1Q2017. He added, “The YoY improvement (in 2017) was primarily due to a recovery in the product prices, as 1Q2016 witnessed significantly lower prices due to the depressed economic environment prevailing at that time, and there was also reduced operating costs.” Highlighting that all segments reported improved performance, although the performance in some segments, in particular the polyethylene segment, was affected due to some unplanned outages, the spokesman said the 1Q2017 financial performance far exceeded the group’s budget expectations. IQCD reported revenue of QR1.11bn in 1Q2017, marginally down on YoY basis, owing to a slight decrease in the sales volumes. The group’s financial position, as measured by the asset levels, liquidity and debt position continue to remain strong as cash across the group stands at a solid QR9.9bn after paying 2016 dividend of QR2.4bn. Outlining that total debt stood at QR2.8bn, down QR0.1bn versus December 31, 2016, which exhibited the group’s strong leverage position, the spokesman said “this stable financial position re-affirms the group’s ability to withstand tough trading conditions.” Total assets were valued at QR33.35bn, comprising current assets of QR8.85bn and non-current assets of QR24.5bn. The company’s total
- 4. Page 4 of 9 equity stood at QR31.99bn on a capital base of QR6.05bn. (QNBFS Research, QSE, Gulf-Times.com) QIIK reports ~QR236.5mn net profit in 1Q2017; in-line with our estimate – Qatar International Islamic Bank (QIIK) reported net profit of ~QR236.5mn in 1Q2016 (as compared to QR118.37mn in 4Q2016), in-line with our estimate of QR228.91mn (+3.3% variation). Earnings per share amounted to QR1.56 in 1Q2017 (as compared to QR1.47 in 1Q2016), in- line with our estimate of QR1.51. QIIK’s CEO Abdulbasit Ahmad al-Shaibei said, “The total revenues of the bank at the end of the first quarter of 2017 amounted to QR460mn compared to QR400mn during the corresponding period of 2016, which indicates a growth rate of 15%”. He added, “Total assets at the end of the first quarter rose by 10% and reached QR45.3bn compared to QR41.3bn during the same period of 2016. The size of the bank’s financing portfolio increased by the end of the first quarter to reach QR29.3bn compared to QR25.7bn at the end of the first quarter 2016, representing a growth rate of 14%.” Al-Shaibei said the level of QIIK’s non- performing assets is now at 1.84%. At the same time, the bank has maintained its operating efficiency (cost-to-income ratio), which reached 25.4% in 1Q2017. The bank’s total deposits rose to QR28.7bn at the end of March 31, 2017 as compared with QR27.8bn at the end of March 31, 2016. The capital adequacy ratio (Basel III) reached 17.85%, which confirms the strong financial position of the bank, according to Al-Shaibei. (QNBFS Research, QSE, Gulf-Times.com) BRES reports QR479.43mn net profit in 1Q2017 – Barwa Real Estate Company (BRES) reported net profit of QR479.43mn in 1Q2017 as compared to QR107.67mn in 4Q2016. However on YoY basis net profit declined 26.4%. EPS amounted to QR1.23 in 1Q2017 as compared to QR1.67 in 1Q2016. BRES said the decrease in the net profit resulted from a few non-recurring items like revaluation gain from investment properties and other income. However, the group has succeeded in enhancing its operating income by increasing its net rental income by QR38mn with a 20% YoY increase. The group has also succeeded in decreasing the general and administrative expenses by 6% YoY. BRES further stated “The financial results of the group reflect Barwa’s concern of moving towards achieving its objectives of sustainable growth for its shareholders through supporting its assets via new operational projects, and at the same time to work on enhancing the efficiency of current operating projects. In addition to that, Barwa is working on enforcing the principle of partnership with the State of Qatar through developing a number of projects such as the Mustawdaat project and Madinat Al Mawater project.” In 1Q2017, the company had seen the commencement of operations of the Shell employees housing complex at Al Khor. (QSE, Gulf-Times.com) QATI's net profit declines 6.7% QoQ in 1Q2017 – Qatar Insurance Company’s (QATI) net profit declined 6.7% QoQ (- 6.3% YoY) to QR301.51mn in 1Q2017. The company's net earned premiums came in at QR1.90bn in 1Q2017, which represents a decrease of 26.4% QoQ. However, on YoY basis, net earned premiums rose 11.5%. EPS amounted to QR1.09 in 1Q2017 as compared to QR1.16 in 1Q2016. On the back of solid expansion across its key geographical markets, lines of business and client segments, QATI’s performance and pace of premium growth for 1Q2017 are in line with the company’s expectations, its spokesman said. The group was successful at delivering a stable performance due to steady flow of income which stemmed from its prudent underwriting and investment prowess. Despite economic downturn and market volatility, QATI recorded 15% YoY growth in gross written premium (GWP) to QR3.09bn in 1Q2017. Key contributors to the growth in GWP can be attributed to the group’s global reinsurance and specialty insurance subsidiaries, namely, Qatar Re and Antares in addition to its life and medical insurance subsidiary, QLM. The group’s international subsidiaries in Bermuda, London and Malta reported 37% growth and now account for about 69% of its total GWP. The group has renewed its focus on streamlining operations for achieving enhanced operational efficiency with the administrative expense ratio for its core operations at 8.5% at the end of March 31, 2017. (QSE, Gulf-Times.com) MARK’s reports flattish net profit QoQ in 1Q2017, in-line with our estimate – Masraf Al Rayan (MARK) reported flattish QoQ (-6.5% YoY) net profit of QR510.25mn (in-line with our estimate of QR512.76mn). MARK’s bottom-line was impacted by a surge in opex and week non-funded income. Excluding one-off item (QR46.54mn) in 1Q2016, net profit increased by 2.3% YoY. The bank’s total assets stood at QR94.38bn at the end of March 31, 2017, up 3.1% YTD (+8.2% YoY). The bank’s financing assets were largely flat YTD (-0.2%) at QR67.51bn, while customer deposits stood at QR63.07bn, up 8.7% YTD (+12.4% YoY), at the end of March 31, 2017. As such, the bank’s LDR improved, dropping to 107% vs. 117% at the end of 2016. The asset quality (both financing and investments) continues to be one of the highest in the region and globally, maintaining a non–performing financing ratio of 0.16%, a bank spokesman said. On the profitability indicators, MARK continued to maintain its leading position with annualized return on average assets at 2.20% and annualized return on average equity at 16.72%, despite the depositors’ share of profits increasing by 45.1% due to higher cost of customer deposits at local and international levels. The lender’s capital adequacy ratio, using Basel III standards and the Qatar Central Bank regulations, reached 19.46% at the end of March 31, 2017 compared to 18.41% at the end of March 31, 2016. MARK continues to lead the banking sector with one of the best operational efficiency ratio (cost-to-income ratio) of 21.64% against its peers in the market. (QNBFS Research, QSE, Gulf- Times.com) QNNS reports ~QR236mn net profit in 1Q2017; bang in-line with our estimate – Qatar Navigation (QNNS) reported net profit of ~QR236mn in 1Q2017, bang in line with our estimate of QR236.06mn. The company had reported a net loss of QR47.27mn in 4Q2016 and net profit of QR351.79mn in 1Q2016. Operating revenues stood at QR648mn in 1Q2017 as compared to QR767mn in 1Q2016. Operating profit came in at QR185mn in 1Q2017 as compared to QR256mn in 1Q2016. EPS declined to QR2.08 in 1Q2017 (from QR3.10 in 1Q2016), in line with our estimate of QR2.06. QNNS, which also goes by the name ‘Milaha’, said its Maritime & Logistics’ net profit declined by QR14mn, mainly as a result of continued rate pressure in the container shipping unit. Milaha Gas & Petrochem’s net profit declined by QR46mn as a result of a global downturn in shipping rates that impacted all major sectors the company
- 5. Page 5 of 9 operates in. Milaha Offshore’s net profit decreased by QR25mn, with QR22mn of that related to impairments. Milaha Capital’s net profit decreased by QR21mn, mainly due to impairments in available for sale investments. “We are continuing to face the same market challenges as in 2016, but we remain confident in our ability to drive growth and capitalize on new opportunities while exercising financial discipline,” Sheikh Ali bin Jassim Al Thani, Chairman of QNNS’ Board of Directors, stated. QNNS’ President and CEO Abdulrahman Essa Al-Mannai said “Given the difficult environment we are working in, we posted solid operational results. We will continue moving ahead with our multi-year growth strategy to build a stronger and more sustainable business.” (QNBFS Research, QSE, Peninsula Qatar) QGTS' net profit declines 7.4% QoQ in 1Q2017, in line with our estimate – Qatar Gas Transport Company's (QGTS) net profit declined 7.4% QoQ to QR191.06mn in 1Q2017, in-line with our estimate of QR179.69mn (+6.3% variation). The company's adjusted revenue (QNBFS calculated) declined to QR858.60mn in 1Q2017 (-11.5% QoQ and -3.3% YoY), in line with our estimate of QR904.04mn (5.0% variation). EPS amounted to QR0.34 in 1Q2017 as compared to QR0.43 in 1Q2016. A QGTS spokesman said, “The lower profit in 1Q2017 is attributed to the effect of reducing estimated scrap value of vessels in accordance with applicable international accounting standards, in addition to the reduced operations of a few joint ventures, due to the current economic conditions in the global market.” He said QGTS maintained a “stable” operational performance owing to the prudence and effectiveness of the company’s strategies, adding that this comes in view of steady cash flow through its strategic long-term charter agreements with financially strong charterers, thus ensuring that its core business of gas transportation remains “buoyant”. QGTS’ Managing Director Abdullah Fadhalah al-Sulaiti said, “Despite the current economic downturn and market volatility, the company has been continuously improving its operational activities which is demonstrated by the successful transition of two vessels in 1Q2017, bringing total vessels operated by the company to 14 vessels to-date.” Of the total revenue in 1Q2017, a bulk (86%) or QR752.6mn came from revenue from wholly-owned vessels; share of results from joint ventures were to the tune of QR83.83mn; income from marine and agency services QR13.32mn and interest, dividend and profit from Islamic banks were QR16.61mn. Total assets were valued at QR30.23bn, comprising current assets of QR3.09bn and non- current assets of QR27.14bn at the end of March 31, 2017. (QNBFS Research, QSE, Gulf-Times.com)
- 6. Page 6 of 9 Qatar Stock Exchange Top Gainers Top Decliners Source: Qatar Stock Exchange (QSE) Source: Qatar Stock Exchange (QSE) Most Active Shares by Value (QR Million) Most Active Shares by Volume (Million) Source: Qatar Stock Exchange (QSE) Source: Qatar Stock Exchange (QSE) Investor Trading Percentage to Total Value Traded Net Traded Value by Nationality (QR Million) Source: Qatar Stock Exchange (QSE) Source: Qatar Stock Exchange (QSE) 8.8% 8.2% 2.6% 1.8% 1.6% 0.0% 3.0% 6.0% 9.0% Qatar Cinema & Film Distribution Dlala Holding Al Khaleej Takaful Insurance Qatar Islamic Insurance Mesaieed Petrochemical Holding Company -12.5% -6.2% -5.9% -5.1% -5.0% -15.0% -10.0% -5.0% 0.0% Zad Holding MazayaQatar IslamicHolding Group QatarFuel Aamal 122.7 97.8 91.1 85.7 73.1 0.0 50.0 100.0 150.0 Vodafone Qatar QNB Group Industries Qatar Ezdan Real Estate Masraf Al Rayan 12.8 5.6 3.0 2.9 2.6 0.0 5.0 10.0 15.0 Vodafone Qatar Ezdan Real Estate Mazaya Qatar Dlala Holding Qatar First Bank 0% 20% 40% 60% 80% 100% Buy Sell 43.77% 41.92% 21.42% 23.28% 10.12% 9.94% 24.69% 24.87% Qatari Individuals Qatari Institutions Non-Qatari Individuals Non-Qatari Institutions 750 401 750 401 (0) 0 (200) - 200 400 600 800 Qatari Non-Qatari Net Investment Total Sold Total Bought
- 7. Page 7 of 9 TECHNICAL ANALYSIS OF THE QSE INDEX Source: Bloomberg The Index closed another week in the red; it lost 151.75 points (-1.48%). The Index is moving back under its moving averages and the MACD is now below the zero line, indicating further possible weakness to expect. Our support level remains at the 9,700 level and the resistance at the 11,500 level. DEFINITIONS OF KEY TERMS USED IN TECHNICAL ANALYSIS RSI (Relative Strength Index) indicator – RSI is a momentum oscillator that measures the speed and change of price movements. The RSI oscillates between 0 to 100. The index is deemed to be overbought once the RSI approaches the 70 level, indicating that a correction is likely. On the other hand, if the RSI approaches 30, it is an indication that the index may be getting oversold and therefore likely to bounce back. MACD (Moving Average Convergence Divergence) indicator – The indicator consists of the MACD line and a signal line. The divergence or the convergence of the MACD line with the signal line indicates the strength in the momentum during the uptrend or downtrend, as the case may be. When the MACD crosses the signal line from below and trades above it, it gives a positive indication. The reverse is the situation for a bearish trend. Candlestick chart – A candlestick chart is a price chart that displays the high, low, open, and close for a security. The ‘body’ of the chart is portion between the open and close price, while the high and low intraday movements form the ‘shadow’. The candlestick may represent any time frame. We use a one-day candlestick chart (every candlestick represents one trading day) in our analysis. Doji candlestick pattern – A Doji candlestick is formed when a security's open and close are practically equal. The pattern indicates indecisiveness, and based on preceding price actions and future confirmation, may indicate a bullish or bearish trend reversal. Shooting Star/Inverted Hammer candlestick patterns – These candlestick patterns have a small real body (open price and close price are near to each other), and a long upper shadow (large intraday movement on the upside). The Shooting Star is a bearish reversal pattern that forms after a rally. The Inverted Hammer looks exactly like a Shooting Star, but forms after a downtrend. Inverted Hammers represent a potential bullish trend reversal.
- 8. Page 8 of 9 Source: Bloomberg Company Name Price April 27 % Change WTD % Change YTD Market Cap. QR Million TTM P/E P/B Div. Yield Qatar National Bank 143.80 (2.71) (2.90) 132,820 10.6 2.2 2.2 Qatar Islamic Bank 101.00 1.20 (2.79) 23,866 11.6 1.7 4.7 Commercial Bank of Qatar 29.95 0.17 (3.24) 12,122 95.0 0.7 N/A Doha Bank 31.30 0.32 (7.12) 8,087 9.8 0.9 9.3 Al Ahli Bank 35.45 0.00 (4.56) 7,102 11.2 1.5 2.7 Qatar International Islamic Bank 62.80 0.32 0.00 9,506 11.9 1.4 6.4 Masraf Al Rayan 41.85 (0.12) 11.30 31,388 15.4 2.7 4.8 Al Khalij Commercial Bank 14.63 (0.27) (13.94) 5,267 12.1 0.8 5.1 Qatar First Bank 8.55 (2.51) (16.99) 1,710 N/A 1.0 N/A National Leasing 17.22 (2.55) 12.40 852 169.0 0.8 2.9 Dlala Holding 25.00 8.23 16.33 710 52.4 2.7 N/A Qatar & Oman Investment 9.53 (1.75) (4.22) 300 26.9 1.0 5.2 Islamic Holding Group 61.00 (5.86) 0.00 345 66.2 2.5 1.6 Banking and Financial Services 234,075 Zad Holding 74.60 (12.54) (16.37) 976 9.6 1.1 6.0 Qatar German Co. for Medical Devices 9.39 (1.57) (7.03) 108 N/A 1.4 N/A Salam International Investment 10.50 0.38 (4.98) 1,200 10.5 0.7 7.6 Medicare Group 97.00 (4.53) 54.21 2,730 39.5 2.7 1.9 Qatar Cinema & Film Distribution 35.90 8.79 30.78 225 58.9 1.7 2.8 Qatar Fuel 128.00 (5.11) (4.04) 12,726 15.6 1.8 5.0 Widam Food Co. 64.00 (0.78) (5.88) 1,152 N/A 3.8 5.5 Mannai Corp. 78.50 (0.38) (1.88) 3,581 7.2 1.4 5.1 Al Meera Consumer Goods 156.90 (2.00) (10.60) 3,138 16.5 2.5 5.7 Consumer Goods and Services 25,838 Qatar Industrial Manufacturing 43.45 0.81 (2.36) 2,065 10.6 1.3 6.9 Qatar National Cement 75.60 (1.95) (3.30) 4,941 11.3 1.7 4.8 Industries Qatar 104.30 (3.87) (11.23) 63,102 19.8 2.0 3.8 Qatari Investors Group 57.00 (4.36) (2.56) 7,087 24.7 2.8 1.8 Qatar Electricity and Water 208.00 (0.48) (8.37) 22,880 14.8 2.9 3.6 Aamal 13.26 (4.95) (2.71) 8,354 18.7 1.0 4.5 Gulf International Services 25.60 (0.97) (17.68) 4,758 1534.2 1.3 3.9 Mesaieed Petrochemical Holding 14.95 1.56 (5.38) 18,782 18.9 1.3 4.0 Industrials 131,967 Qatar Insurance 71.00 0.14 (3.71) 19,689 19.1 2.4 1.8 Doha Insurance 16.84 (2.09) (7.47) 842 10.9 0.8 3.6 Qatar General Insurance & Reinsurance 39.10 0.00 (16.81) 3,422 16.4 0.5 3.8 Al Khaleej Takaful Insurance 20.00 2.56 (5.21) 511 39.0 0.9 3.0 Qatar Islamic Insurance 60.90 1.84 20.36 914 14.3 2.9 5.8 Insurance 25,377 United Development 19.19 0.10 (7.07) 6,795 11.4 0.6 6.5 Barw a Real Estate 34.00 (2.30) 2.26 13,230 9.2 0.7 7.4 Ezdan Real Estate 15.30 (0.58) 1.26 40,583 22.3 1.3 3.3 Mazaya Qatar Real Estate Development 12.65 (6.23) (7.70) 1,464 27.6 1.0 N/A Real Estate 62,073 Ooredoo 103.80 (1.61) 1.96 33,249 17.5 1.5 3.4 Vodafone Qatar 9.43 (2.28) 0.64 7,972 N/A 1.7 N/A Telecoms 41,221 Qatar Navigation (Milaha) 70.50 (2.22) (26.26) 8,074 13.4 0.6 5.0 Gulf Warehousing 52.50 0.96 (6.25) 3,077 14.6 2.0 3.0 Qatar Gas Transport (Nakilat) 19.90 (2.78) (13.82) 11,025 12.2 2.2 5.0 Transportation 22,176 Qatar Exchange 542,725
- 9. Contacts Saugata Sarkar Shahan Keushgerian Zaid al-Nafoosi , CMT, CFTe Head of Research Senior Research Analyst Senior Research Analyst Tel: (+974) 4476 6534 Tel: (+974) 4476 6509 Tel: (+974) 4476 6535 saugata.sarkar@qnbfs.com.qa shahan.keushgerian@qnbfs.com.qa zaid.alnafoosi@qnbfs.com.qa Mohamed Abo Daff QNB Financial Services Co. W.L.L. Senior Research Analyst Contact Center: (+974) 4476 6666 Tel: (+974) 4476 6589 PO Box 24025 mohd.abodaff@qnbfs.com.qa Doha, Qatar Disclaimer and Copyright Notice: This publication has been prepared by QNB Financial Services Co. W.L.L. (“QNBFS”) a wholly-owned subsidiary of Qatar National Bank (Q.P.S.C.). QNBFS is regulated by the Qatar Financial Markets Authority and the Qatar Exchange. Qatar National Bank (Q.P.S.C.) is regulated by the Qatar Central Bank. This publication expresses the views and opinions of QNBFS at a given time only. It is not an offer, promotion or recommendation to buy or sell securities or other investments, nor is it intended to constitute legal, tax, accounting, or financial advice. QNBFS accepts no liability whatsoever for any direct or indirect losses arising from use of this report. Any investment decision should depend on the individual circumstances of the investor and be based on specifically engaged investment advice. We therefore strongly advise potential investors to seek independent professional advice before making any investment decision. Although the information in this report has been obtained from sources that QNBFS believes to be reliable, we have not independently verified such information and it may not be accurate or complete. QNBFS does not make any representations or warranties as to the accuracy and completeness of the information it may contain, and declines any liability in that respect. For reports dealing with Technical Analysis, expressed opinions and/or recommendations may be different or contrary to the opinions/recommendations of QNBFS Fundamental Research as a result of depending solely on the historical technical data (price and volume). QNBFS reserves the right to amend the views and opinions expressed in this publication at any time. It may also express viewpoints or make investment decisions that differ significantly from, or even contradict, the views and opinions included in this report. This report may not be reproduced in whole or in part without permission from QNBFS COPYRIGHT: No part of this document may be reproduced without the explicit written permission of QNBFS. Page 9 of 9