QSE Weekly Market Review and Outlook
•
0 likes•97 views

The Qatar Stock Exchange index decreased slightly over the week. Trading value and volume also declined. Several large companies were primary contributors to the weekly index decline. Foreign institutions turned to net buying after net selling the prior week, while Qatari institutions remained net buyers. Vodafone Qatar reported higher losses for the quarter and year, though losses narrowed from the previous year. The cost of living in Qatar fell slightly month-over-month in April.

Recommended
More Related Content
What's hot
What's hot (20)
Similar to QSE Weekly Market Review and Outlook
Similar to QSE Weekly Market Review and Outlook (20)
More from QNB Group
More from QNB Group (20)
Recently uploaded
Recently uploaded (20)
QSE Weekly Market Review and Outlook
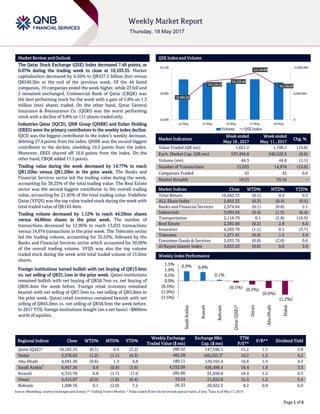
- 1. ` Page 1 of 6 Market Review and Outlook QSE Index and Volume The Qatar Stock Exchange (QSE) Index decreased 7.49 points, or 0.07% during the trading week to close at 10,103.35. Market capitalization decreased by 0.56% to QR537.5 billion (bn) versus QR540.5bn at the end of the previous week. Of the 44 listed companies, 19 companies ended the week higher, while 23 fell and 2 remained unchanged. Commercial Bank of Qatar (CBQK) was the best performing stock for the week with a gain of 5.8% on 1.3 million (mn) shares traded. On the other hand, Qatar General Insurance & Reinsurance Co. (QGRI) was the worst performing stock with a decline of 9.8% on 111 shares traded only. Industries Qatar (IQCD), QNB Group (QNBK) and Ezdan Holding (ERES) were the primary contributors to the weekly index decline. IQCD was the biggest contributor to the index’s weekly decrease, deleting 27.4 points from the index. QNBK was the second biggest contributor to the decline, shedding 19.2 points from the index. Moreover, ERES shaved off 16.6 points from the index. On the other hand, CBQK added 17.5 points. Trading value during the week decreased by 14.77% to reach QR1.02bn versus QR1.20bn in the prior week. The Banks and Financial Services sector led the trading value during the week, accounting for 38.25% of the total trading value. The Real Estate sector was the second biggest contributor to the overall trading value, accounting for 21.45% of the total trading value. Vodafone Qatar (VFQS) was the top value traded stock during the week with total traded value of QR143.4mn. Trading volume decreased by 1.12% to reach 44.29mn shares versus 44.80mn shares in the prior week. The number of transactions decreased by 12.96% to reach 13,033 transactions versus 14,974 transactions in the prior week. The Telecoms sector led the trading volume, accounting for 35.53%, followed by the Banks and Financial Services sector which accounted for 30.09% of the overall trading volume. VFQS was also the top volume traded stock during the week with total traded volume of 15.6mn shares. Foreign institutions turned bullish with net buying of QR13.6mn vs. net selling of QR31.1mn in the prior week. Qatari institutions remained bullish with net buying of QR58.7mn vs. net buying of QR95.4mn the week before. Foreign retail investors remained bearish with net selling of QR7.3mn vs. net selling of QR5.8mn in the prior week. Qatari retail investors remained bearish with net selling of QR65.0mn vs. net selling of QR58.5mn the week before. In 2017 YTD, foreign institutions bought (on a net basis) ~$800mn worth of equities. Market Indicators Week ended May 18 , 2017 Week ended May 11 , 2017 Chg. % Value Traded (QR mn) 1,021.2 1,198.2 (14.8) Exch. Market Cap. (QR mn) 537,494.8 540,526.3 (0.6) Volume (mn) 44.3 44.8 (1.1) Number of Transactions 13,033 14,974 (13.0) Companies Traded 43 43 0.0 Market Breadth 19:23 25:16 – Market Indices Close WTD% MTD% YTD% Total Return 16,942.72 (0.1) 0.4 0.3 ALL Share Index 2,855.32 (0.3) (0.4) (0.5) Banks and Financial Services 2,974.44 (0.1) (0.8) 2.1 Industrials 3,095.04 (0.4) (1.5) (6.4) Transportation 2,116.70 0.1 (2.8) (16.9) Real Estate 2,392.68 (0.2) 2.8 6.6 Insurance 4,269.78 (1.1) 0.1 (3.7) Telecoms 1,277.41 (0.9) 1.3 5.9 Consumer Goods & Services 5,935.76 (0.8) (2.0) 0.6 Al Rayan Islamic Index 4,033.53 (0.0) 0.0 3.9 Market Indices Weekly Index Performance Regional Indices Close WTD% MTD% YTD% Weekly Exchange Traded Value ($ mn) Exchange Mkt. Cap. ($ mn) TTM P/E** P/B** Dividend Yield Qatar (QSE)* 10,103.35 (0.1) 0.4 (3.2) 280.42 147,596.1 15.2 1.5 3.8 Dubai 3,378.02 (1.2) (1.1) (4.3) 402.28 100,533.3# 16.2 1.2 4.2 Abu Dhabi 4,581.30 (0.6) 1.3 0.8 189.11 120,165.4 16.6 1.4 4.3 Saudi Arabia# 6,947.36 0.9 (0.9) (3.6) 4,332.09 436,499.4 16.4 1.6 3.3 Kuwait 6,725.78 0.8 (1.7) 17.0 285.80 91,938.8 18.4 1.2 4.3 Oman 5,415.07 (0.3) (1.8) (6.4) 33.24 21,832.8 12.4 1.2 5.4 Bahrain 1,308.76 0.1 (2.0) 7.2 26.33 20,922.3 8.2 0.8 6.0 Source: Bloomberg, country exchanges and Zawya (** Trailing Twelve Months; * Value traded ($ mn) do not include special trades, if any; # Data as of May 17, 2017) 10,061.50 10,118.13 10,125.44 10,144.89 10,103.35 0 6,000,000 12,000,000 10,000 10,080 10,160 14-May 15-May 16-May 17-May 18-May Volume QSE Index 0.9% 0.8% 0.1% (0.1%) (0.3%) (0.6%) (1.2%)(1.5%) (1.0%) (0.5%) 0.0% 0.5% 1.0% 1.5% SaudiArabia Kuwait Bahrain Qatar(QSE)* Oman AbuDhabi Dubai
- 2. Page 2 of 6 News Economic & Corporate News VFQS reports net loss of QR74.20mn in 4QFY2017 (March 2017) – Vodafone Qatar reported a higher net loss of QR74.20mn in the March quarter (QNBFS estimate was a loss of QR51.67mn) vs. a net loss of QR31.44mn in December 2016 quarter. However, in FY2017, net loss narrowed to QR269.18mn from a net loss of QR465.71mn in FY2016. The company’s revenue came in at QR517.37mn in 4QFY2017, representing a decrease of 4.4% QoQ; we were expecting revenue of QR542.71mn so the company’s reported revenue was in-line with our estimate. On a YoY basis, revenue edged up 0.2%. EBITDA declined 22.5% QoQ to QR130.82mn in 4QFY2017. On a YoY basis, EBITDA increased 124.4%. In FY2017, the company’s EBITDA increased 34% YoY to QR536.51mn supported by gains in the post-paid market share, a better mix of higher-margin revenue and the success of new products. This was coupled with cost control following the restructuring of the business and a 10% reduction in overall headcount in the first quarter. Although total revenue decreased by 2.9% YoY in FY2017 due to a shift away from lower margin business and reduction in mobile termination rates, the underlying total revenue increased by 3.3%. Total number of mobile customers reached 1.5mn, representing a decrease of 3% YoY, due to a “one-time disconnection” of customers with inadequate customer registration information. The company registered free cash flow at QR116mn in the period under review, an improvement of QR250mn YoY. No dividends declared for FY2017. VFQS stated the board is encouraged by the progress of the business, and in order to accelerate investment in coverage and fixed line opportunities, has decided to recommend that no distribution be made in respect of FY2017. Distributable profit for the year was ~QR134mn according to news reports. We believe the results remain mixed and does not change our thesis on VFQS. The lack of a dividend, even if a token amount, could be a near-term negative for retail investors. We continue to rate VFQS a Market Perform with a PT of QR8.50. (QNBFS Research, Gulf-time.com, QSE) QIBK successfully prices $750mn 5-year Sukuk – Qatar Islamic Bank (QIBK) priced a highly successful $750mn 5-year RegS only Sukuk offering. The Sukuk was issued at par with an annual profit rate of 3.251% (payable semi-annually), representing a spread of 135bps over 5-year mid-swaps. QIBK is rated by Moody’s at ‘A1’ (stable); by S&P at ‘A-’ (negative) and by Fitch at ‘A+’ (stable). The transaction represents QIBK’s return to the public debt capital markets, following its $750mn Sukuk issuance in October 2015. Citi, Emirates NBD Capital, HSBC, Noor Bank, QInvest and Standard Chartered Bank acted as joint bookrunners and joint Lead Managers on the transaction. (Gulf-Times.com) Ezdan Holding Group set to launch realty project in Addis Ababa – Ezdan Holding Group is set to launch its maiden multi- purpose real estate project in Addis Ababa, capital of Ethiopia, as part of its efforts to strengthen its foothold in the overseas markets. “We have prepared a thorough study of the project in terms of its economic feasibility, location and uses. We expect this project to be completed as soon as possible in light of the swift response from the Ethiopian side in facilitating the procedures,” Ezdan Holding Group Chairman Sheikh Dr Khalid bin Thani bin Abdullah al-Thani said. In this regard, Ezdan Holding Group signed a memorandum of understanding (MoU) with a high-level Ethiopian delegation at its headquarters. The proposed 60,000 square meters project includes a five-star hotel, a convention center, a tower of hotel apartments and offices, variety of retail outlets, modern restaurants and cafes. However, further details regarding the cost of the project and the date of completion were not disclosed. (Gulf-Times.com) Milaha launches door-to-door service – Qatar Navigation (Milaha), a Qatar-based maritime transport and logistics conglomerate, has launched a door-to-door shipping service between Qatar and the UAE and vice versa. Mainly targeting small and medium enterprises (SMEs) in the automotive spare parts, fashion retail, and the fast-moving consumer goods sectors, Milaha would use its own marine transport assets and logistics infrastructure to fulfill the service, its spokesman said. The frequency of the service would initially be a weekly, and it will allow customers to track their cargo online from point of origin to destination. The service is part of the company’s strategy to be a one-stop shop for its partners’ shipping and logistics requirements. (Gulf-Times.com) Cost of living in Qatar falls by 0.2% MoM in April – Qatar’s cost of living, based on consumer price index (CPI), fell by 0.2% MoM in April, mainly owing to lower expenses towards restaurants, recreation and housing, according to official estimates. The CPI inflation, however, rose 0.6% YoY, on costlier transport, health, education, furniture and miscellaneous goods and services, said the figures released by the Ministry of Development Planning and Statistics (MDPS). International Monetary Fund recently said during 2017–18, subsidy cuts, increase in public fees, a moderate recovery in global commodity prices and the implementation of a value added tax are expected to moderate Qatar’s inflation over the medium term. The index of Restaurants and Hotels, which have 6.08% weight, shrank 0.9% MoM in April and 2.7% YoY. (Gulf-Times.com) Qatar's non-oil exports reach QR4.94bn in 1Q2017 – The total value of Qatar's non-oil exports for 1Q2017 reached QR4.94bn. The total value of non-oil exports for March 2017 rose to QR1.38bn compared to QR1.54bn in March 2016, recording an increase of 15.1%, according to recently released monthly report of Qatar Chamber on the foreign trade of the private sector. The report pointed out that about 75% of these exports were received by the GCC countries at a value of about QR1.37bn, which indicates, the strength of intra-GCC trade, while the rest of them were distributed to about 58 countries in the world. Export to other Asian countries, excluding Arab and GCC nations, accounted for 12% of the total non-oil Qatari exports made during the same month, at QR218.89mn. (Peninsula Qatar)
- 3. Page 3 of 6 Qatar Stock Exchange Top Gainers Top Decliners Source: Qatar Stock Exchange (QSE) Source: Qatar Stock Exchange (QSE) Most Active Shares by Value (QR Million) Most Active Shares by Volume (Million) Source: Qatar Stock Exchange (QSE) Source: Qatar Stock Exchange (QSE) Investor Trading Percentage to Total Value Traded Net Traded Value by Nationality (QR Million) Source: Qatar Stock Exchange (QSE) Source: Qatar Stock Exchange (QSE) 5.8% 4.0% 3.3% 2.6% 2.4% 0.0% 2.0% 4.0% 6.0% Commercial Bank of Qatar Qatar Islamic Insurance Barwa Real Estate Islamic Holding Group Qatar Electricity and Water -9.8% -6.4% -5.0% -2.7% -2.7% -12.0% -8.0% -4.0% 0.0% QatarGeneral Insurance & Reinsurance Zad Holding Al AhliBank Industries Qatar QatarFirstBank 143.4 112.4 92.9 85.5 67.2 0.0 50.0 100.0 150.0 Vodafone Qatar Barwa Real Estate QNB Group Ezdan Real Estate Masraf Al Rayan 15.6 5.4 4.8 3.3 1.6 0.0 6.0 12.0 18.0 Vodafone Qatar Ezdan Real Estate Qatar First Bank Barwa Real Estate Masraf Al Rayan 0% 20% 40% 60% 80% 100% Buy Sell 44.47% 50.83% 25.41% 19.66% 9.03% 9.75% 21.09% 19.76% Qatari Individuals Qatari Institutions Non-Qatari Individuals Non-Qatari Institutions 714 308 720 301 (6) 6 (100) - 100 200 300 400 500 600 700 800 Qatari Non- Qatari Net Investment Total Sold Total Bought
- 4. Page 4 of 6 TECHNICAL ANALYSIS OF THE QSE INDEX Source: Bloomberg The Index closed flat (-0.07%) vs last week’s and we remain optimistic on the bullishness of previous week’s engulfing candlestick. Our support remains at the 9,700 level and the resistance at the 11,500 mark. DEFINITIONS OF KEY TERMS USED IN TECHNICAL ANALYSIS RSI (Relative Strength Index) indicator – RSI is a momentum oscillator that measures the speed and change of price movements. The RSI oscillates between 0 to 100. The index is deemed to be overbought once the RSI approaches the 70 level, indicating that a correction is likely. On the other hand, if the RSI approaches 30, it is an indication that the index may be getting oversold and therefore likely to bounce back. MACD (Moving Average Convergence Divergence) indicator – The indicator consists of the MACD line and a signal line. The divergence or the convergence of the MACD line with the signal line indicates the strength in the momentum during the uptrend or downtrend, as the case may be. When the MACD crosses the signal line from below and trades above it, it gives a positive indication. The reverse is the situation for a bearish trend. Candlestick chart – A candlestick chart is a price chart that displays the high, low, open, and close for a security. The ‘body’ of the chart is portion between the open and close price, while the high and low intraday movements form the ‘shadow’. The candlestick may represent any time frame. We use a one-day candlestick chart (every candlestick represents one trading day) in our analysis. Doji candlestick pattern – A Doji candlestick is formed when a security's open and close are practically equal. The pattern indicates indecisiveness, and based on preceding price actions and future confirmation, may indicate a bullish or bearish trend reversal. Shooting Star/Inverted Hammer candlestick patterns – These candlestick patterns have a small real body (open price and close price are near to each other), and a long upper shadow (large intraday movement on the upside). The Shooting Star is a bearish reversal pattern that forms after a rally. The Inverted Hammer looks exactly like a Shooting Star, but forms after a downtrend. Inverted Hammers represent a potential bullish trend reversal.
- 5. Page 5 of 6 Source: Bloomberg Company Name Price May 18 % Change WTD % Change YTD Market Cap. QR Million TTM P/E P/B Div. Yield Qatar National Bank 140.00 (1.27) (5.46) 129,310 10.4 2.2 2.3 Qatar Islamic Bank 101.60 1.09 (2.21) 24,007 11.7 1.8 4.7 Commercial Bank of Qatar 31.20 5.76 0.80 12,627 98.9 0.7 N/A Doha Bank 31.60 (0.63) (6.23) 8,165 9.9 0.9 9.2 Al Ahli Bank 32.50 (4.97) (12.50) 6,511 10.2 1.3 2.9 Qatar International Islamic Bank 60.70 (1.14) (3.34) 9,188 11.5 1.3 6.6 Masraf Al Rayan 43.25 1.17 15.03 32,438 15.9 2.8 4.6 Al Khalij Commercial Bank 14.30 (2.39) (15.88) 5,148 11.9 0.7 5.2 Qatar First Bank 8.07 (2.65) (21.65) 1,614 N/A 0.9 N/A National Leasing 16.80 (0.59) 9.66 831 233.8 0.8 3.0 Dlala Holding 25.40 0.59 18.19 722 53.2 2.8 N/A Qatar & Oman Investment 9.15 (1.93) (8.04) 288 25.8 1.0 5.5 Islamic Holding Group 64.10 2.56 5.08 363 69.5 2.6 1.6 Banking and Financial Services 231,212 Zad Holding 74.10 (6.44) (16.93) 969 9.7 1.1 5.9 Qatar German Co. for Medical Devices 9.02 0.22 (10.69) 104 N/A 1.4 N/A Salam International Investment 10.40 0.48 (5.88) 1,189 11.6 0.7 7.7 Medicare Group 95.10 (1.76) 51.19 2,677 38.8 2.8 1.9 Qatar Cinema & Film Distribution 32.35 0.00 17.85 203 53.0 1.6 3.1 Qatar Fuel 120.10 (1.40) (9.97) 11,941 14.6 1.8 5.3 Widam Food Co. 60.80 (1.78) (10.59) 1,094 N/A 4.2 5.8 Mannai Corp. 78.70 1.94 (1.63) 3,590 7.2 1.4 5.1 Al Meera Consumer Goods 155.00 0.71 (11.68) 3,100 16.3 2.5 5.8 Consumer Goods and Services 24,868 Qatar Industrial Manufacturing 43.05 (0.58) (3.26) 2,046 10.3 1.4 7.0 Qatar National Cement 71.50 1.71 (8.55) 4,673 10.7 1.6 5.1 Industries Qatar 102.00 (2.67) (13.19) 61,710 19.4 1.9 3.9 Qatari Investors Group 58.50 0.69 0.00 7,273 25.4 2.9 1.7 Qatar Electricity and Water 212.00 2.42 (6.61) 23,320 15.1 2.9 3.5 Aamal 13.32 1.99 (2.27) 8,392 18.8 1.0 4.5 Gulf International Services 23.72 (0.88) (23.73) 4,408 1421.6 1.2 4.2 Mesaieed Petrochemical Holding 14.41 (0.62) (8.80) 18,104 18.2 1.3 4.2 Industrials 129,925 Qatar Insurance 71.00 0.00 (3.71) 19,689 19.1 2.0 1.8 Doha Insurance 16.25 1.44 (10.71) 813 10.5 0.8 3.7 Qatar General Insurance & Reinsurance 36.65 (9.84) (22.02) 3,207 15.3 0.5 4.1 Al Khaleej Takaful Insurance 19.50 0.05 (7.58) 498 38.8 0.9 3.1 Qatar Islamic Insurance 64.40 4.04 27.27 966 15.1 3.1 5.4 Insurance 25,172 United Development 19.12 (0.47) (7.41) 6,770 11.4 0.6 6.5 Barw a Real Estate 34.50 3.29 3.76 13,425 9.4 0.8 7.2 Ezdan Real Estate 15.70 (1.20) 3.90 41,644 19.0 1.3 3.2 Mazaya Qatar Real Estate Development 12.11 (1.54) (11.64) 1,402 26.4 1.0 N/A Real Estate 63,241 Ooredoo 106.30 (0.56) 4.42 34,050 18.0 1.6 3.3 Vodafone Qatar 8.96 (2.50) (4.38) 7,575 N/A 1.6 N/A Telecoms 41,625 Qatar Navigation (Milaha) 68.80 0.44 (28.03) 7,879 13.1 0.6 5.1 Gulf Warehousing 51.50 0.98 (8.04) 3,018 14.3 2.0 3.1 Qatar Gas Transport (Nakilat) 19.05 (0.47) (17.50) 10,554 11.7 2.2 5.2 Transportation 21,452 Qatar Exchange 537,495
- 6. Contacts Saugata Sarkar Shahan Keushgerian Zaid al-Nafoosi , CMT, CFTe Head of Research Senior Research Analyst Senior Research Analyst Tel: (+974) 4476 6534 Tel: (+974) 4476 6509 Tel: (+974) 4476 6535 saugata.sarkar@qnbfs.com.qa shahan.keushgerian@qnbfs.com.qa zaid.alnafoosi@qnbfs.com.qa Mohamed Abo Daff QNB Financial Services Co. W.L.L. Senior Research Analyst Contact Center: (+974) 4476 6666 Tel: (+974) 4476 6589 PO Box 24025 mohd.abodaff@qnbfs.com.qa Doha, Qatar Disclaimer and Copyright Notice: This publication has been prepared by QNB Financial Services Co. W.L.L. (“QNBFS”) a wholly-owned subsidiary of Qatar National Bank (Q.P.S.C.). QNBFS is regulated by the Qatar Financial Markets Authority and the Qatar Exchange. Qatar National Bank (Q.P.S.C.) is regulated by the Qatar Central Bank. This publication expresses the views and opinions of QNBFS at a given time only. It is not an offer, promotion or recommendation to buy or sell securities or other investments, nor is it intended to constitute legal, tax, accounting, or financial advice. QNBFS accepts no liability whatsoever for any direct or indirect losses arising from use of this report. Any investment decision should depend on the individual circumstances of the investor and be based on specifically engaged investment advice. We therefore strongly advise potential investors to seek independent professional advice before making any investment decision. Although the information in this report has been obtained from sources that QNBFS believes to be reliable, we have not independently verified such information and it may not be accurate or complete. QNBFS does not make any representations or warranties as to the accuracy and completeness of the information it may contain, and declines any liability in that respect. For reports dealing with Technical Analysis, expressed opinions and/or recommendations may be different or contrary to the opinions/recommendations of QNBFS Fundamental Research as a result of depending solely on the historical technical data (price and volume). QNBFS reserves the right to amend the views and opinions expressed in this publication at any time. It may also express viewpoints or make investment decisions that differ significantly from, or even contradict, the views and opinions included in this report. This report may not be reproduced in whole or in part without permission from QNBFS COPYRIGHT: No part of this document may be reproduced without the explicit written permission of QNBFS. Page 6 of 6