Download to read offline

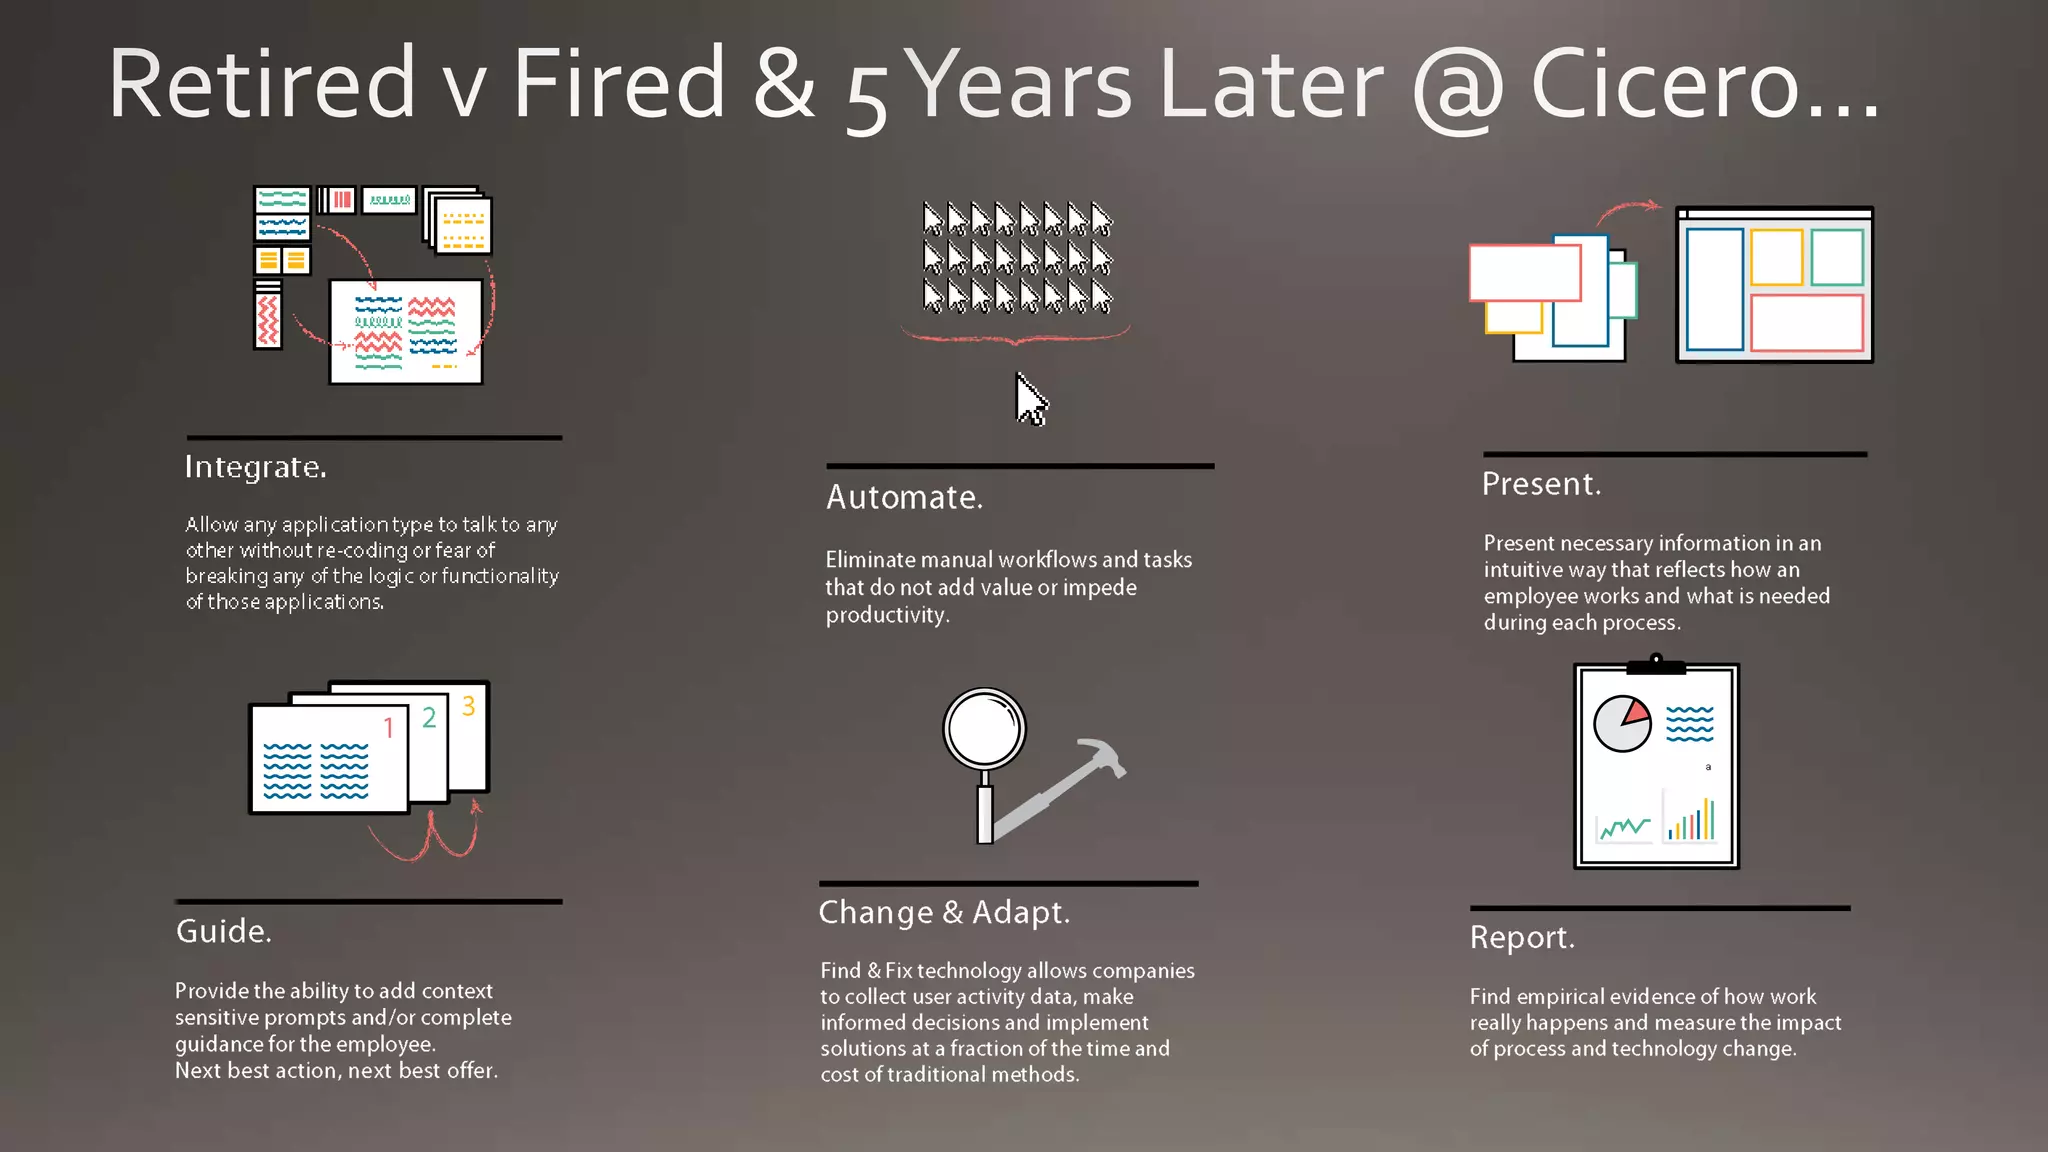
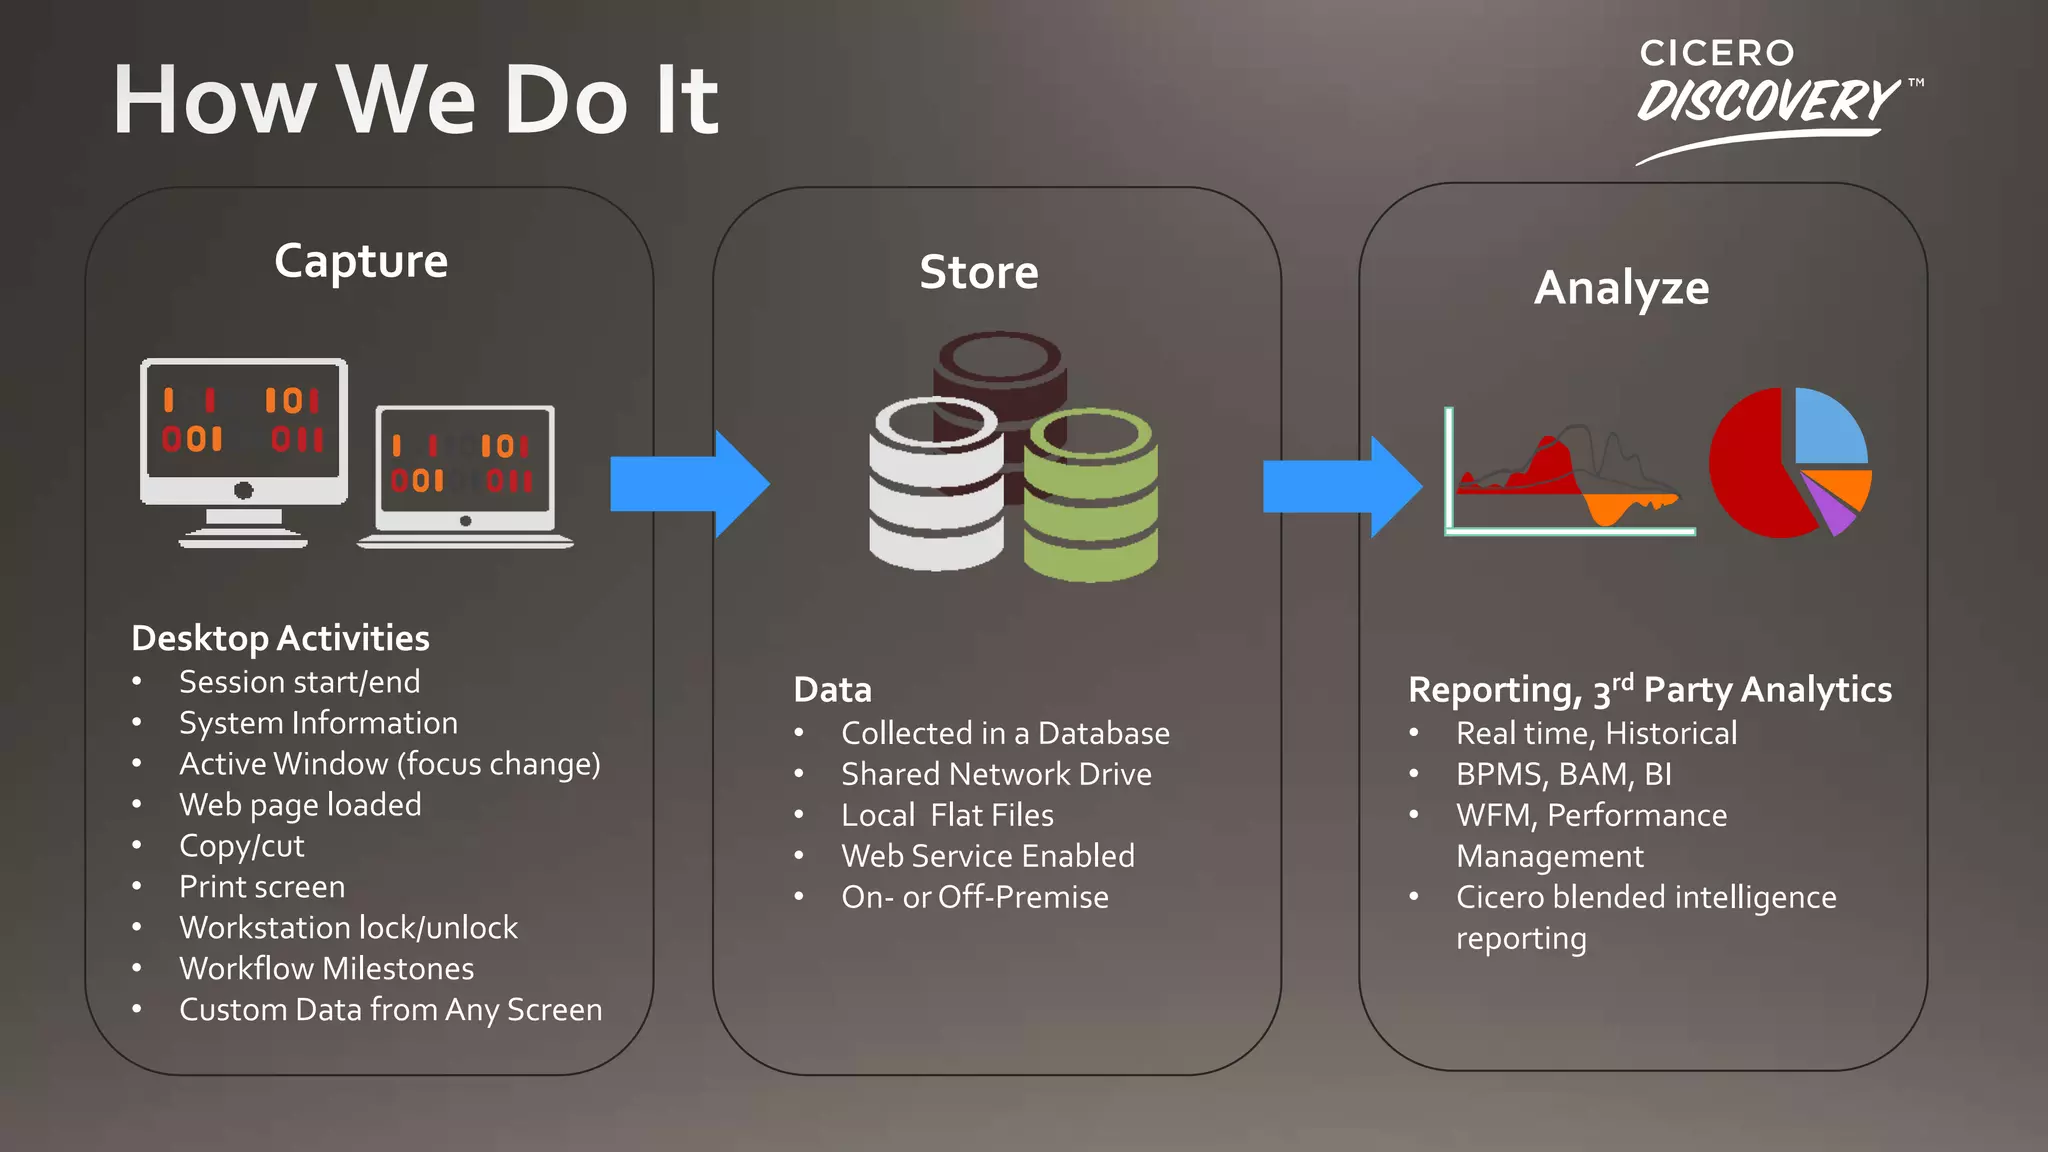

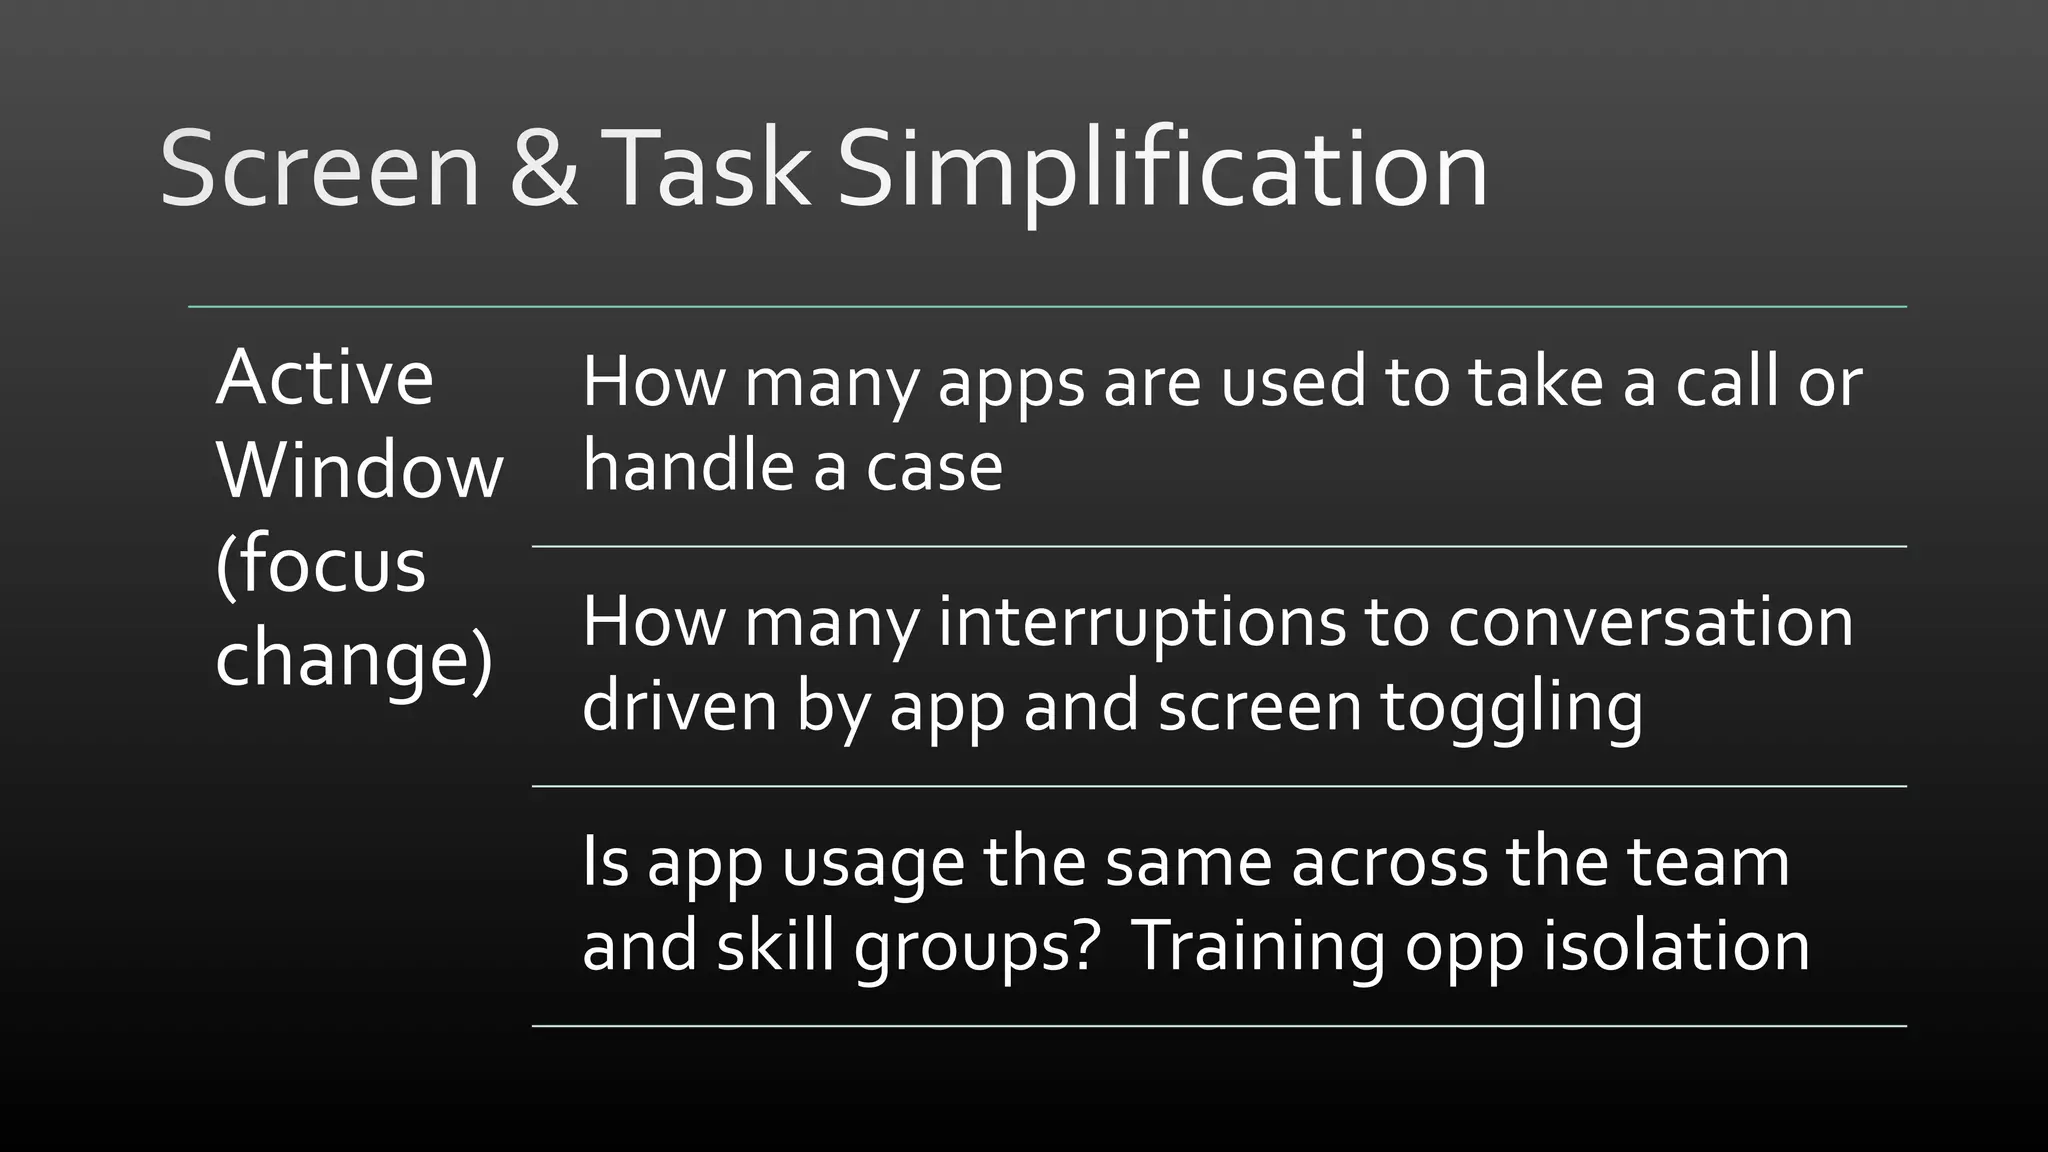
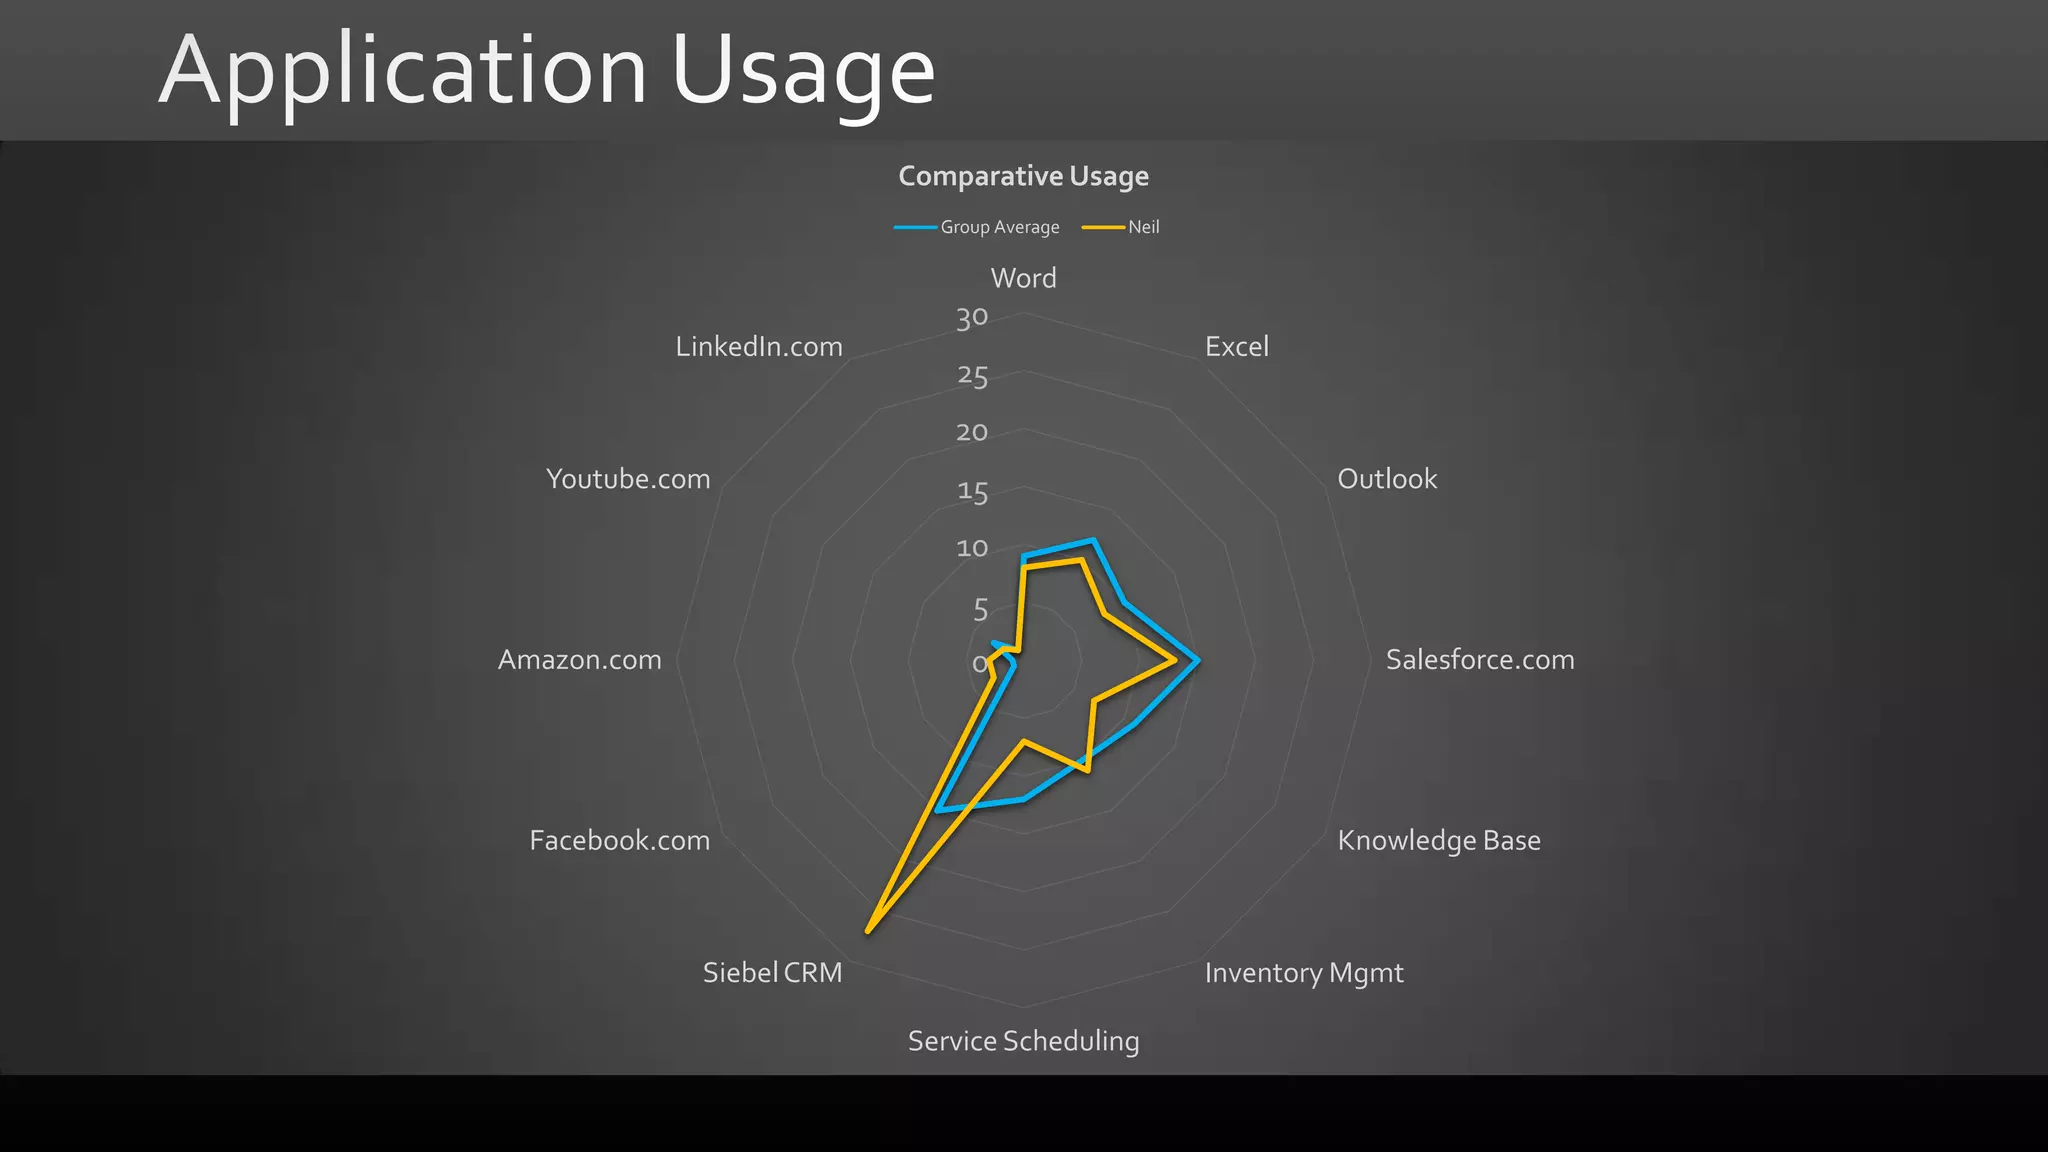
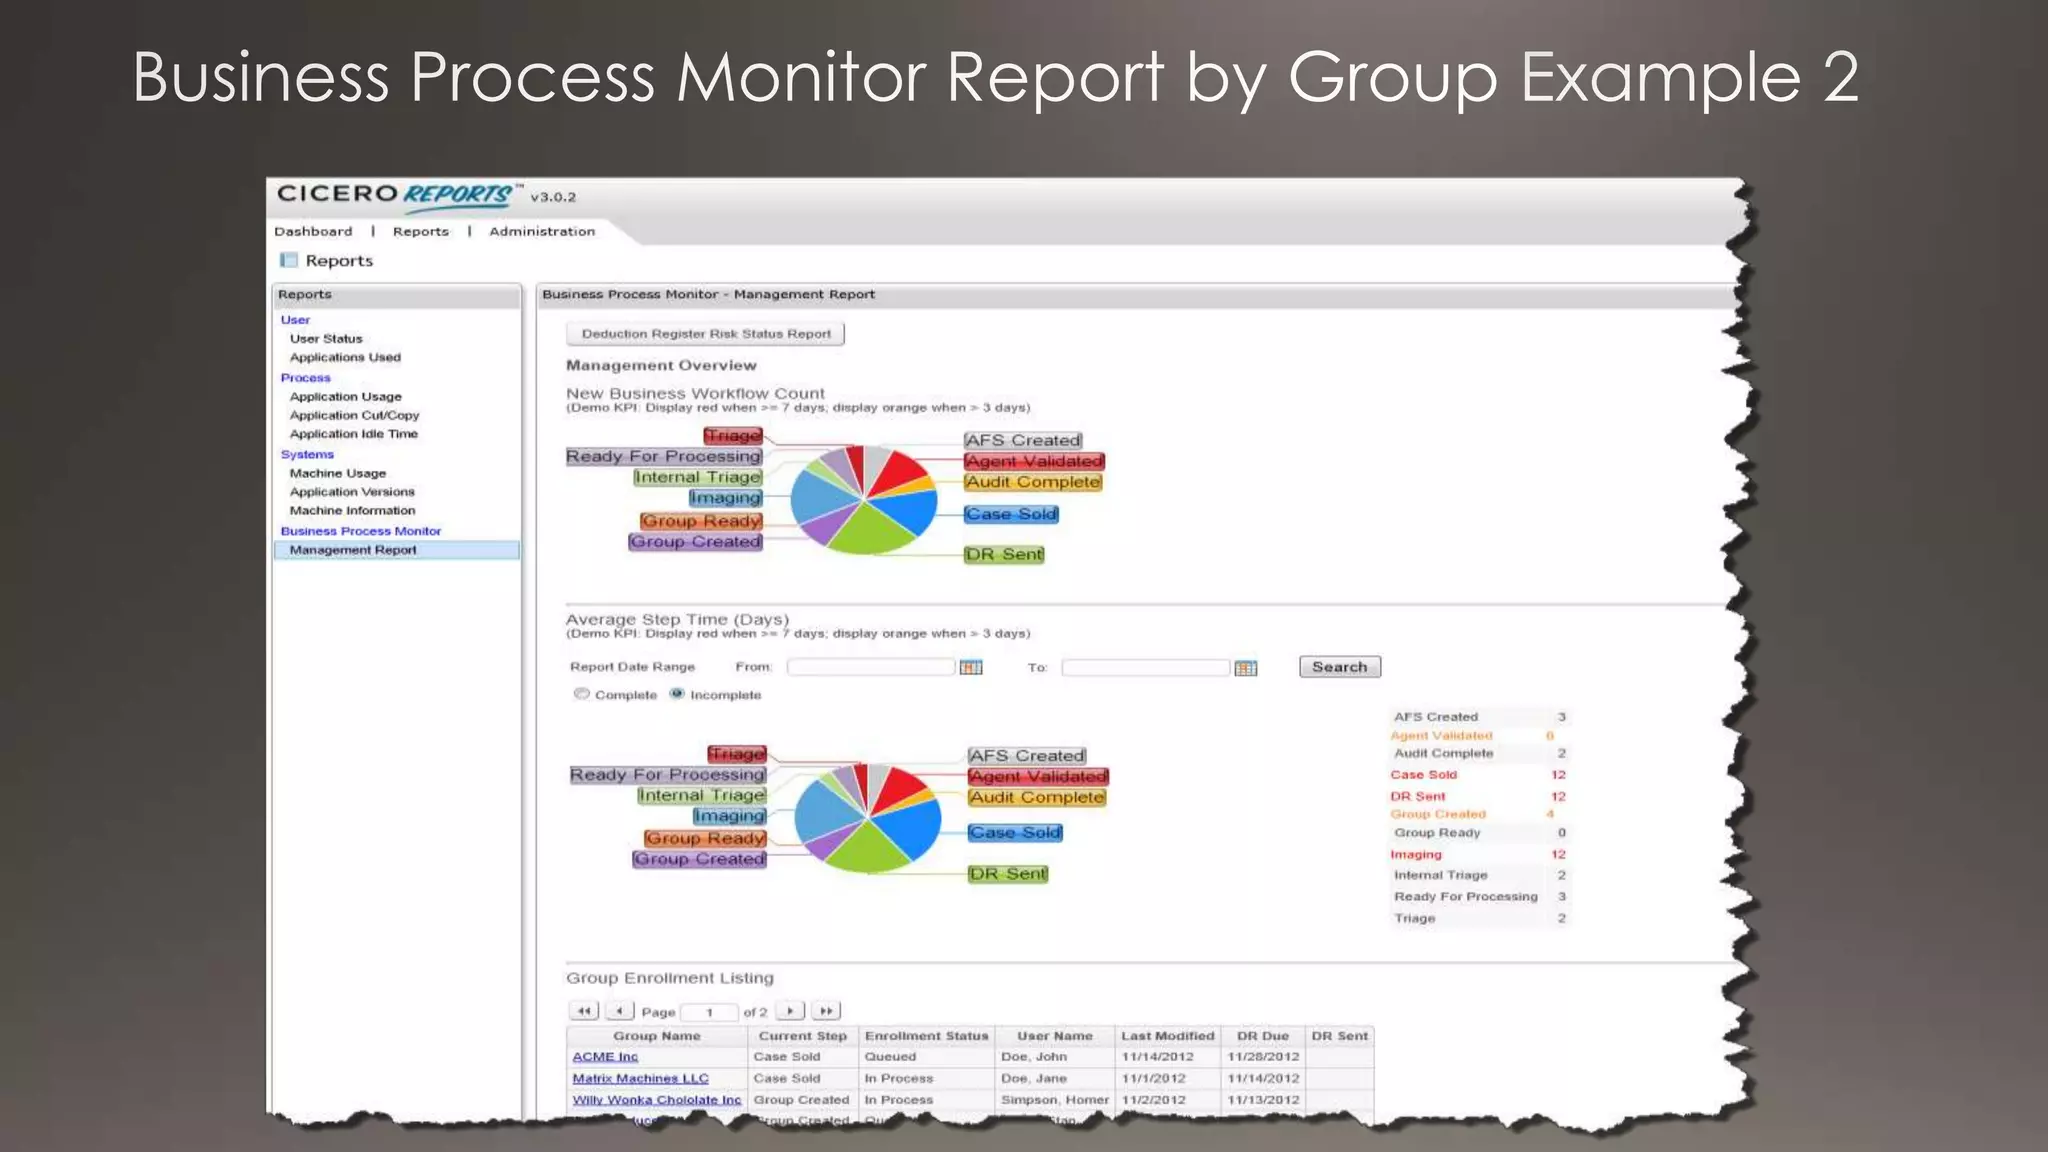
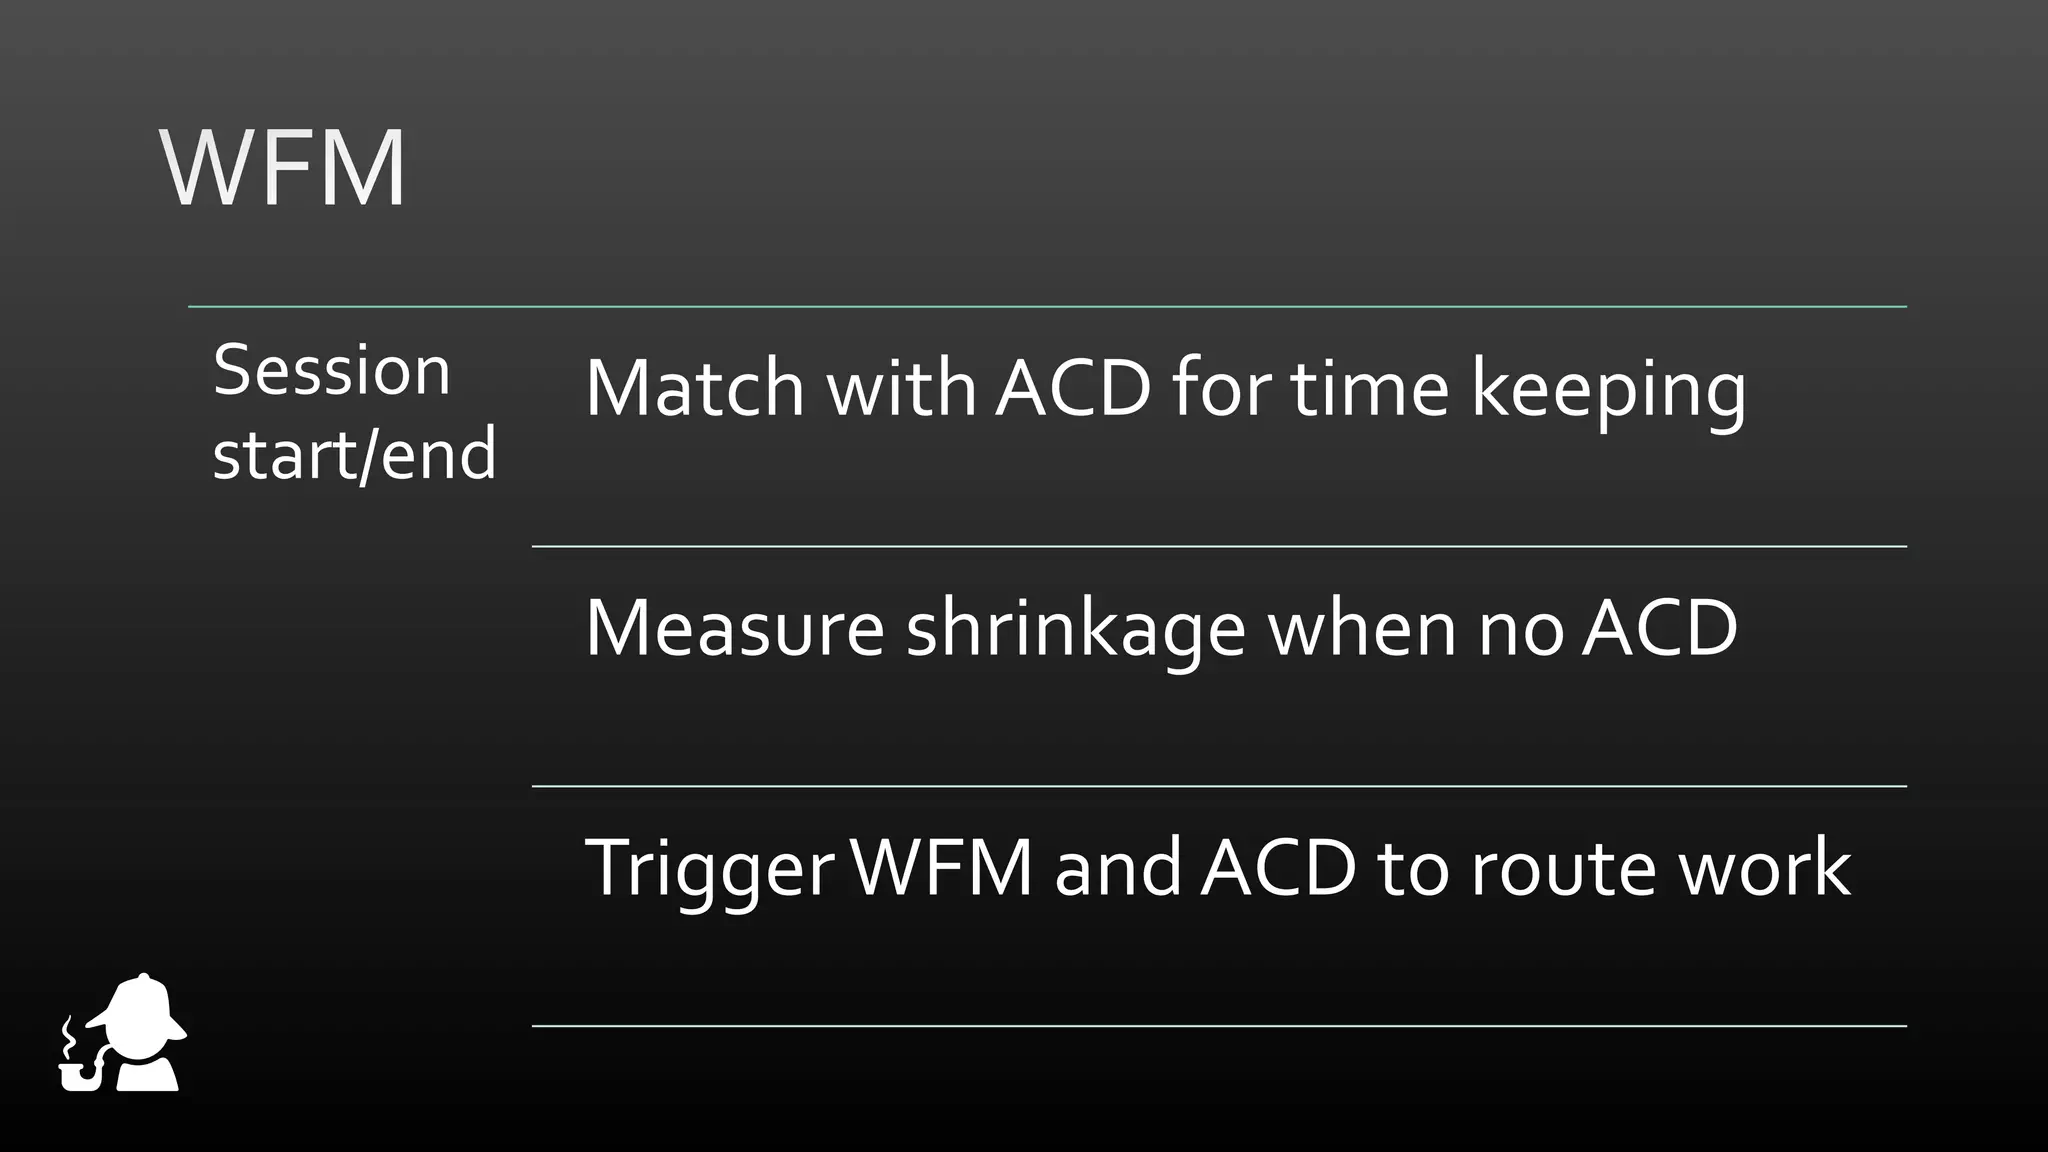
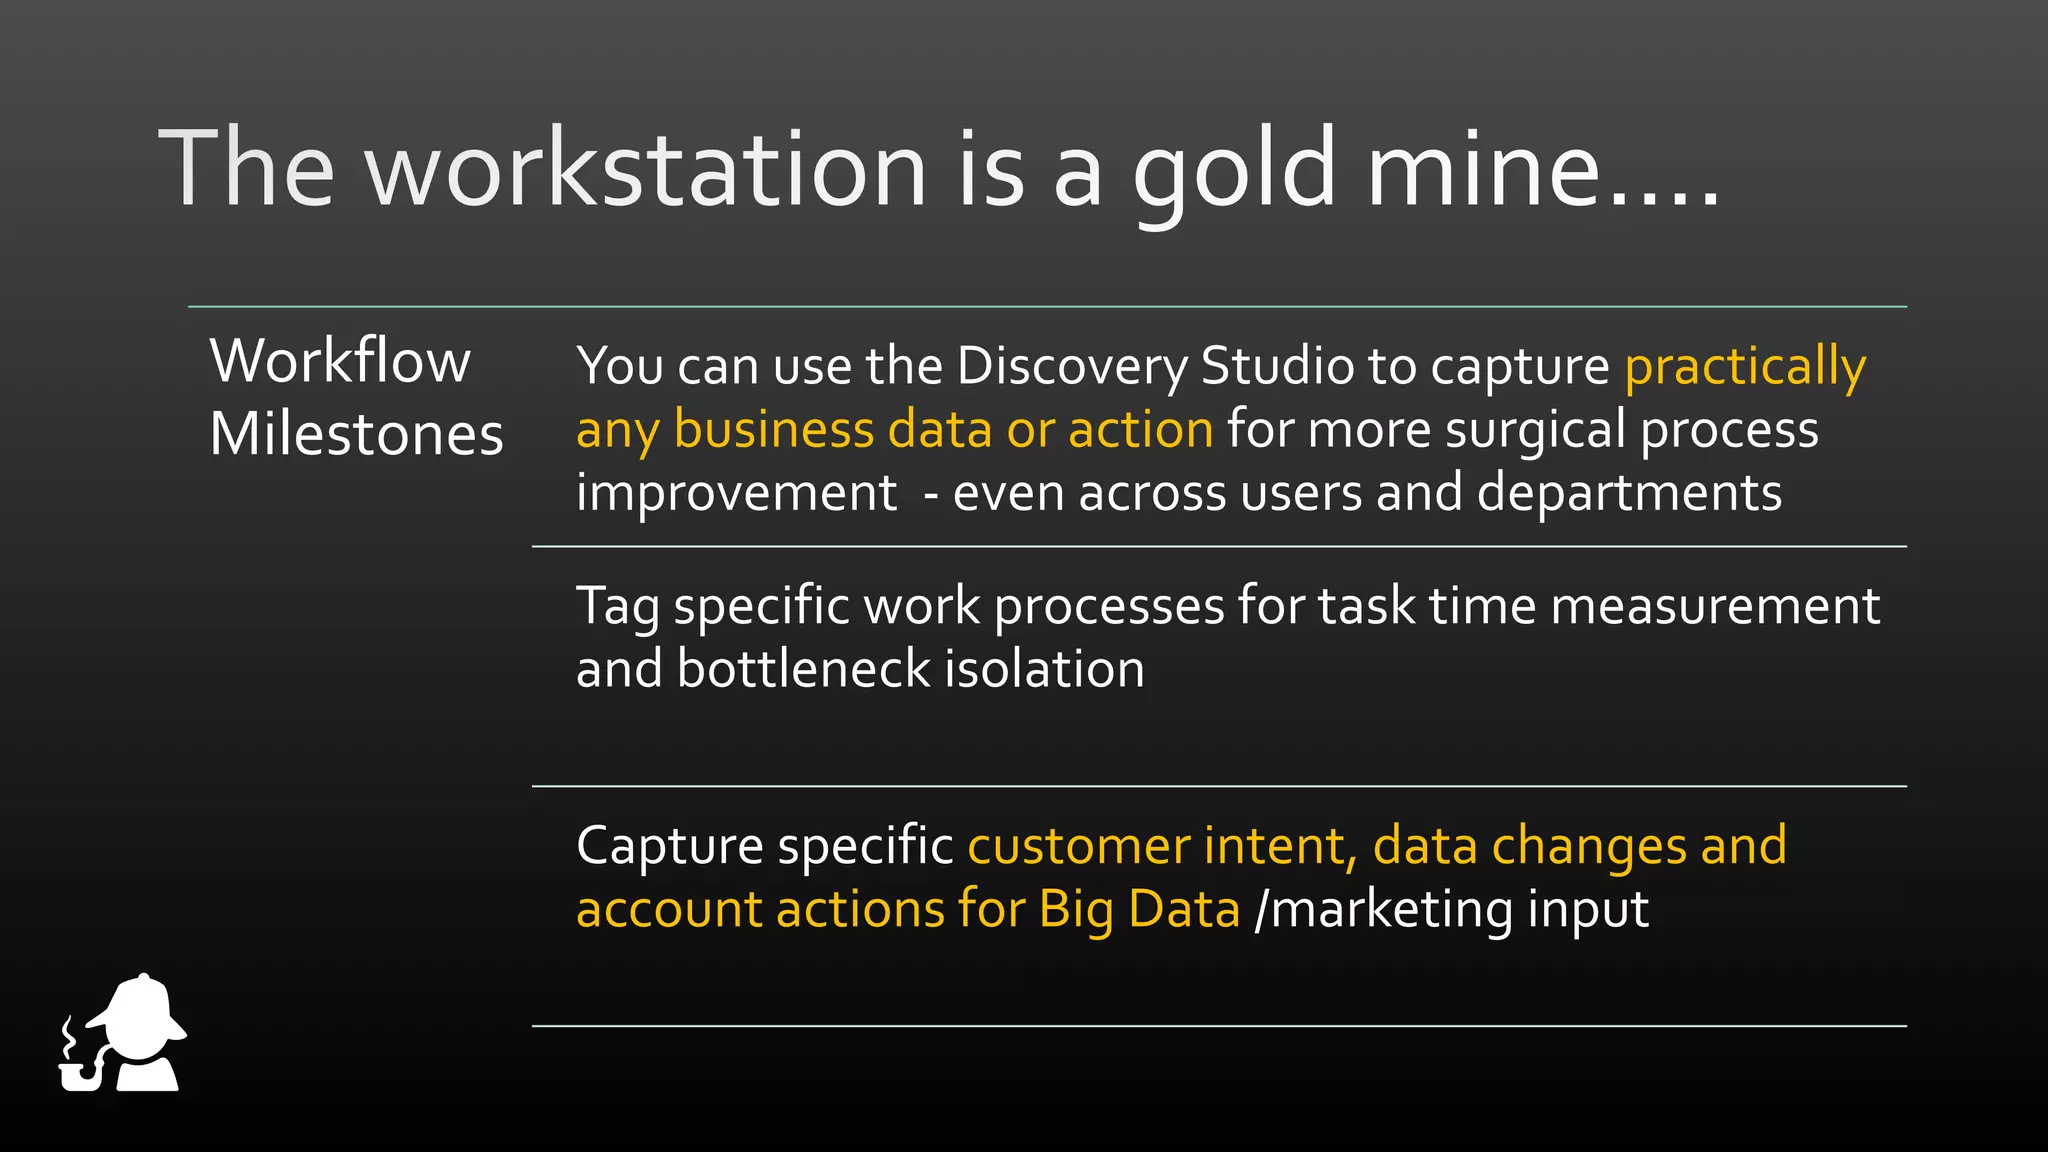
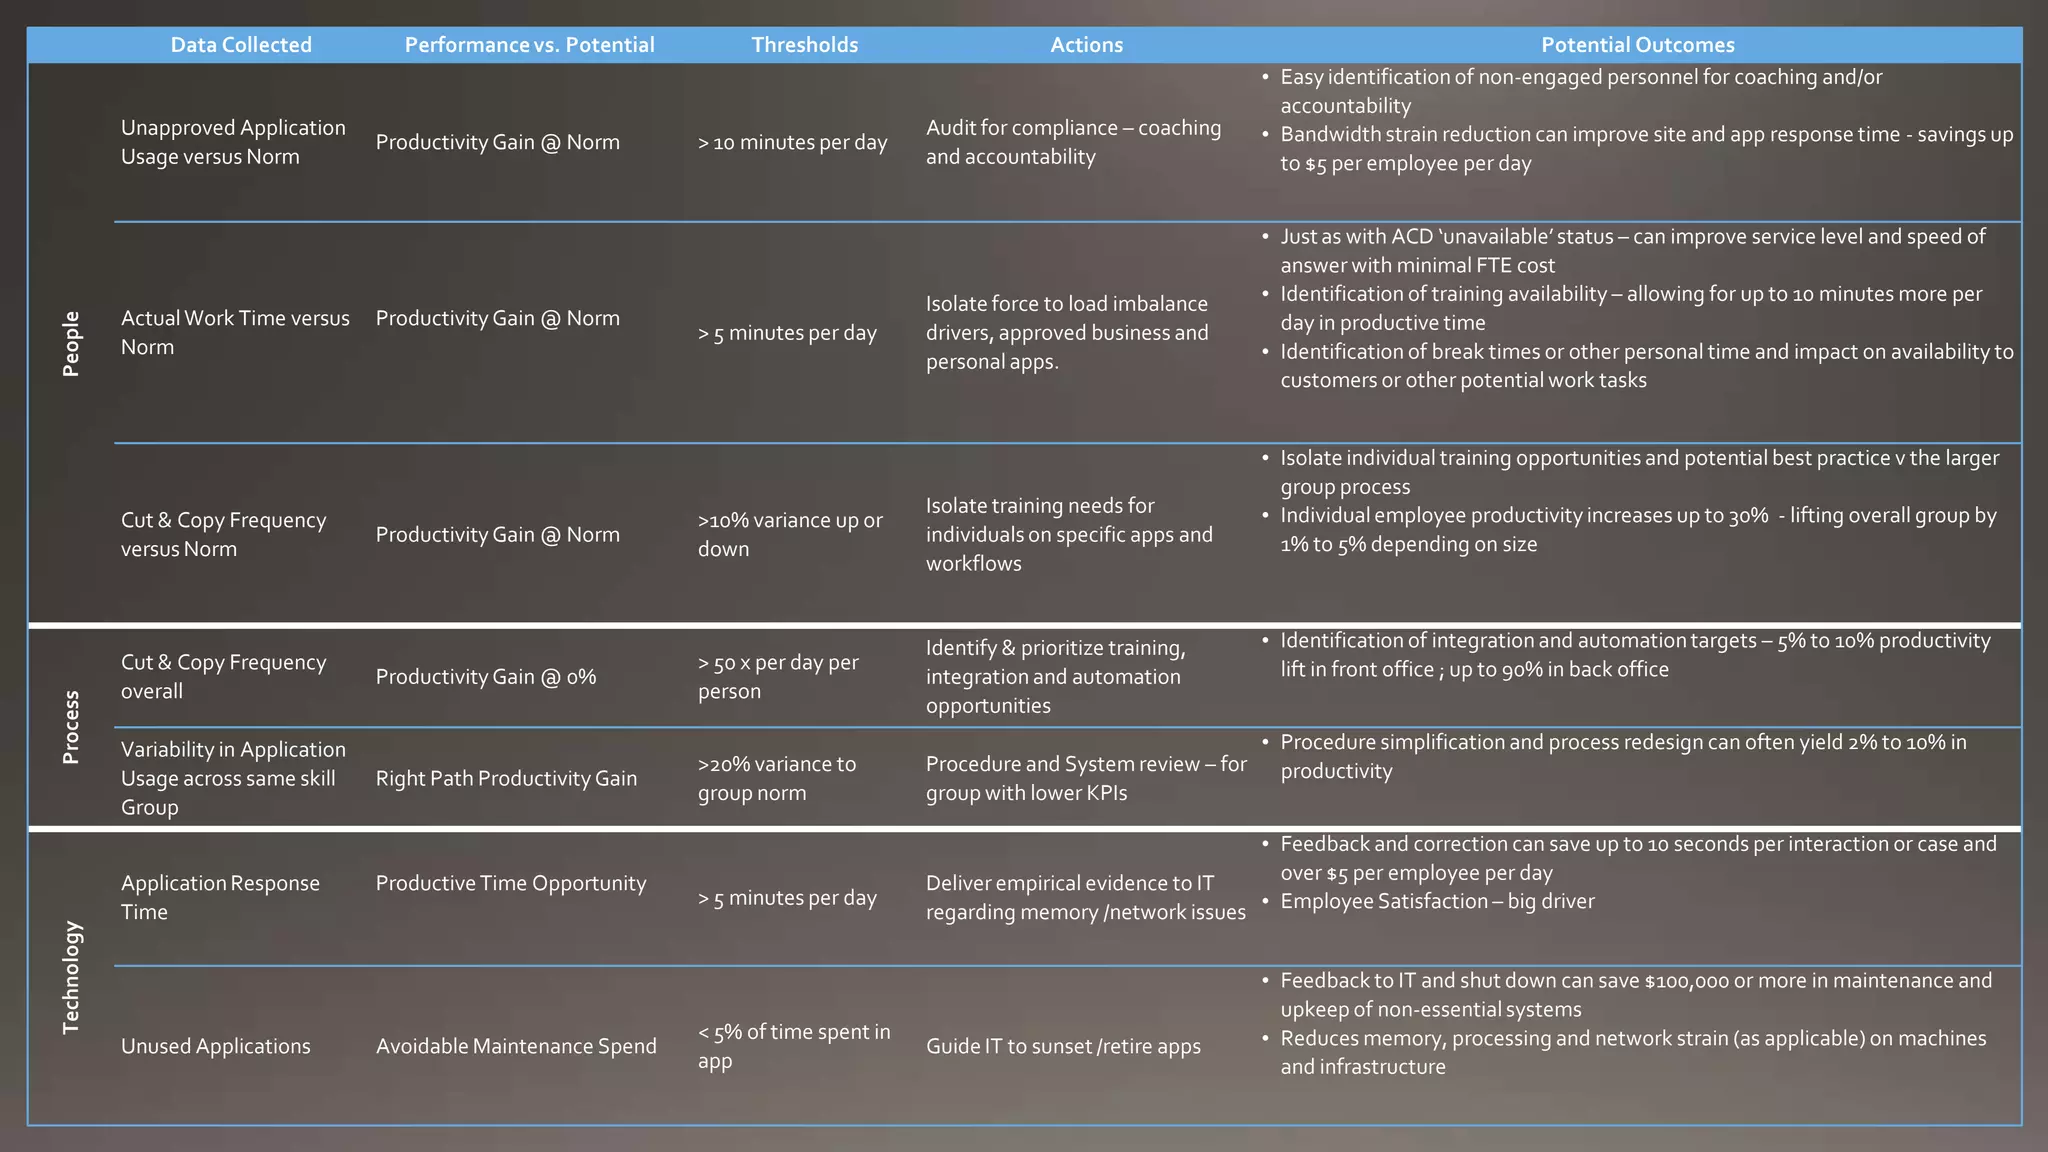


The document outlines a comprehensive effort to capture, analyze, and report on desktop activities for productivity improvement, utilizing various technologies to monitor user interactions and workflow milestones. Key metrics include application usage, employee productivity, and compliance, with recommendations for identifying training opportunities and optimizing processes for efficiency gains. The insights gleaned could lead to significant cost savings and enhancements in employee performance and satisfaction.