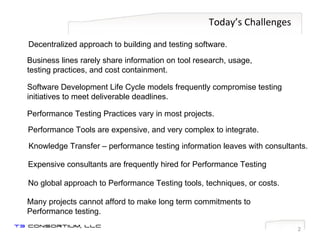
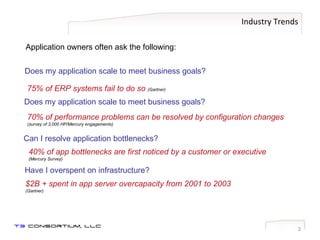
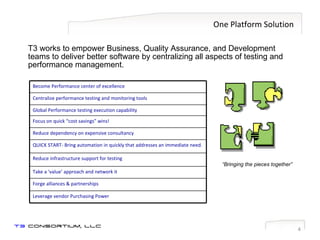
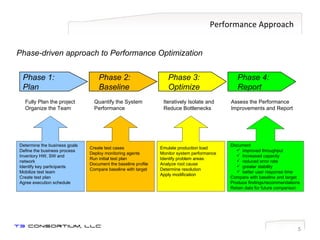
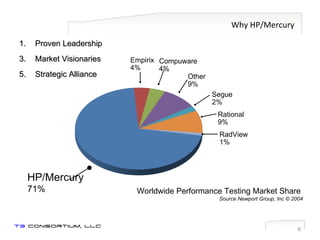
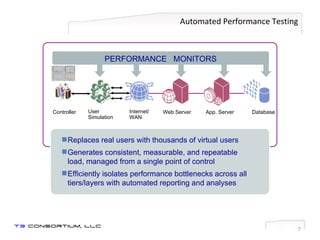
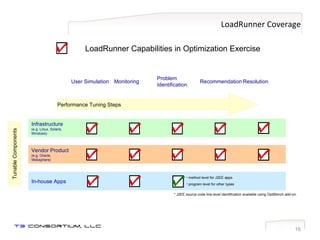
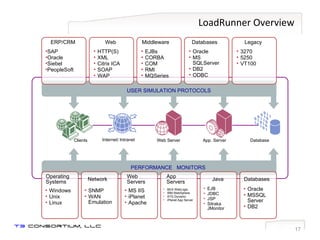
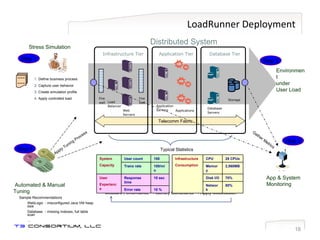
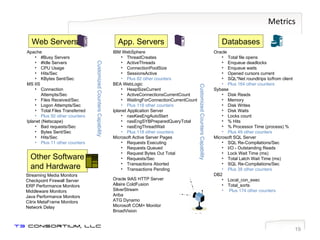
Professional Services Performance Testing  Center of Excellence Application Performance Management Solution Click to Advance Presentation Mute sound if necessary (sound icon) Information Technology Services
Today’s Challenges Business lines rarely share information on tool research, usage,  testing practices, and cost containment. Software Development Life Cycle models frequently compromise testing initiatives to meet deliverable deadlines. Performance Testing Practices vary in most projects. Knowledge Transfer – performance testing information leaves with consultants. Performance Tools are expensive, and very complex to integrate. No global approach to Performance Testing tools, techniques, or costs. Expensive consultants are frequently hired for Performance Testing Many projects cannot afford to make long term commitments to Performance testing. Decentralized approach to building and testing software.
Industry Trends Application owners often ask the following: Does my application scale to meet business goals? 75% of ERP systems fail to do so  (Gartner) Does my application scale to meet business goals? 70% of performance problems can be resolved by configuration changes  (survey of 3,000 HP/Mercury engagements) Can I resolve application bottlenecks? 40% of app bottlenecks are first noticed by a customer or executive  (Mercury Survey) $2B + spent in app server overcapacity from 2001 to 2003  (Gartner) Have I overspent on infrastructure?
One Platform Solution T3 works to empower Business, Quality Assurance, and Development teams to deliver better software by centralizing all aspects of testing and performance management.  “ Bringing the pieces together” Become Performance center of excellence Centralize performance testing and monitoring tools Global Performance testing execution capability Focus on quick “cost savings” wins! Reduce dependency on expensive consultancy QUICK START- Bring automation in quickly that addresses an immediate need. Reduce infrastructure support for testing Take a ‘value’ approach and network it Forge alliances & partnerships Leverage vendor Purchasing Power
Performance Approach Phase-driven approach to Performance Optimization Phase 1: Plan Fully Plan the project Organize the Team Determine the business goals Define the business process Inventory HW, SW and network Identify key participants Mobilize test team Create test plan Agree execution schedule Phase 2: Baseline Quantify the System Performance Create test cases Deploy monitoring agents Run initial test plan Document the baseline profile Compare baseline with target Phase 3: Optimize Iteratively Isolate and Reduce Bottlenecks Emulate production load Monitor system performance Identify problem areas Analyze root cause Determine resolution Apply modification Assess the Performance Improvements and Report Phase 4: Report Document  improved throughput Increased capacity reduced error rate greater stability better user response time Compare with baseline and target Produce findings/recommendations Retain data for future comparison
Why HP/Mercury Proven Leadership Market Visionaries Strategic Alliance Worldwide Performance Testing Market Share  Source Newport Group, Inc © 2004 Empirix 4% Compuware 4% Other 9% Segue 2% Rational 9% RadView 1% HP/Mercury 71%
Automated Performance Testing Web Server App. Server Database Internet/ WAN Controller User  Simulation PERFORMANCE  MONITORS Replaces real users with thousands of virtual users Generates consistent, measurable, and repeatable load, managed from a single point of control Efficiently isolates performance bottlenecks across all tiers/layers with automated reporting and analyses
Types of Performance Testing Stress Testing Capacity Planning Throughput Improvement Server Consolidation Baseline Assessment New Version Impact Analysis Ensure Business Performance
Application Monitoring 98% of sites experience critical performance problems Typical applications encounter problems at 15% of design capacity Problems occur both inside & outside firewall 25% - network and bandwidth related 23% - application server related 20% - load balancers, web server or proxy server issues Source: Mercury Interactive hosted services Application Management monitors the entire infrastructure from the users perspective! Application Server Web Servers Database Server Router Router Load Balancer Firewall ISP ISP ISP
A Day In the Life…  Daily Challenges 07:17AM Ticket opened 07:05AM Problem detected  - data center serving  e-Bank customers is down 07:31AM Bridge-line opened  - 8 people 11:48AM 4 more people paged , DBA joins line 04:05PM Root cause identified : mis-configured connection  pooling caused DB crash at peak traffic. At least 800 customers affected,  business impact unknown 04:20PM IT representative sent to client impact  assessment meeting 08:03AM Check UNIX issue,  escalate to hardware vendor 08:06AM Business urgency discussed , not well understood 10:51AM Hardware is ok, Informix  DB appears down 10:20AM Security clearance delays hardware vendor from    entering data center
Diagnose Root Cause Define SLAs Business Console Customer Impact SLM Event Viewer Tier 2 Top View BUSINESS  AVAILABILITY  CENTER Tier 1 Tier 3 RESOLUTION  CENTER
Application Management Dashboard Define SLAs Business Console Customer Impact SLM Event Viewer Tier 1 Tier 2 Tier 3 Top View BUSINESS  AVAILABILITY  CENTER RESOLUTION  CENTER
Appendix Supplemental Information
Introducing LoadRunner Our Center of Excellence approach uses Mercury Interactive LoadRunner product to deliver an integrated solution  for business technology optimization. Load Runner System Monitor Automated Scripts Data Repository It provides an end-to-end tool set for performance tuning a user simulation module to create business transaction load  a system monitoring module to display infrastructure behavior and application errors a set of automated scripts that identifies modifications a data repository for future comparisons Network bandwidth Routers Switches Hosting equipment Load balancers Application servers Databases Middleware Back office Firewalls IDS systems DDoS systems Gateways Web servers Cache servers LAN / WAN Client Systems Legacy system .NET services Sun ONE services Security Infrastructure Application
Powering the CoE Application Delivery Foundation Application  Monitoring Business Availability Center •  Resolution Center Application Delivery Console Virtual Users Protocols Monitors PERFORMANCE CoE Global Management Multi-project Management Resource Management Diagnostics Tuning LoadRunner Capacity Planning
LoadRunner Coverage Recommendation Resolution Problem Identification Monitoring User Simulation Infrastructure (e.g. Linux, Solaris, Windows) Vendor Product (e.g. Oracle, Websphere) Performance Tuning Steps Tunable Components LoadRunner Capabilities in Optimization Exercise In-house Apps method level for J2EE apps program level for other types * J2EE source code line-level identification available using OptiBench add-on.
LoadRunner Overview Web Server App. Server Database Internet/ Intranet USER SIMULATION PROTOCOLS Clients PERFORMANCE  MONITORS SAP Oracle Siebel PeopleSoft ERP/CRM HTTP(S) XML Citrix ICA SOAP WAP Web EJBs CORBA COM RMI MQSeries 3270 5250 VT100 Oracle MS SQLServer DB2 ODBC  Middleware Legacy Databases Operating Systems Network Web Servers App Servers Java Databases Windows Unix Linux SNMP WAN Emulation MS IIS iPlanet Apache EJB JDBC JSP Sitraka JMonitor Oracle MSSQL Server DB2 BEA WebLogic IBM WebSphere ATG Dynamo iPlanet App Server
LoadRunner Deployment Application Tier Applications Infrastructure Tier Database Tier Distributed System App & System Monitoring Measure Performance  ->  Identify Constraints -> Apply Modification ~~~ ~~~ Stress Simulation Telecomm Fabric Automated & Manual Tuning Apply Tuning Process Gather Metrics Step 1 Define business process Capture user behavior Create simulation profile Apply controlled load Step 2 Step 4 Sample Recommendations WebLogic - misconfigured Java VM heap size Database - missing indexes, full table scan ... Step 3 Environment under User Load Typical Statistics  Application Servers Fire wall Web  Servers Load  Balancer Fire wall Database Servers Storage Infrastructure Consumption   CPU 28 CPUs Memory 2,560MB Disk I/O 70% Network 80% System Capacity User count 100 Tranx rate 100/min User Experience Response time 10 sec Error rate  10 %
Metrics Databases Oracle Total file opens  Enqueue deadlocks Enqueue waits Opened cursors current SQL*Net roundtrips to/from client  Plus 164 other counters Sybase Disk Reads   Memory   Disk Writes Disk Waits Locks count  % Hits  % Processor Time (process) % Plus 49 other counters Microsoft SQL Server SQL Re-Compilations/Sec  I/O - Outstanding Reads  Lock Wait Time (ms)  Total Latch Wait Time (ms) SQL Re-Compilations/Sec   Plus 38 other counters DB2 Local_con_exec Total_sorts Plus 174 other counters App. Servers IBM WebSphere ThreadCreates   ActiveThreads   ConnectionPoolSize   SessionsActive Plus 82 other counters BEA WebLogic HeapSizeCurrent   ActiveConnectionsCurrentCount   WaitingForConnectionCurrentCount   Plus 118 other counters Iplanet Application Server nasKesEngAutoStart   nasEngSYBPreparedQueryTotal   nasEngThreadWait  Plus 118 other counters Microsoft Active Server Pages Requests Executing  Requests Queued  Request Bytes Out Total Requests/Sec  Transactions Aborted  Transactions Pending Oracle 9iAS HTTP Server Allaire ColdFusion SilverStream Ariba ATG Dynamo Microsoft COM+ Monitor BroadVision Web Servers Apache #Busy Servers  #Idle Servers  CPU Usage Hits/Sec  KBytes Sent/Sec   MS IIS Connection Attempts/Sec  Files Received/Sec  Logon Attempts/Sec  Total Files Transferred   Plus 50 other counters Iplanet (Netscape) Bad requests/Sec  Bytes Sent/Sec Hits/Sec   Plus 11 other counters Other Software and Hardware Streaming Media Monitors Checkpoint Firewall Server  ERP Performance Monitors Middleware Monitors Java Performance Monitors Citrix MetaFrame Monitors Network Delay Customized Counters Capability Customized Counters Capability
The Tuning Process LoadRunner’s tuning agent can be deployed to  automatically  recommend optimum settings for a wide range of industry-standard applications. IT specialists will  manually  optimize additional hardware and software based on LoadRunner performance metrics. Apache Web Server 1.x/2.x  BEA Weblogic 6.x/7.x  IBM HTTP Server  IBM Websphere Advanced 4.x  IBM Websphere Single Server 4.x  iPlanet Enterprise Server 6 & higher  Microsoft IIS 4/5  Microsoft Active Server Pages 2/3 Oracle Database  Oracle 9iAS  PeopleSoft 8.x SAP Enterprise Portals 5  Siebel 7.x  SQL Server 7.5/2000  Windows: NT, 2000 and XP UNIX: Solaris, HP, AIX and Linux
Benefits of Tuning Optimizes application and infrastructure performance Isolates and resolves performance bottlenecks Establishes optimized configuration settings for production
Benefits of LoadRunner Diagnostics Pinpoints application bottlenecks, e.g., J2EE to method/ SQL level Reduces time  to resolution  for application  issues Integrated with Mercury LoadRunner— combines end  user response  time with diagnostics
Visit Us Online For additional information contact: [email_address] Click Here  or copy/paste www.t3consortium.com Global Virtual Testing Capabilities

T3 Consortium's Performance Center of Excellence

  • 1.
    Professional Services PerformanceTesting Center of Excellence Application Performance Management Solution Click to Advance Presentation Mute sound if necessary (sound icon) Information Technology Services
  • 2.
    Today’s Challenges Businesslines rarely share information on tool research, usage, testing practices, and cost containment. Software Development Life Cycle models frequently compromise testing initiatives to meet deliverable deadlines. Performance Testing Practices vary in most projects. Knowledge Transfer – performance testing information leaves with consultants. Performance Tools are expensive, and very complex to integrate. No global approach to Performance Testing tools, techniques, or costs. Expensive consultants are frequently hired for Performance Testing Many projects cannot afford to make long term commitments to Performance testing. Decentralized approach to building and testing software.
  • 3.
    Industry Trends Applicationowners often ask the following: Does my application scale to meet business goals? 75% of ERP systems fail to do so (Gartner) Does my application scale to meet business goals? 70% of performance problems can be resolved by configuration changes (survey of 3,000 HP/Mercury engagements) Can I resolve application bottlenecks? 40% of app bottlenecks are first noticed by a customer or executive (Mercury Survey) $2B + spent in app server overcapacity from 2001 to 2003 (Gartner) Have I overspent on infrastructure?
  • 4.
    One Platform SolutionT3 works to empower Business, Quality Assurance, and Development teams to deliver better software by centralizing all aspects of testing and performance management. “ Bringing the pieces together” Become Performance center of excellence Centralize performance testing and monitoring tools Global Performance testing execution capability Focus on quick “cost savings” wins! Reduce dependency on expensive consultancy QUICK START- Bring automation in quickly that addresses an immediate need. Reduce infrastructure support for testing Take a ‘value’ approach and network it Forge alliances & partnerships Leverage vendor Purchasing Power
  • 5.
    Performance Approach Phase-drivenapproach to Performance Optimization Phase 1: Plan Fully Plan the project Organize the Team Determine the business goals Define the business process Inventory HW, SW and network Identify key participants Mobilize test team Create test plan Agree execution schedule Phase 2: Baseline Quantify the System Performance Create test cases Deploy monitoring agents Run initial test plan Document the baseline profile Compare baseline with target Phase 3: Optimize Iteratively Isolate and Reduce Bottlenecks Emulate production load Monitor system performance Identify problem areas Analyze root cause Determine resolution Apply modification Assess the Performance Improvements and Report Phase 4: Report Document improved throughput Increased capacity reduced error rate greater stability better user response time Compare with baseline and target Produce findings/recommendations Retain data for future comparison
  • 6.
    Why HP/Mercury ProvenLeadership Market Visionaries Strategic Alliance Worldwide Performance Testing Market Share Source Newport Group, Inc © 2004 Empirix 4% Compuware 4% Other 9% Segue 2% Rational 9% RadView 1% HP/Mercury 71%
  • 7.
    Automated Performance TestingWeb Server App. Server Database Internet/ WAN Controller User Simulation PERFORMANCE MONITORS Replaces real users with thousands of virtual users Generates consistent, measurable, and repeatable load, managed from a single point of control Efficiently isolates performance bottlenecks across all tiers/layers with automated reporting and analyses
  • 8.
    Types of PerformanceTesting Stress Testing Capacity Planning Throughput Improvement Server Consolidation Baseline Assessment New Version Impact Analysis Ensure Business Performance
  • 9.
    Application Monitoring 98%of sites experience critical performance problems Typical applications encounter problems at 15% of design capacity Problems occur both inside & outside firewall 25% - network and bandwidth related 23% - application server related 20% - load balancers, web server or proxy server issues Source: Mercury Interactive hosted services Application Management monitors the entire infrastructure from the users perspective! Application Server Web Servers Database Server Router Router Load Balancer Firewall ISP ISP ISP
  • 10.
    A Day Inthe Life… Daily Challenges 07:17AM Ticket opened 07:05AM Problem detected - data center serving e-Bank customers is down 07:31AM Bridge-line opened - 8 people 11:48AM 4 more people paged , DBA joins line 04:05PM Root cause identified : mis-configured connection pooling caused DB crash at peak traffic. At least 800 customers affected, business impact unknown 04:20PM IT representative sent to client impact assessment meeting 08:03AM Check UNIX issue, escalate to hardware vendor 08:06AM Business urgency discussed , not well understood 10:51AM Hardware is ok, Informix DB appears down 10:20AM Security clearance delays hardware vendor from entering data center
  • 11.
    Diagnose Root CauseDefine SLAs Business Console Customer Impact SLM Event Viewer Tier 2 Top View BUSINESS AVAILABILITY CENTER Tier 1 Tier 3 RESOLUTION CENTER
  • 12.
    Application Management DashboardDefine SLAs Business Console Customer Impact SLM Event Viewer Tier 1 Tier 2 Tier 3 Top View BUSINESS AVAILABILITY CENTER RESOLUTION CENTER
  • 13.
  • 14.
    Introducing LoadRunner OurCenter of Excellence approach uses Mercury Interactive LoadRunner product to deliver an integrated solution for business technology optimization. Load Runner System Monitor Automated Scripts Data Repository It provides an end-to-end tool set for performance tuning a user simulation module to create business transaction load a system monitoring module to display infrastructure behavior and application errors a set of automated scripts that identifies modifications a data repository for future comparisons Network bandwidth Routers Switches Hosting equipment Load balancers Application servers Databases Middleware Back office Firewalls IDS systems DDoS systems Gateways Web servers Cache servers LAN / WAN Client Systems Legacy system .NET services Sun ONE services Security Infrastructure Application
  • 15.
    Powering the CoEApplication Delivery Foundation Application Monitoring Business Availability Center • Resolution Center Application Delivery Console Virtual Users Protocols Monitors PERFORMANCE CoE Global Management Multi-project Management Resource Management Diagnostics Tuning LoadRunner Capacity Planning
  • 16.
    LoadRunner Coverage RecommendationResolution Problem Identification Monitoring User Simulation Infrastructure (e.g. Linux, Solaris, Windows) Vendor Product (e.g. Oracle, Websphere) Performance Tuning Steps Tunable Components LoadRunner Capabilities in Optimization Exercise In-house Apps method level for J2EE apps program level for other types * J2EE source code line-level identification available using OptiBench add-on.
  • 17.
    LoadRunner Overview WebServer App. Server Database Internet/ Intranet USER SIMULATION PROTOCOLS Clients PERFORMANCE MONITORS SAP Oracle Siebel PeopleSoft ERP/CRM HTTP(S) XML Citrix ICA SOAP WAP Web EJBs CORBA COM RMI MQSeries 3270 5250 VT100 Oracle MS SQLServer DB2 ODBC Middleware Legacy Databases Operating Systems Network Web Servers App Servers Java Databases Windows Unix Linux SNMP WAN Emulation MS IIS iPlanet Apache EJB JDBC JSP Sitraka JMonitor Oracle MSSQL Server DB2 BEA WebLogic IBM WebSphere ATG Dynamo iPlanet App Server
  • 18.
    LoadRunner Deployment ApplicationTier Applications Infrastructure Tier Database Tier Distributed System App & System Monitoring Measure Performance -> Identify Constraints -> Apply Modification ~~~ ~~~ Stress Simulation Telecomm Fabric Automated & Manual Tuning Apply Tuning Process Gather Metrics Step 1 Define business process Capture user behavior Create simulation profile Apply controlled load Step 2 Step 4 Sample Recommendations WebLogic - misconfigured Java VM heap size Database - missing indexes, full table scan ... Step 3 Environment under User Load Typical Statistics Application Servers Fire wall Web Servers Load Balancer Fire wall Database Servers Storage Infrastructure Consumption CPU 28 CPUs Memory 2,560MB Disk I/O 70% Network 80% System Capacity User count 100 Tranx rate 100/min User Experience Response time 10 sec Error rate 10 %
  • 19.
    Metrics Databases OracleTotal file opens Enqueue deadlocks Enqueue waits Opened cursors current SQL*Net roundtrips to/from client Plus 164 other counters Sybase Disk Reads Memory Disk Writes Disk Waits Locks count % Hits % Processor Time (process) % Plus 49 other counters Microsoft SQL Server SQL Re-Compilations/Sec I/O - Outstanding Reads Lock Wait Time (ms) Total Latch Wait Time (ms) SQL Re-Compilations/Sec Plus 38 other counters DB2 Local_con_exec Total_sorts Plus 174 other counters App. Servers IBM WebSphere ThreadCreates ActiveThreads ConnectionPoolSize SessionsActive Plus 82 other counters BEA WebLogic HeapSizeCurrent ActiveConnectionsCurrentCount WaitingForConnectionCurrentCount Plus 118 other counters Iplanet Application Server nasKesEngAutoStart nasEngSYBPreparedQueryTotal nasEngThreadWait Plus 118 other counters Microsoft Active Server Pages Requests Executing Requests Queued Request Bytes Out Total Requests/Sec Transactions Aborted Transactions Pending Oracle 9iAS HTTP Server Allaire ColdFusion SilverStream Ariba ATG Dynamo Microsoft COM+ Monitor BroadVision Web Servers Apache #Busy Servers #Idle Servers CPU Usage Hits/Sec KBytes Sent/Sec MS IIS Connection Attempts/Sec Files Received/Sec Logon Attempts/Sec Total Files Transferred Plus 50 other counters Iplanet (Netscape) Bad requests/Sec Bytes Sent/Sec Hits/Sec Plus 11 other counters Other Software and Hardware Streaming Media Monitors Checkpoint Firewall Server ERP Performance Monitors Middleware Monitors Java Performance Monitors Citrix MetaFrame Monitors Network Delay Customized Counters Capability Customized Counters Capability
  • 20.
    The Tuning ProcessLoadRunner’s tuning agent can be deployed to automatically recommend optimum settings for a wide range of industry-standard applications. IT specialists will manually optimize additional hardware and software based on LoadRunner performance metrics. Apache Web Server 1.x/2.x BEA Weblogic 6.x/7.x IBM HTTP Server IBM Websphere Advanced 4.x IBM Websphere Single Server 4.x iPlanet Enterprise Server 6 & higher Microsoft IIS 4/5 Microsoft Active Server Pages 2/3 Oracle Database Oracle 9iAS PeopleSoft 8.x SAP Enterprise Portals 5 Siebel 7.x SQL Server 7.5/2000 Windows: NT, 2000 and XP UNIX: Solaris, HP, AIX and Linux
  • 21.
    Benefits of TuningOptimizes application and infrastructure performance Isolates and resolves performance bottlenecks Establishes optimized configuration settings for production
  • 22.
    Benefits of LoadRunnerDiagnostics Pinpoints application bottlenecks, e.g., J2EE to method/ SQL level Reduces time to resolution for application issues Integrated with Mercury LoadRunner— combines end user response time with diagnostics
  • 23.
    Visit Us OnlineFor additional information contact: [email_address] Click Here or copy/paste www.t3consortium.com Global Virtual Testing Capabilities