Downloaded 299 times
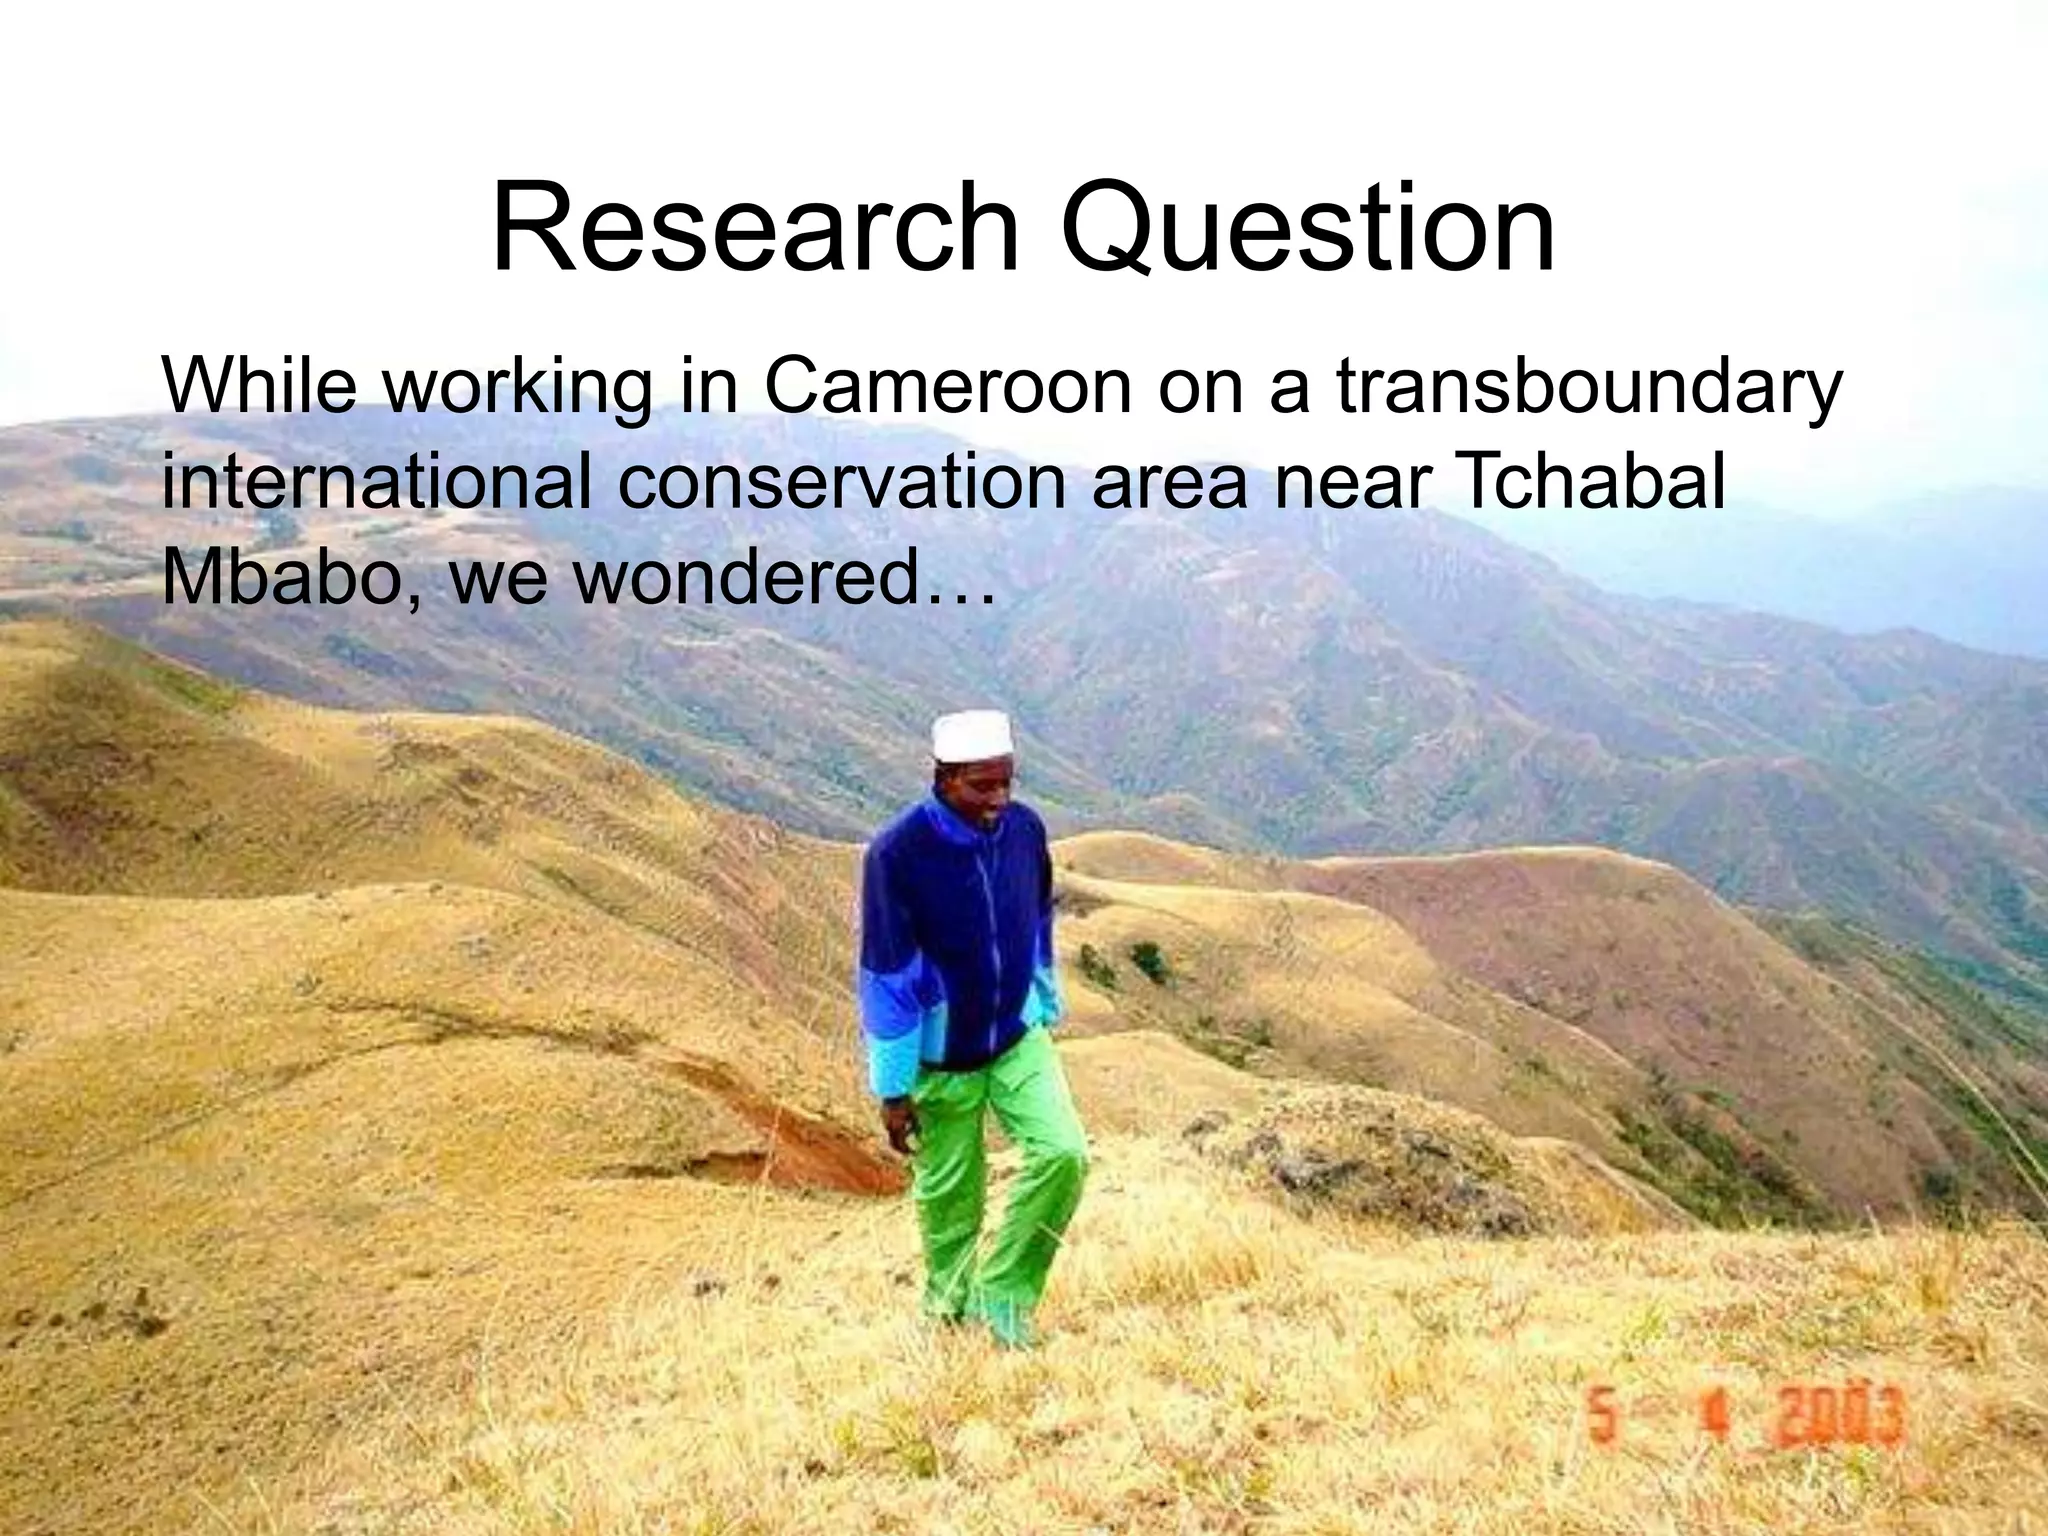
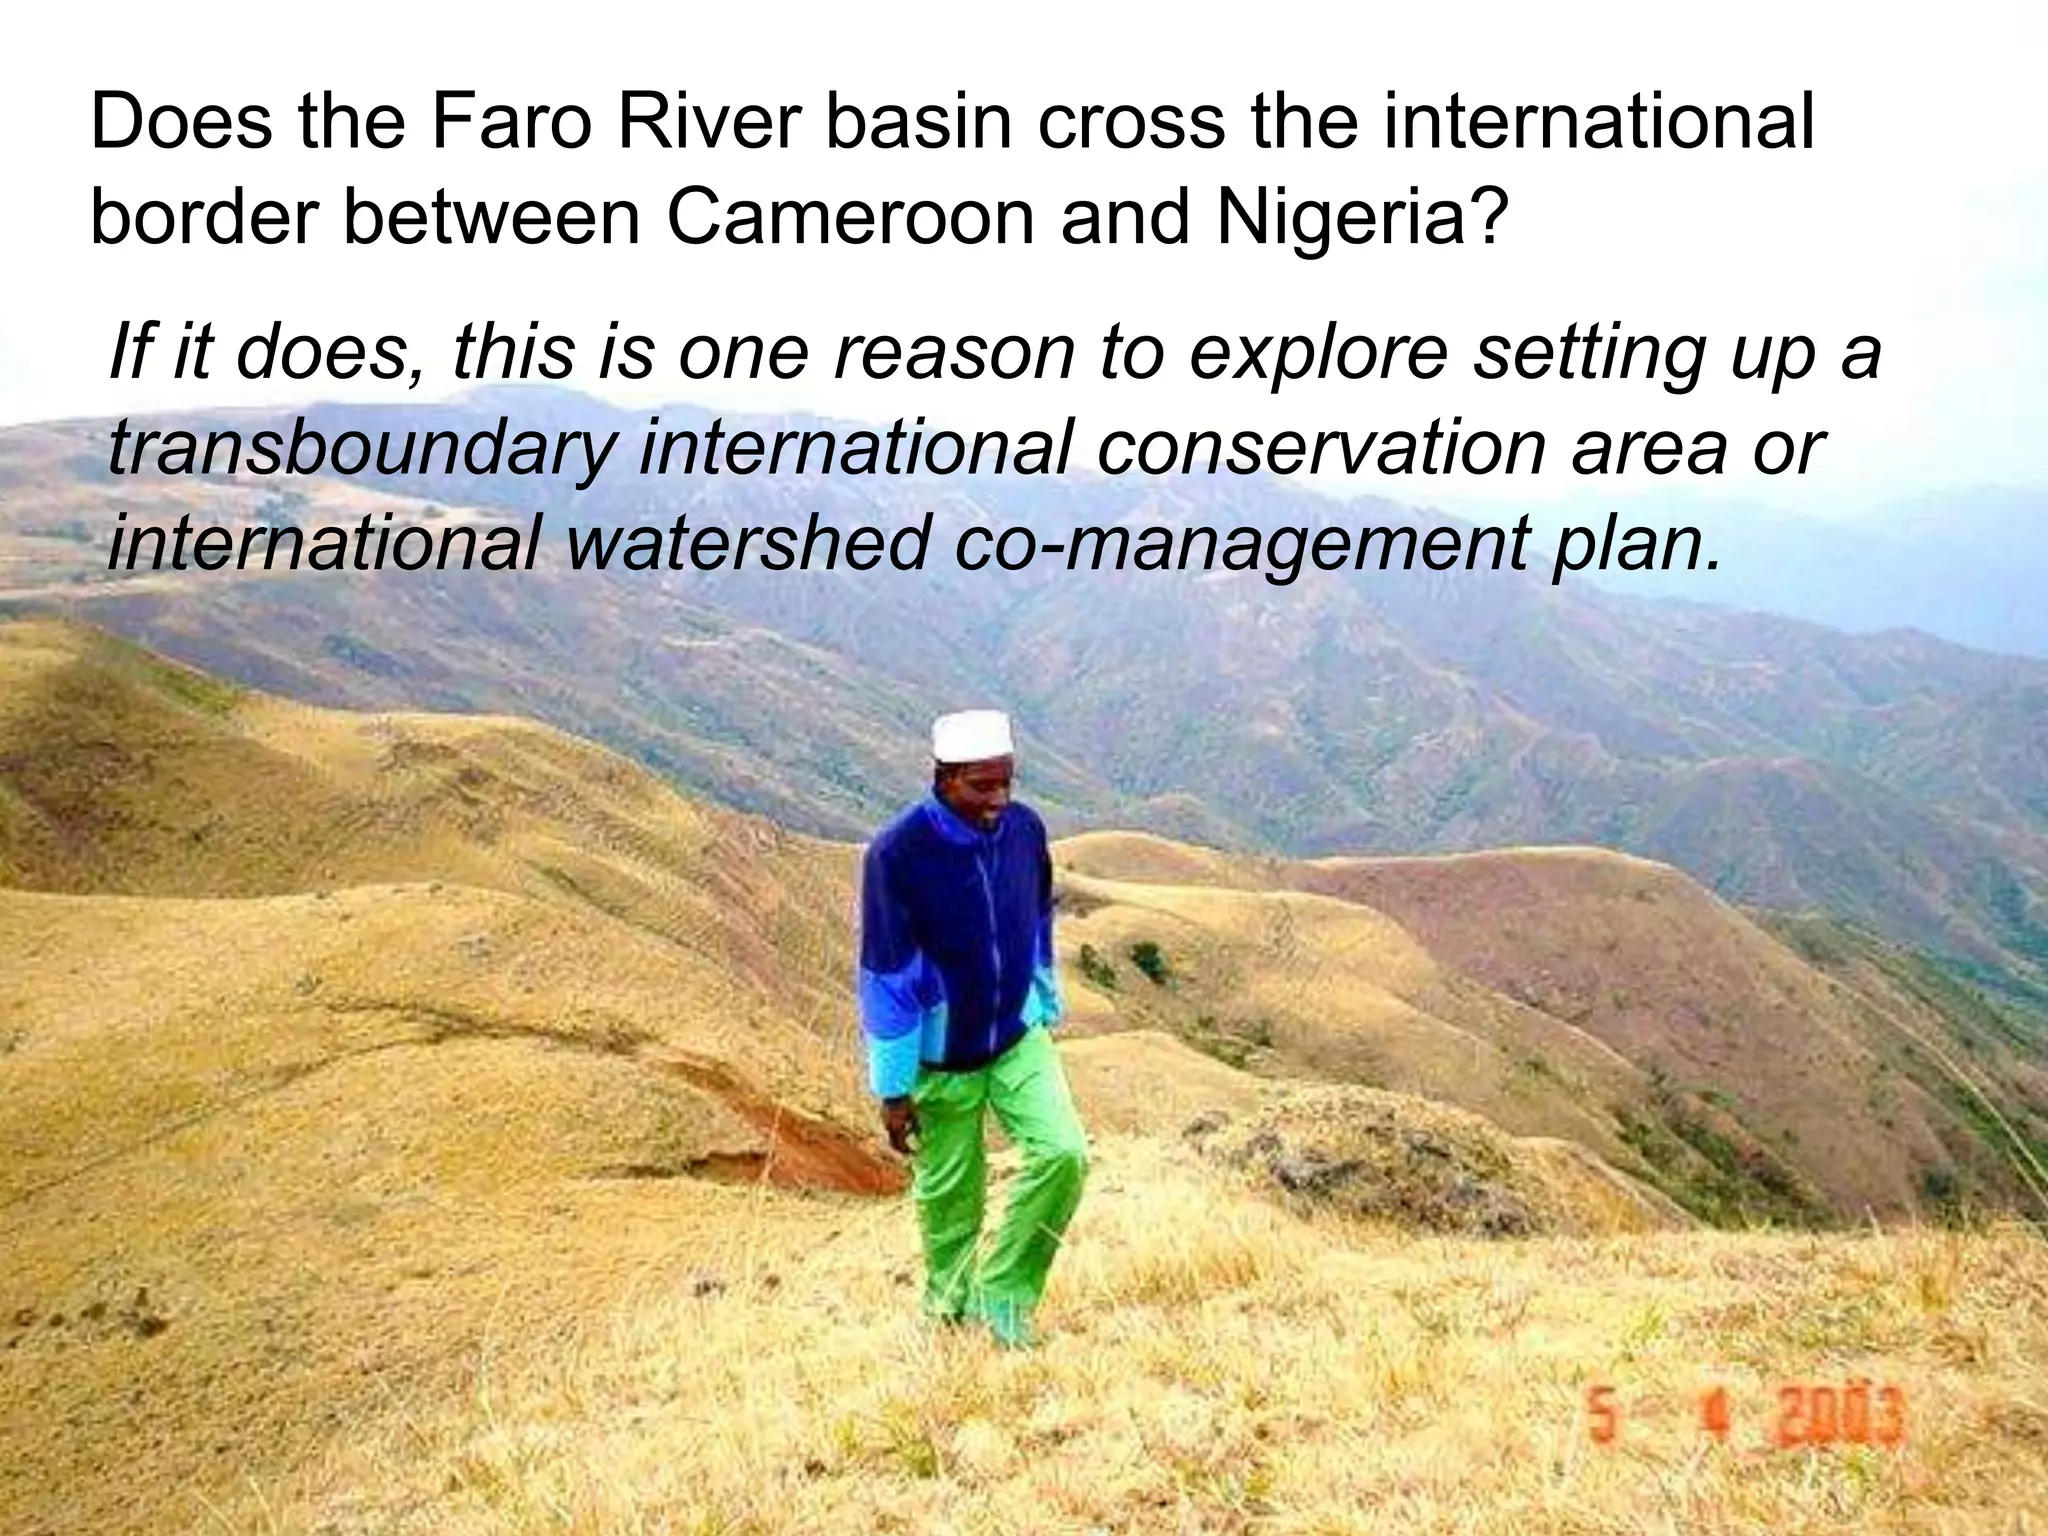
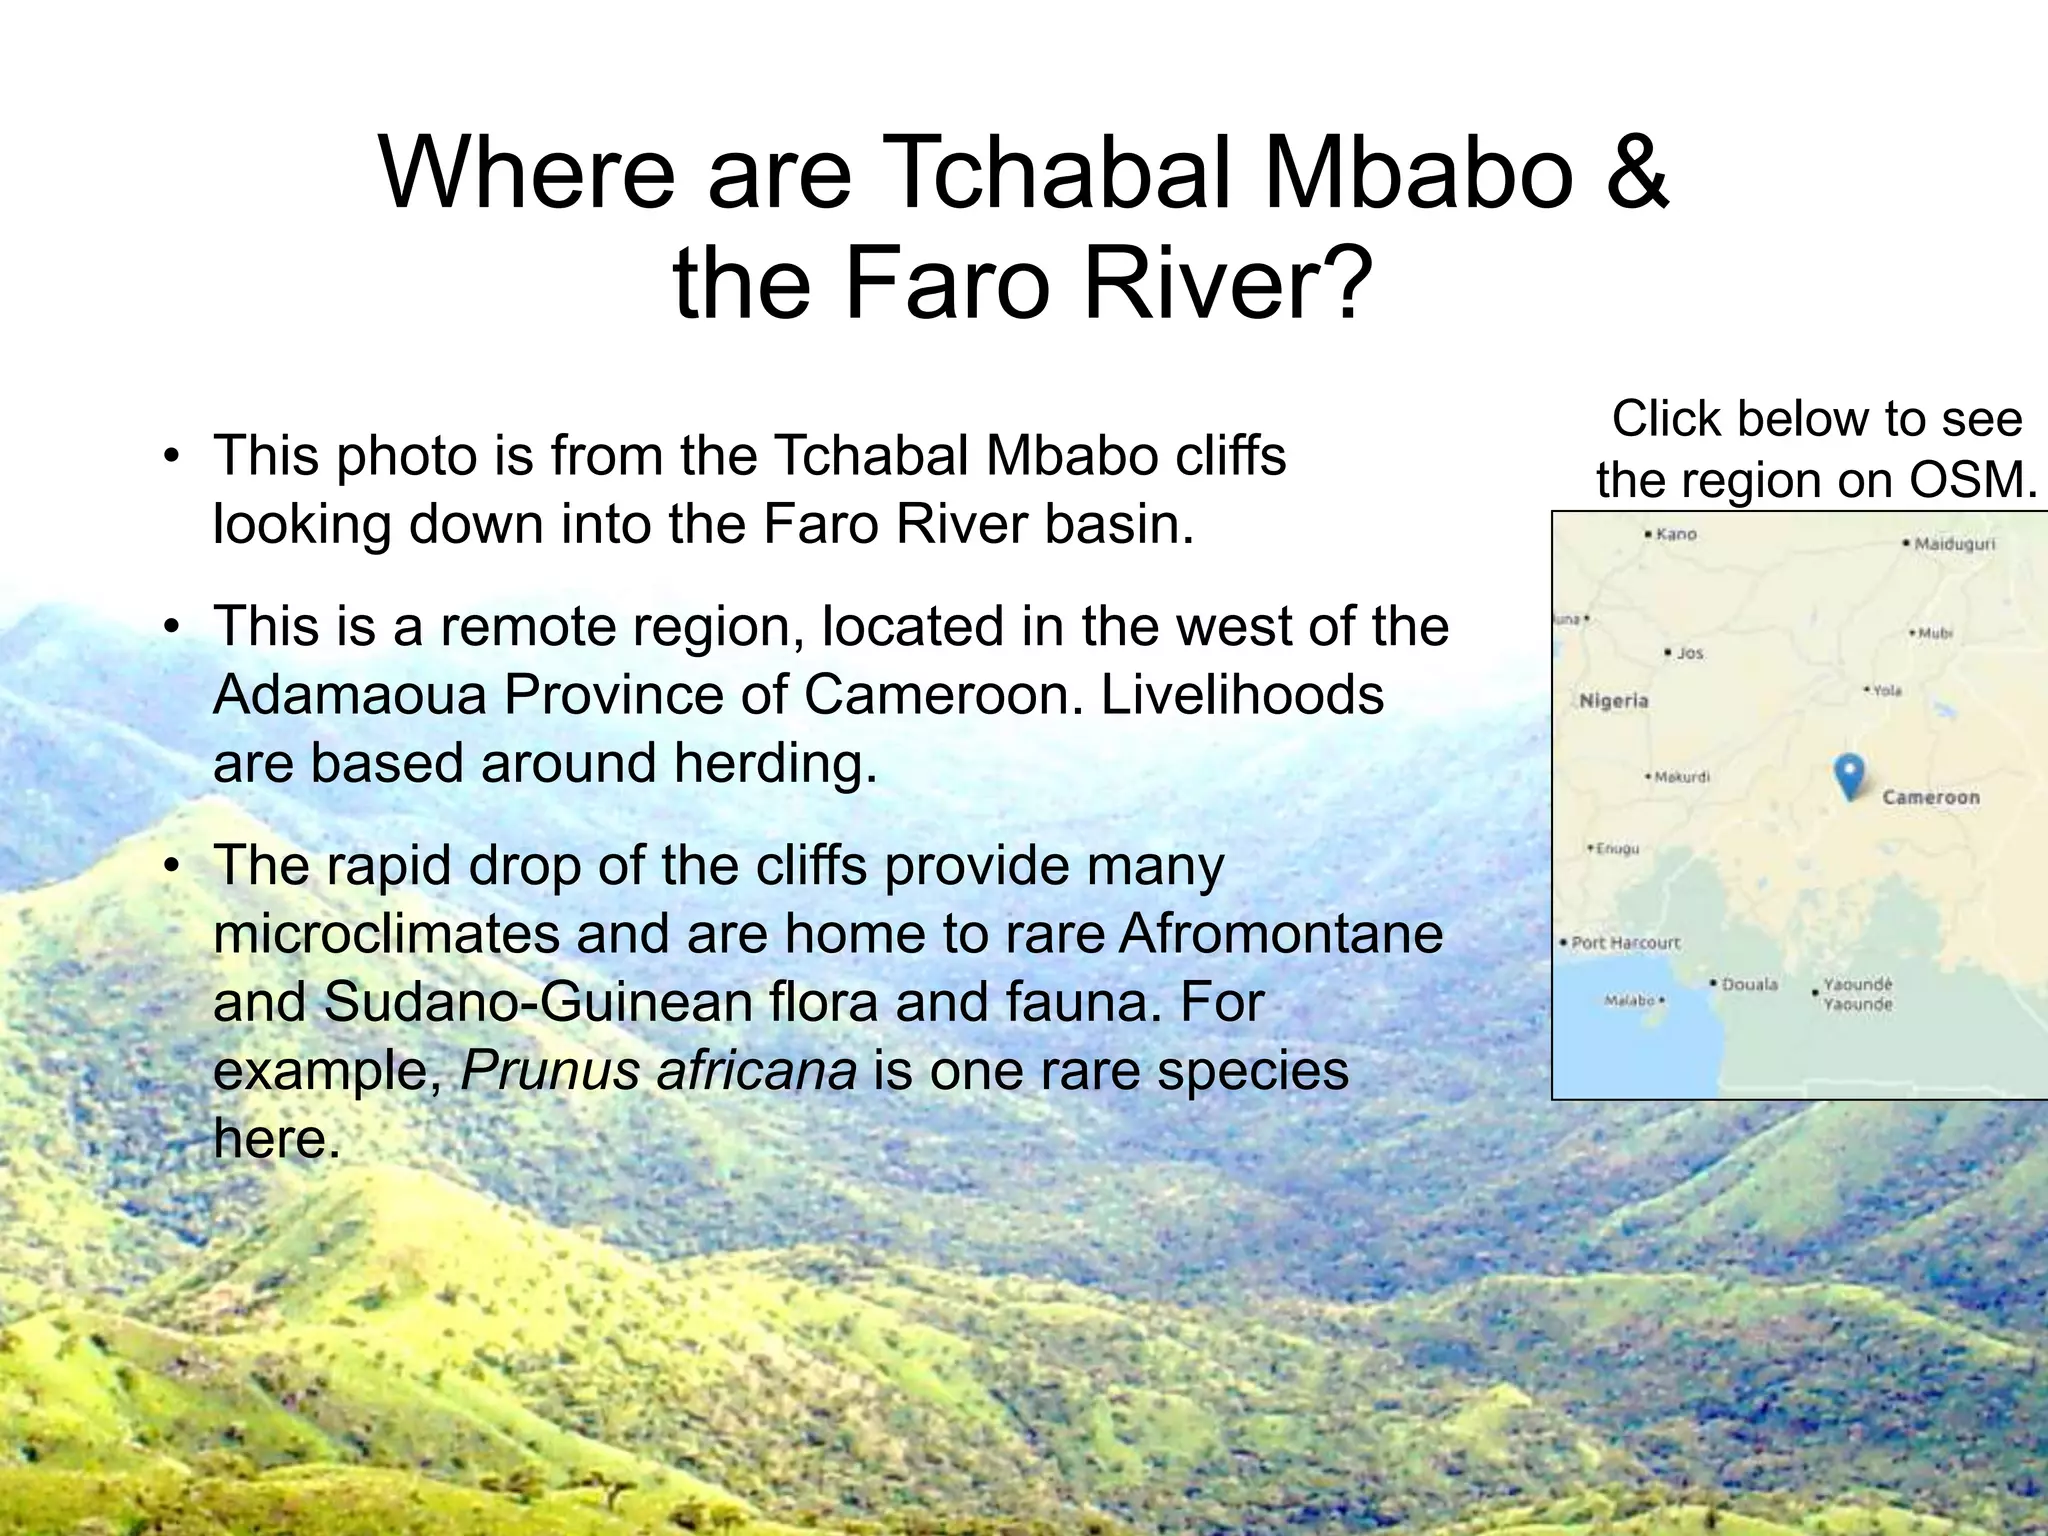

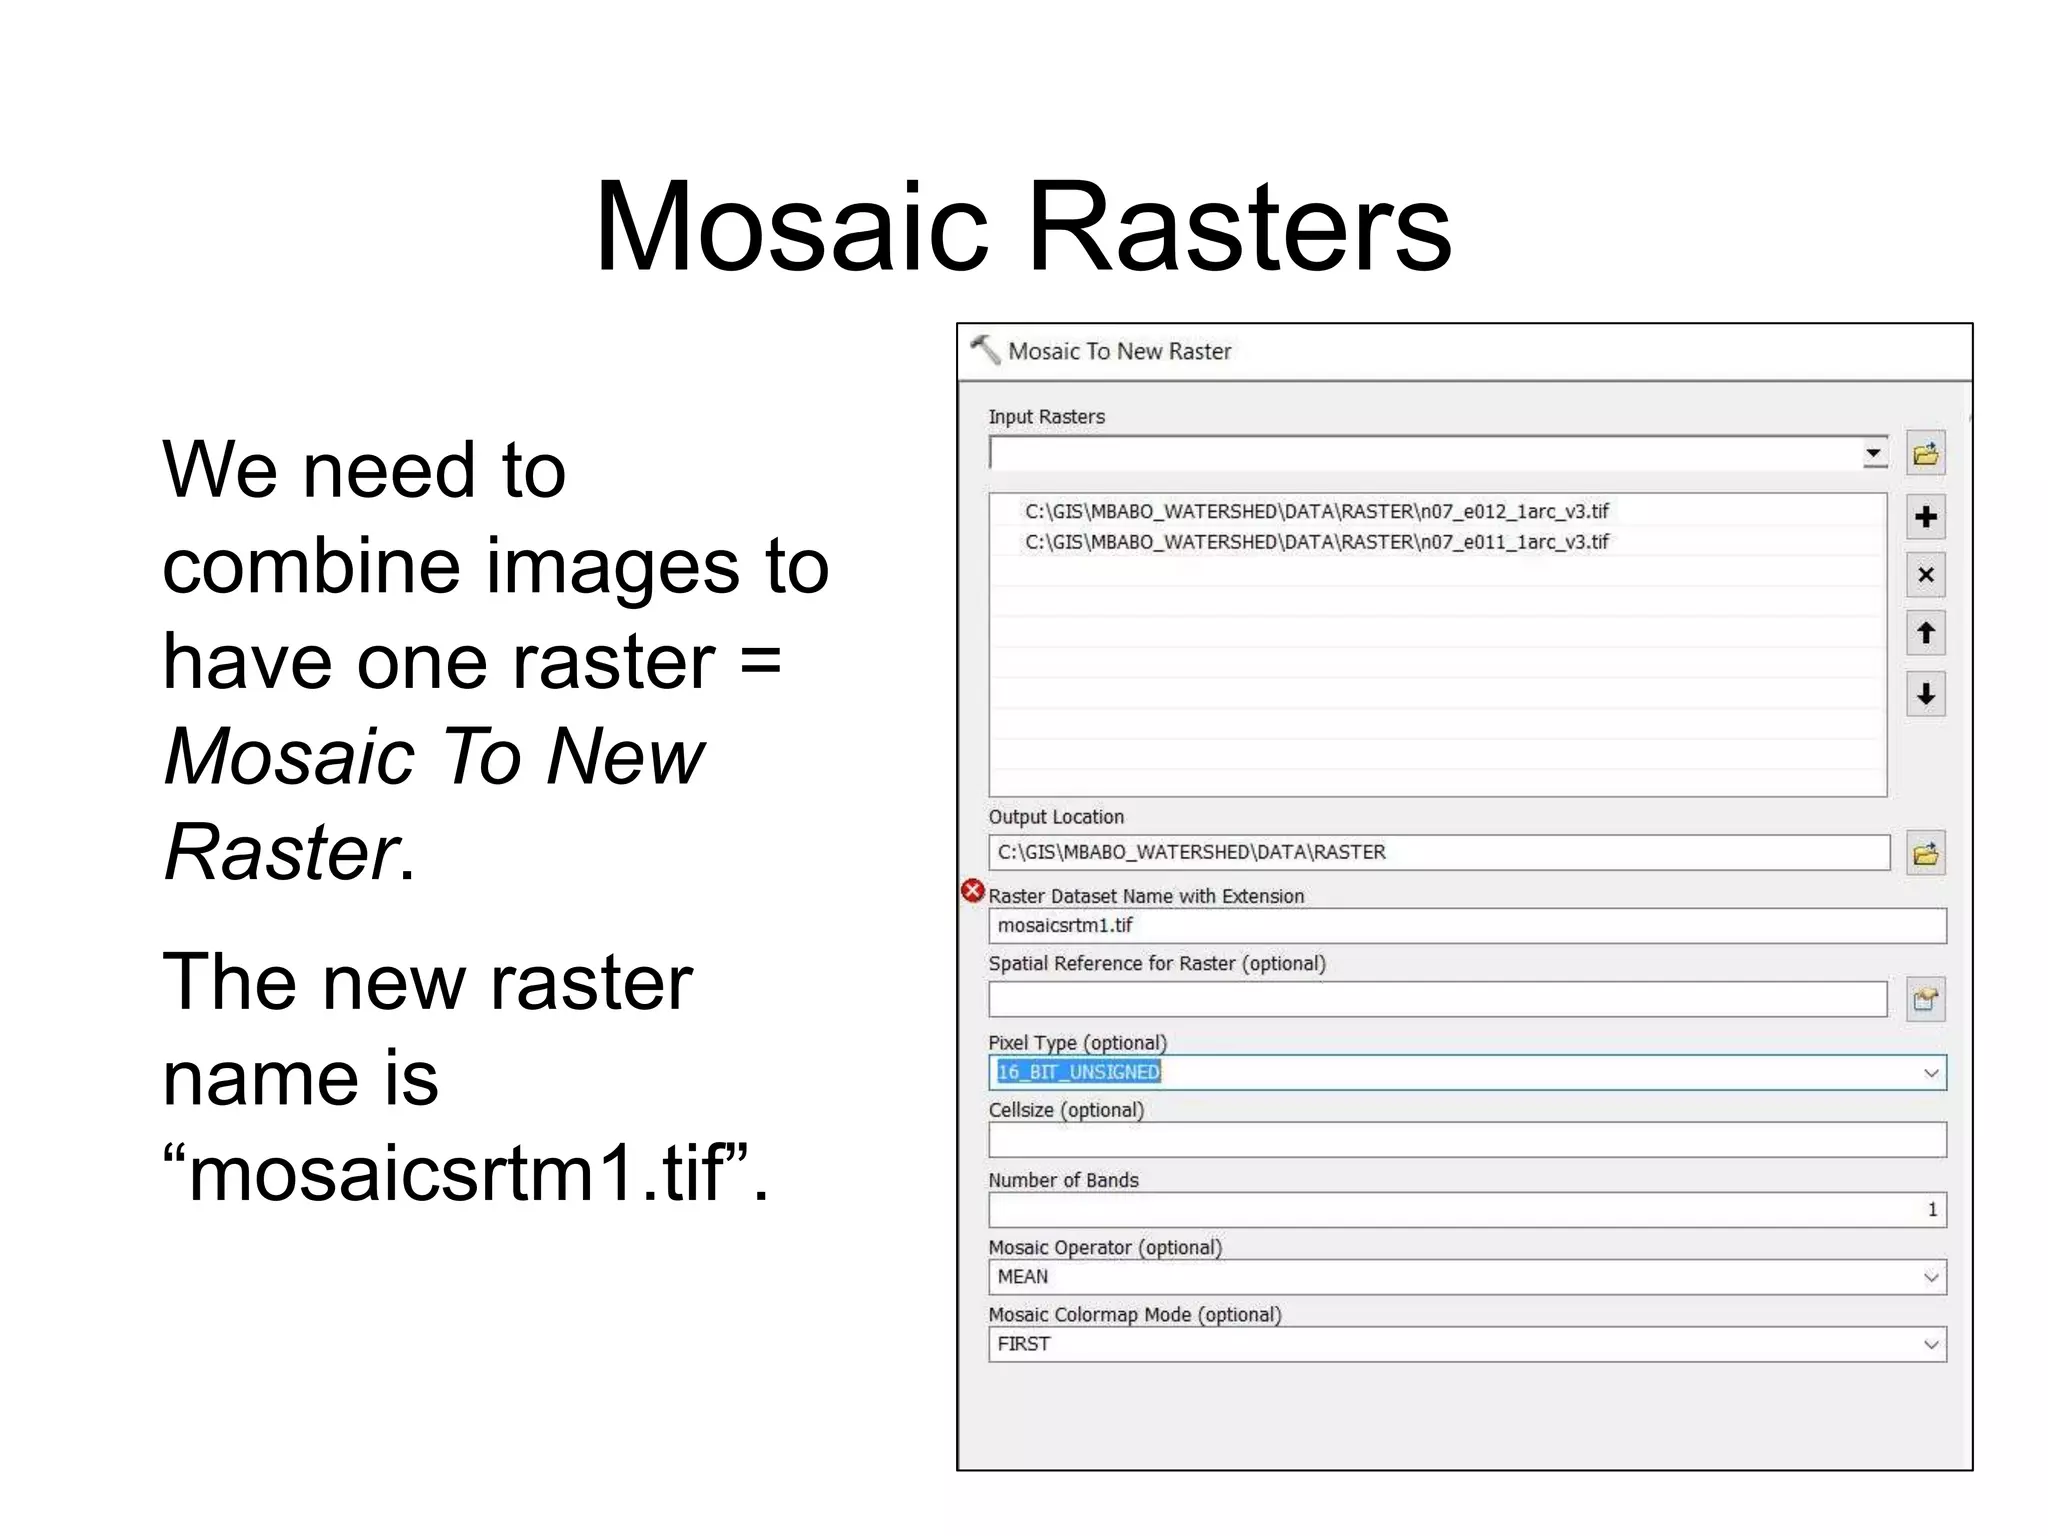
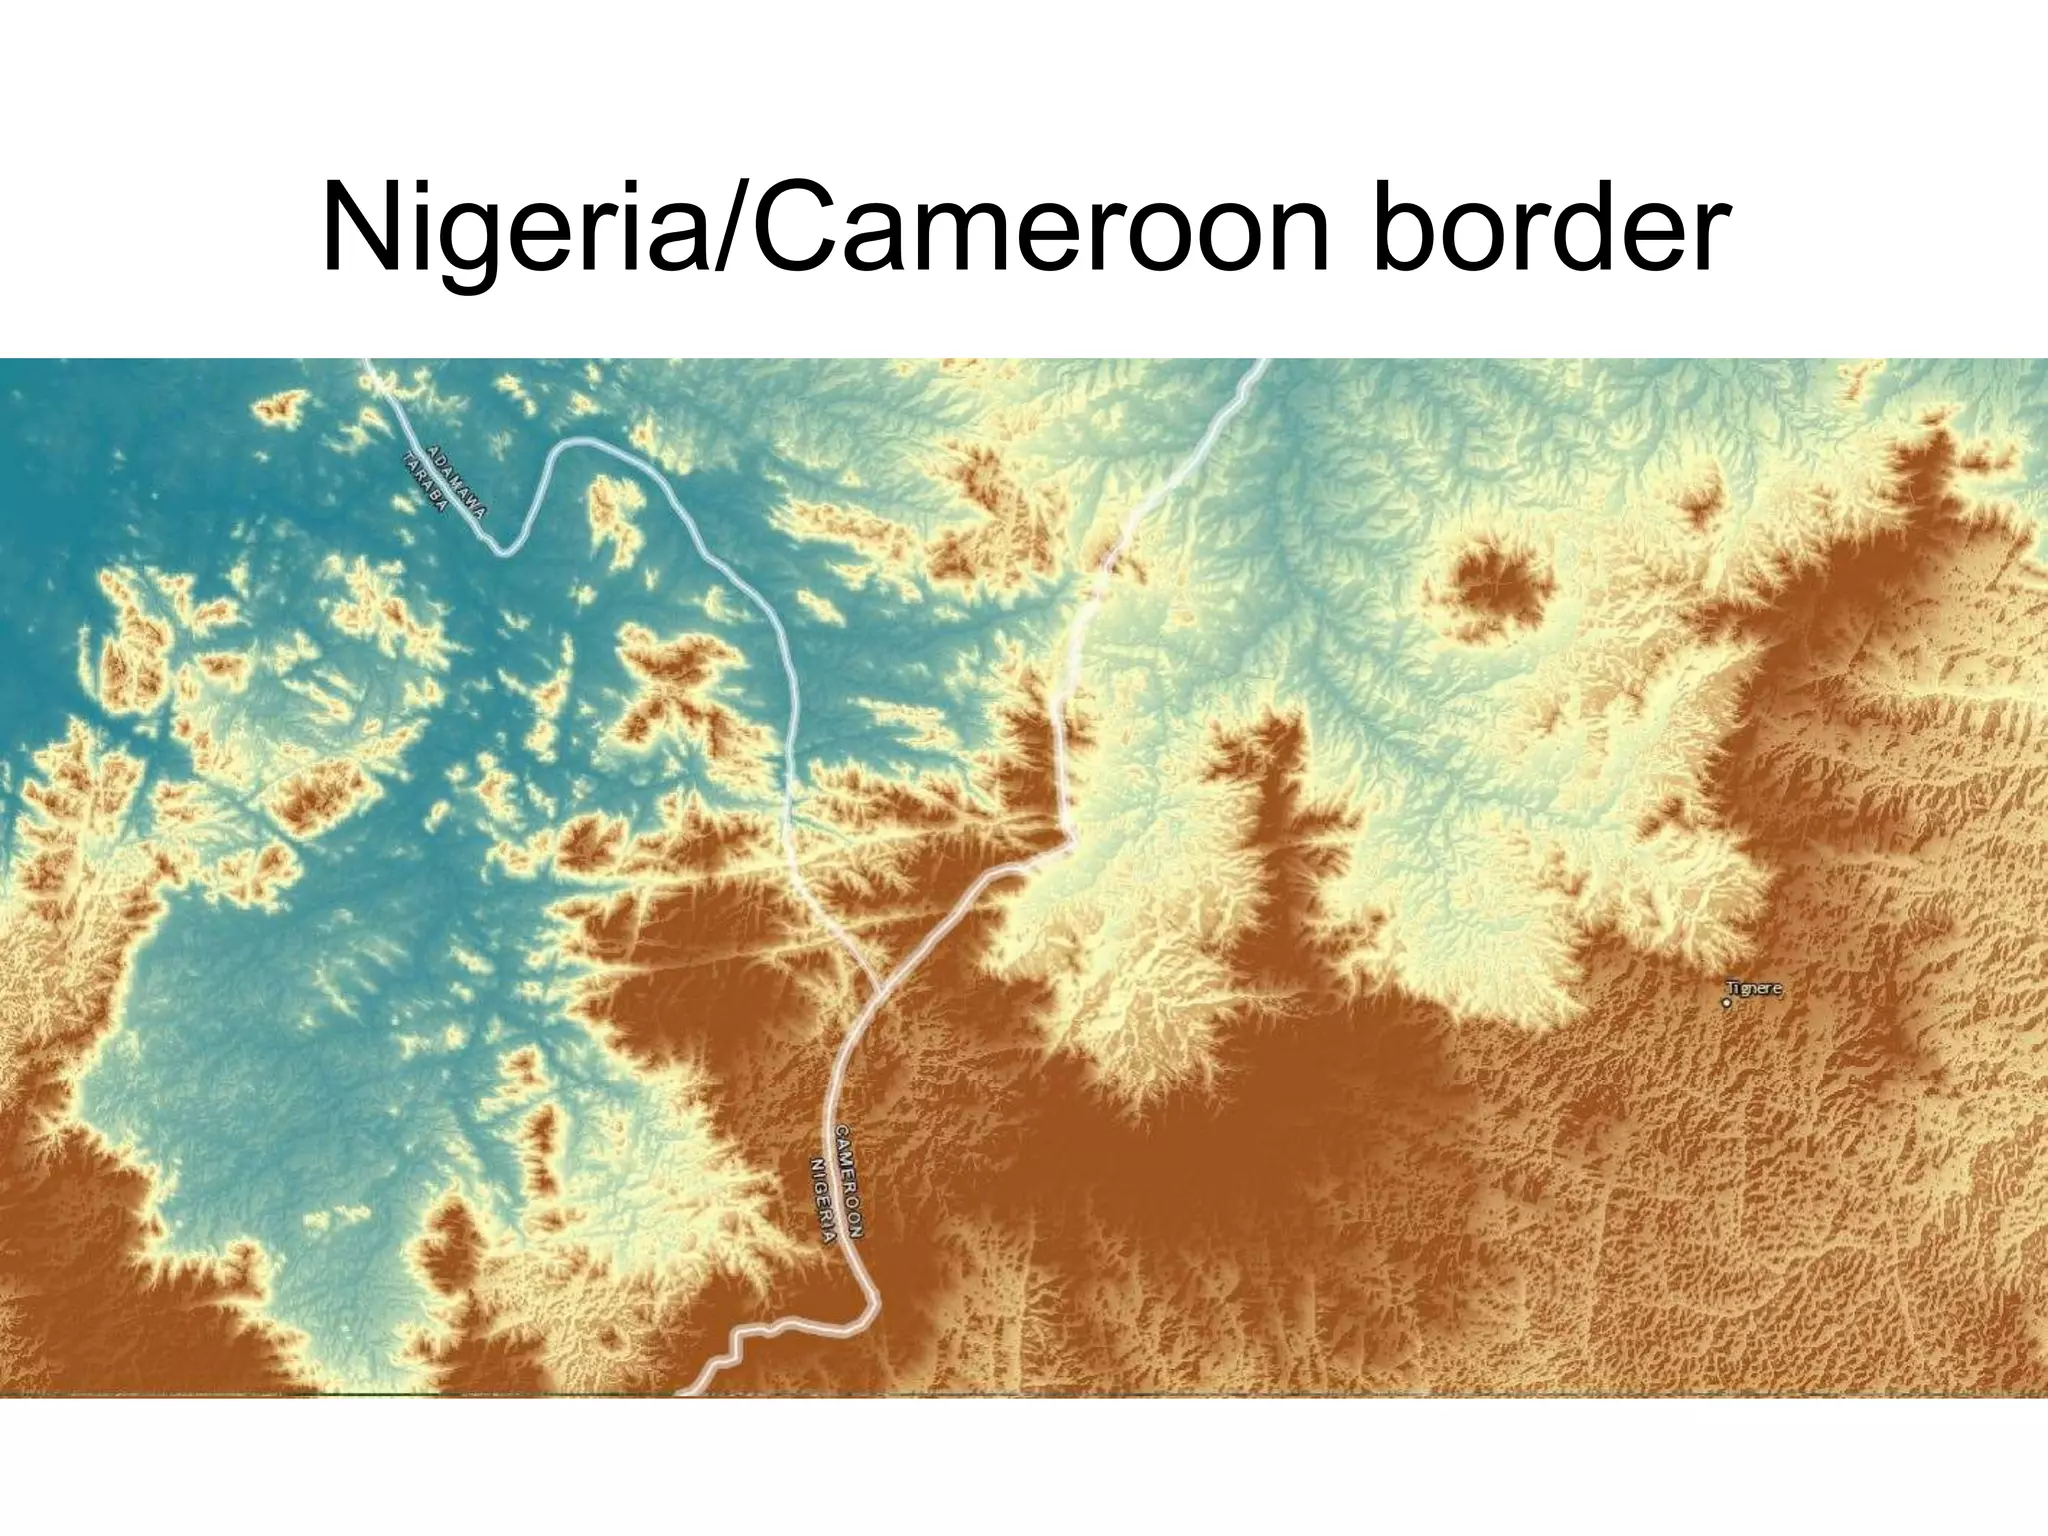


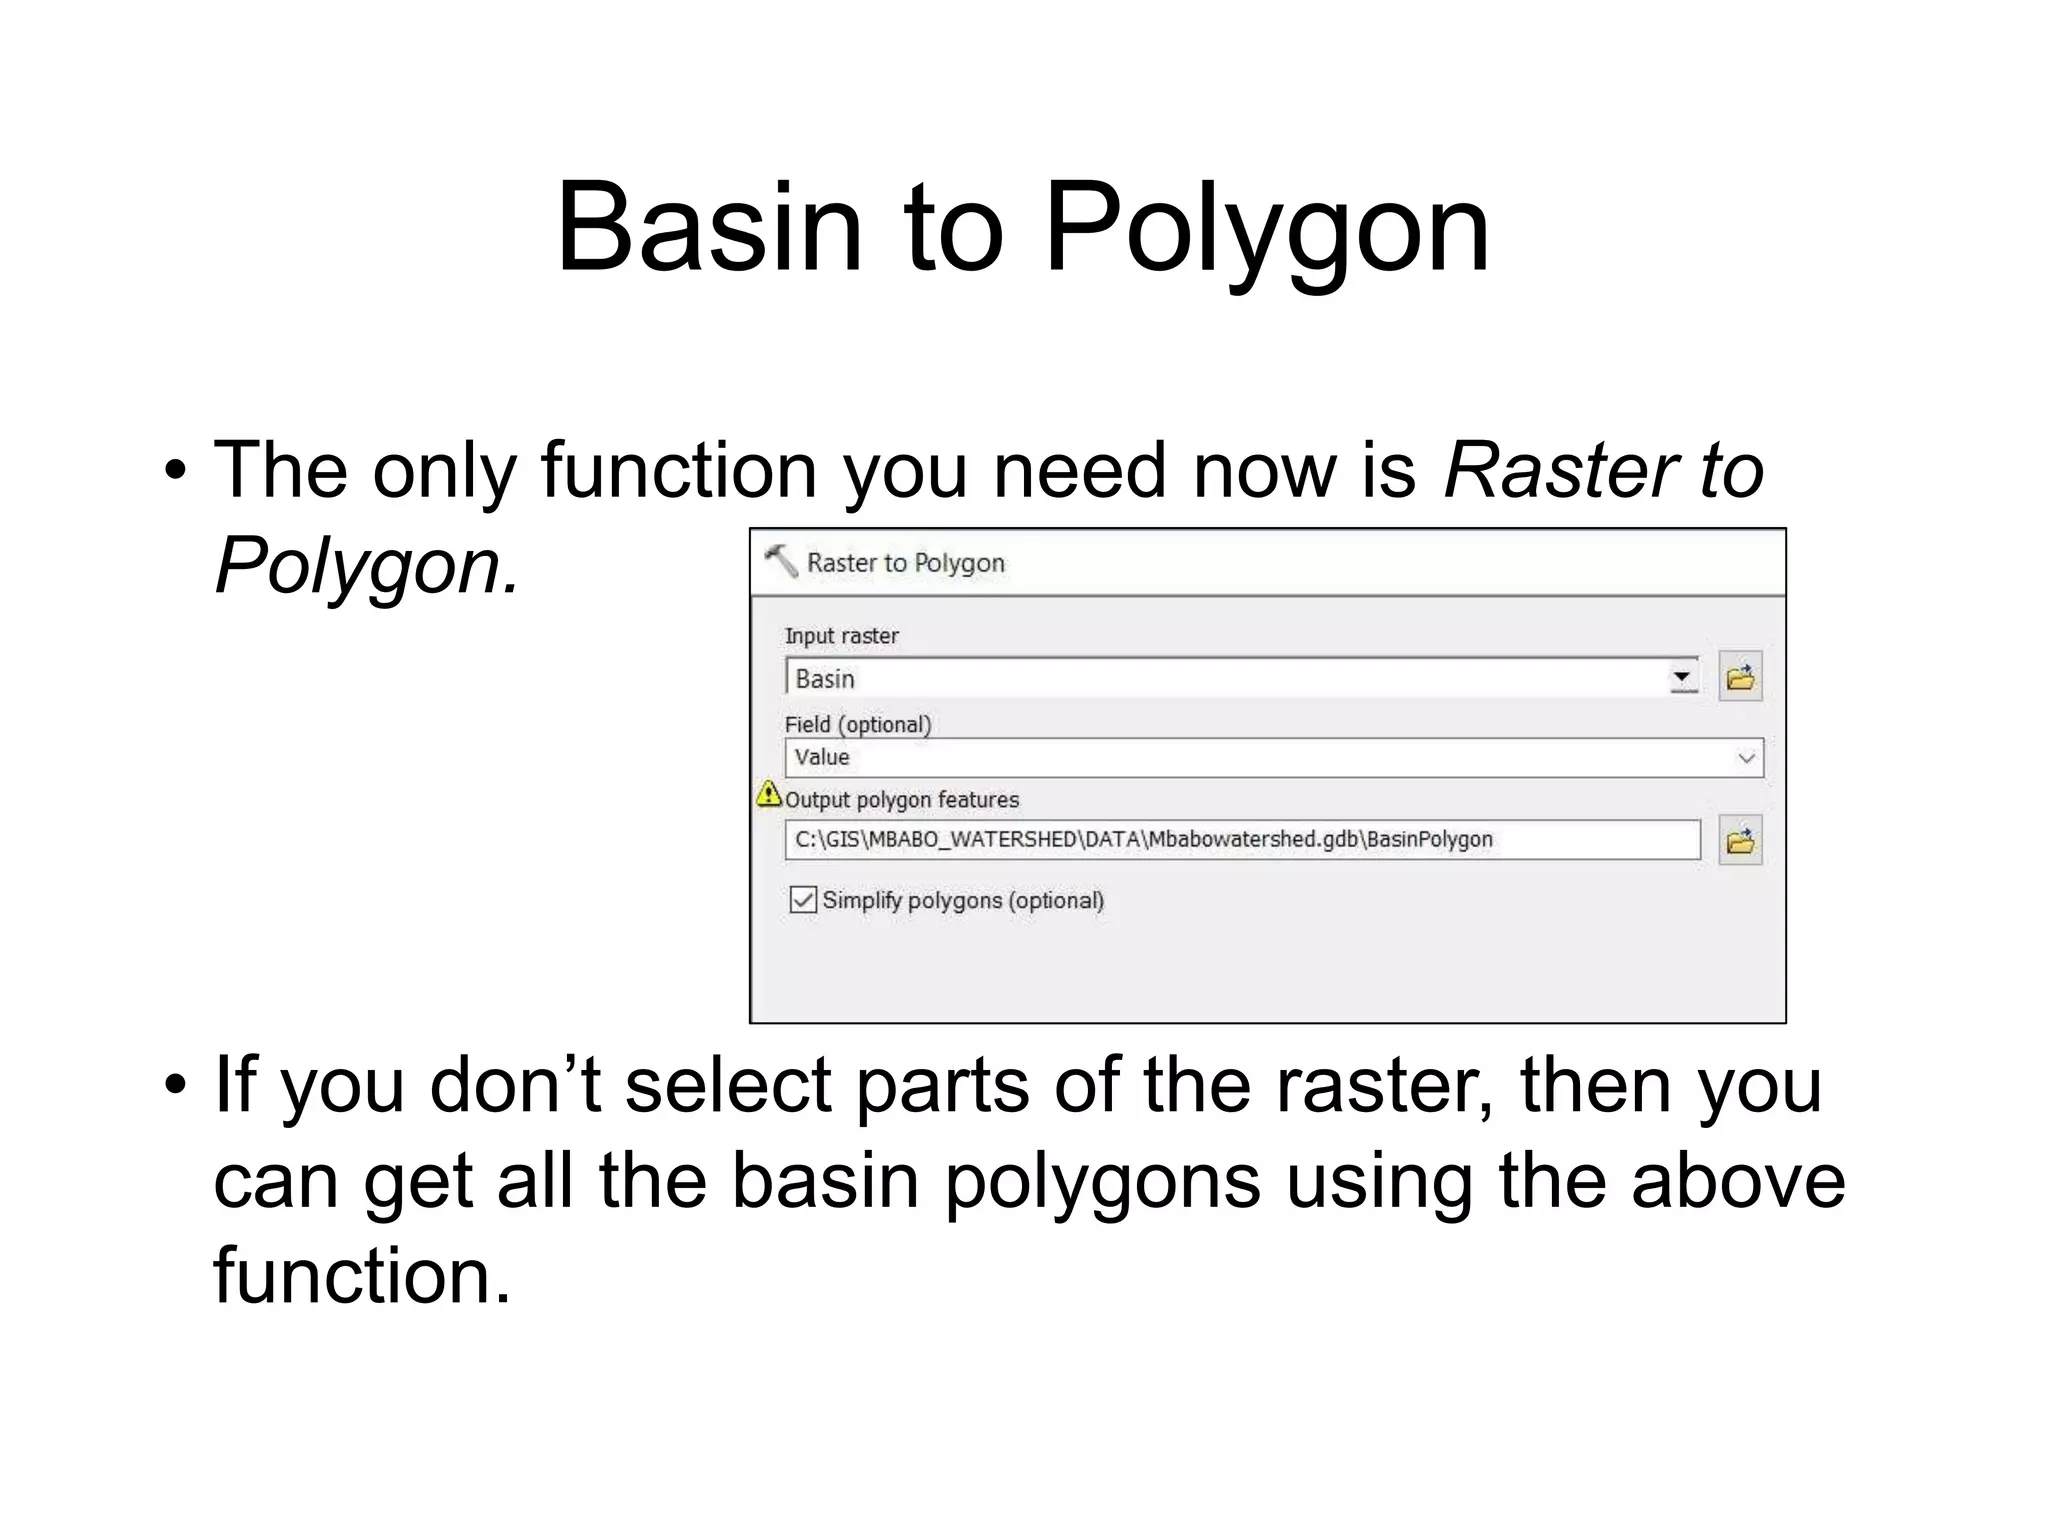
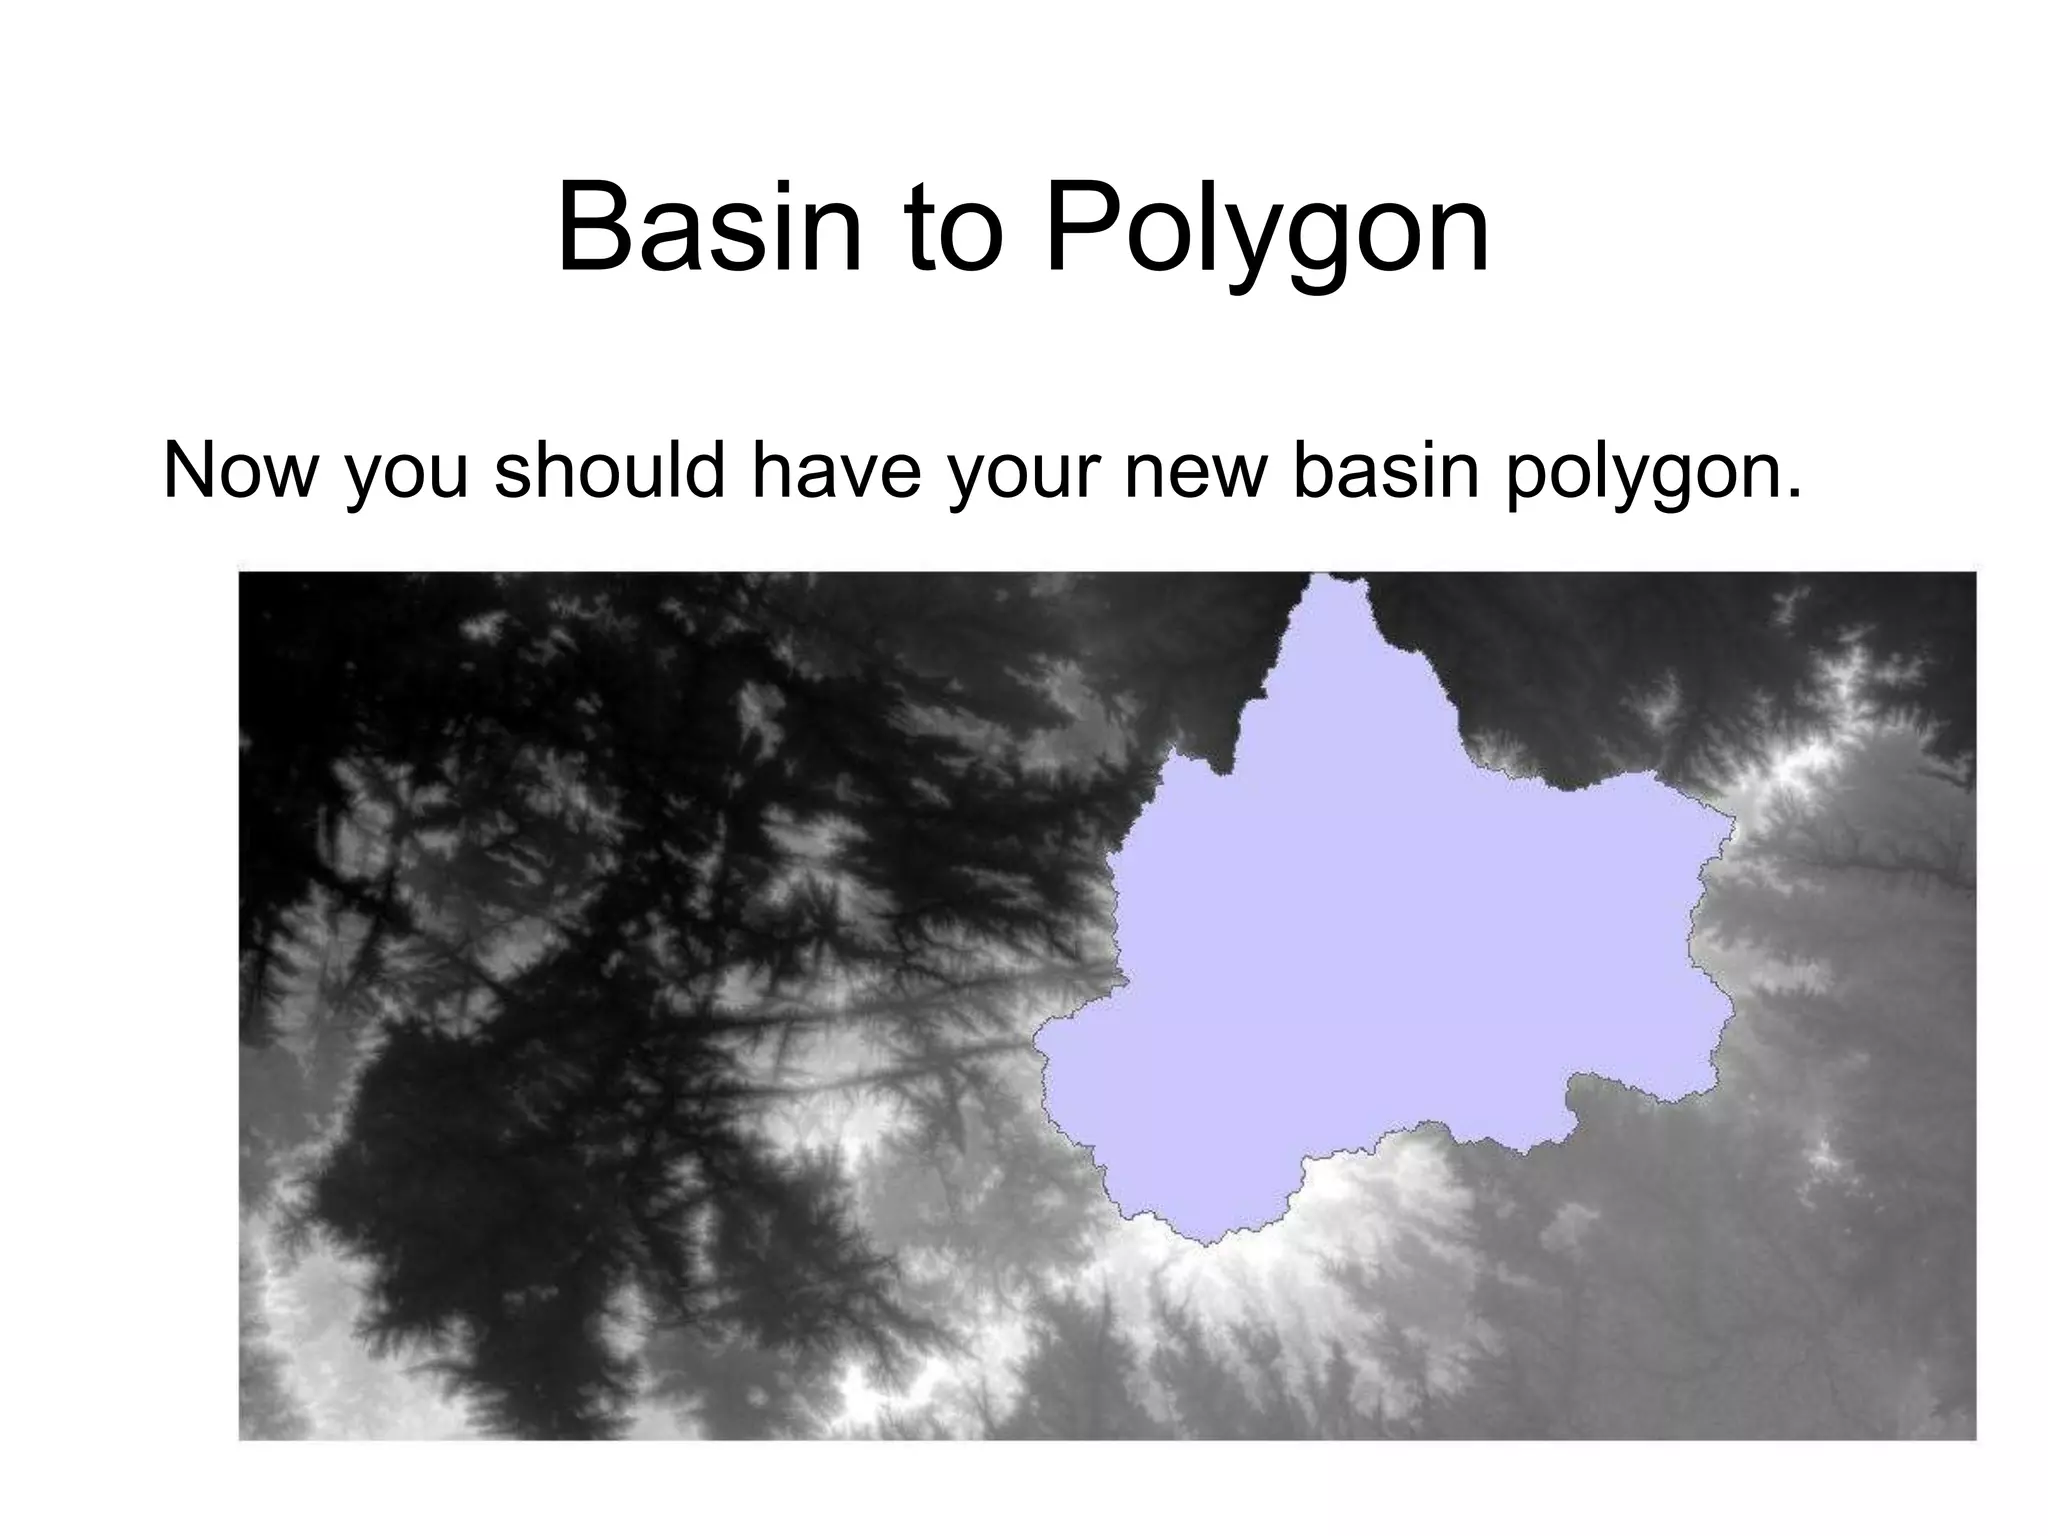
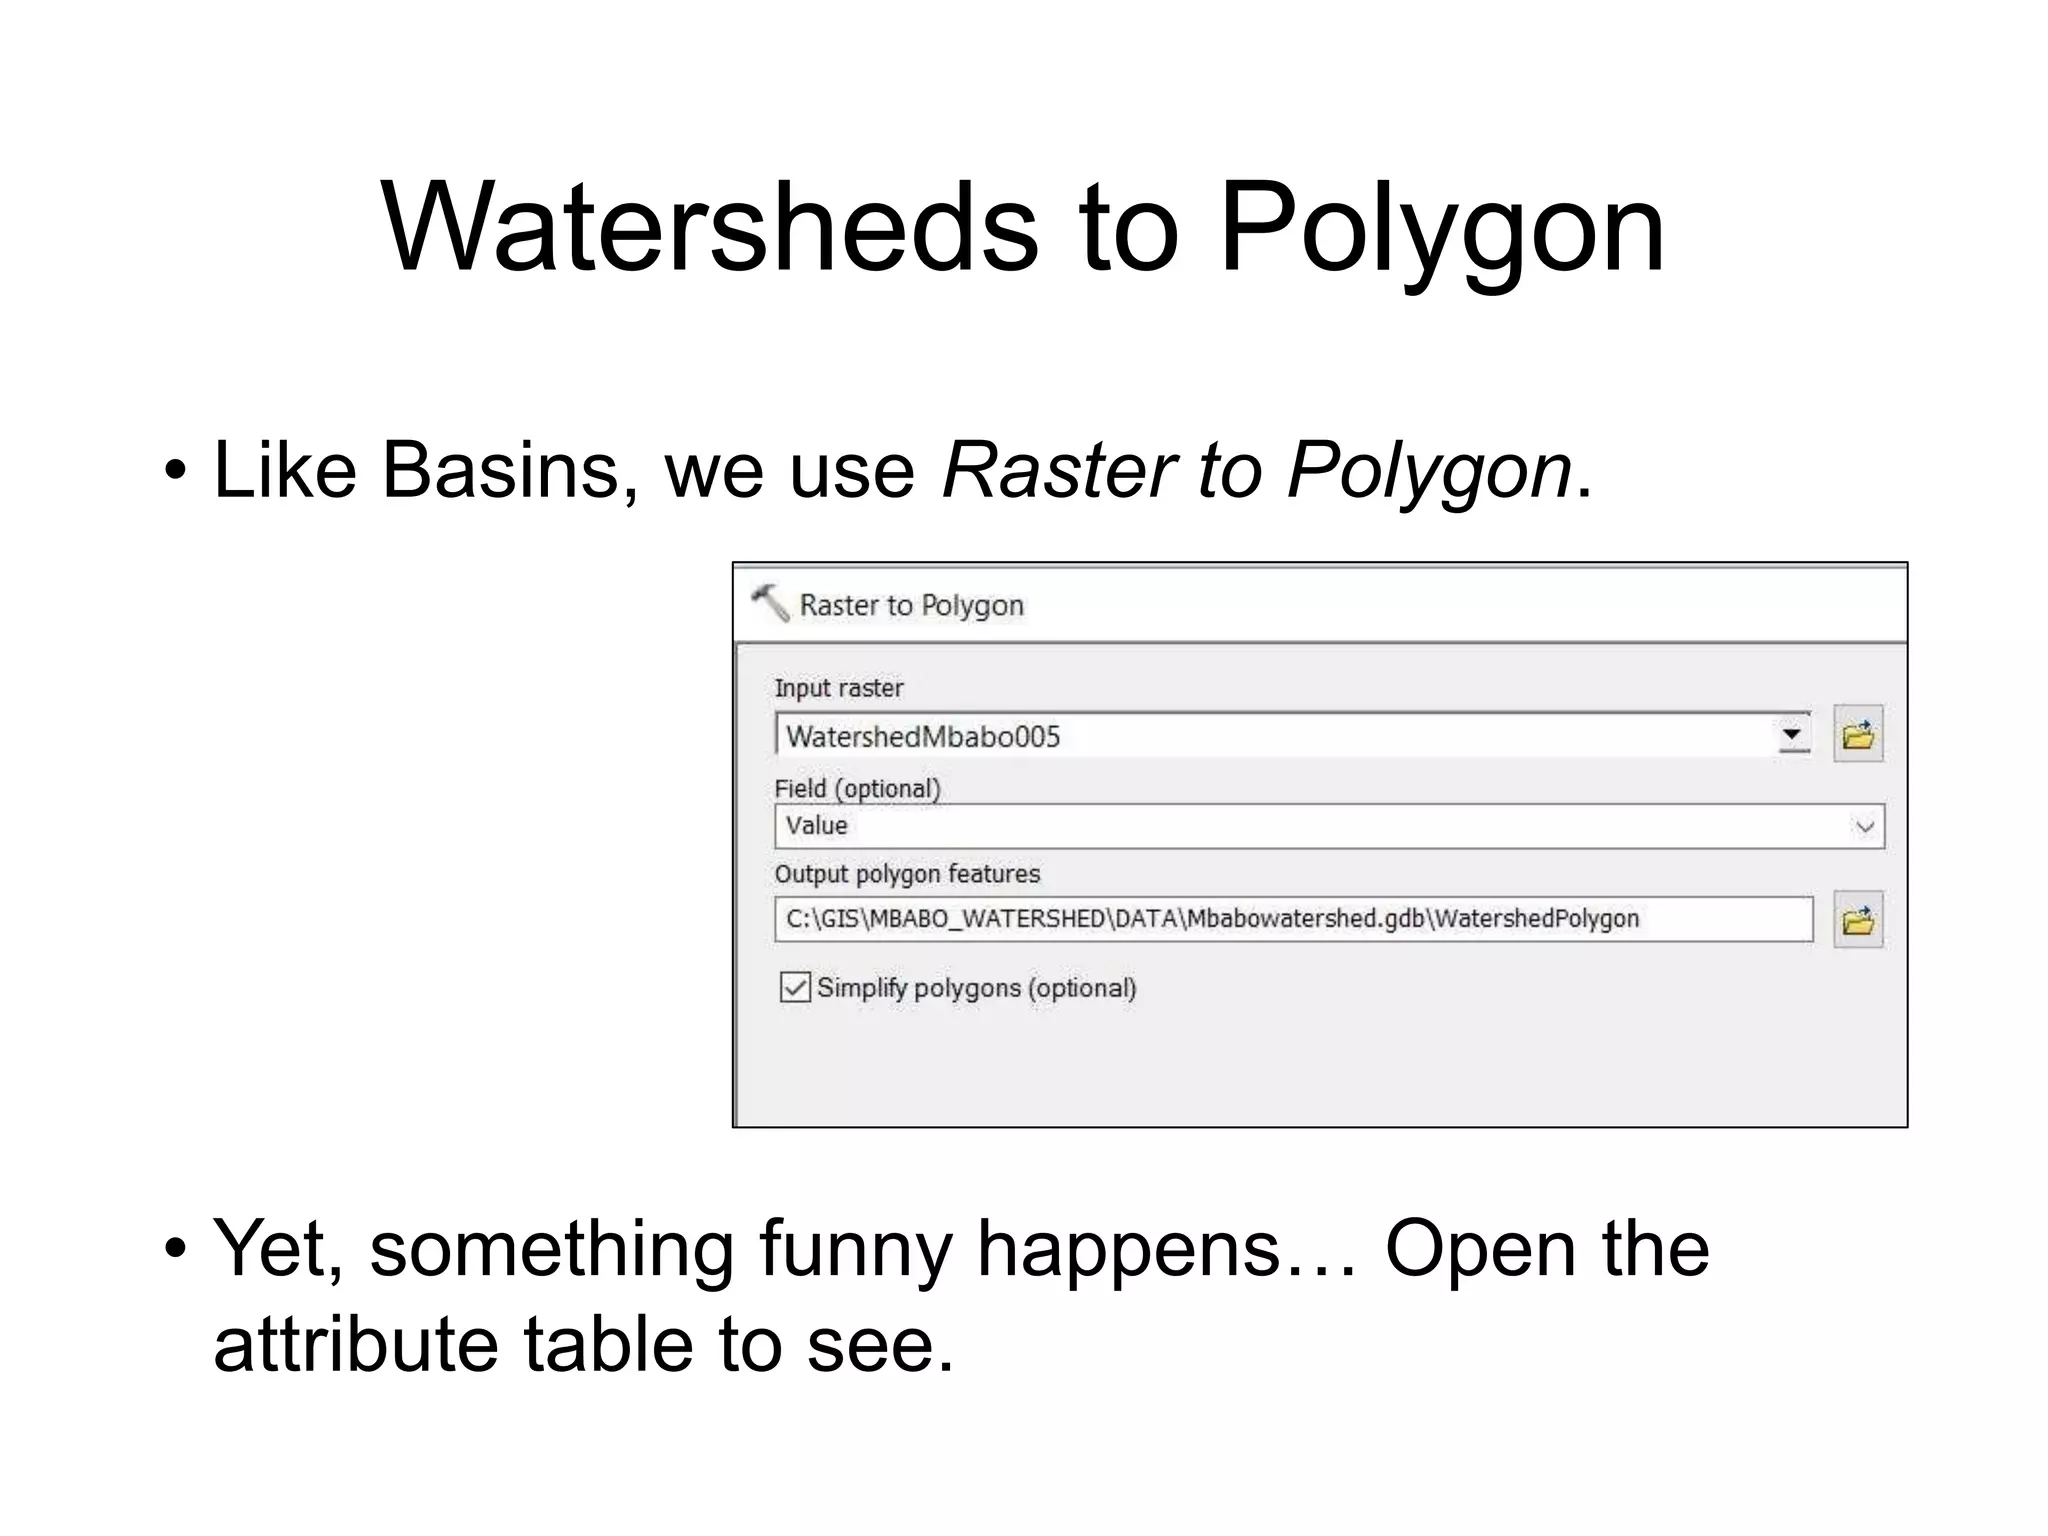
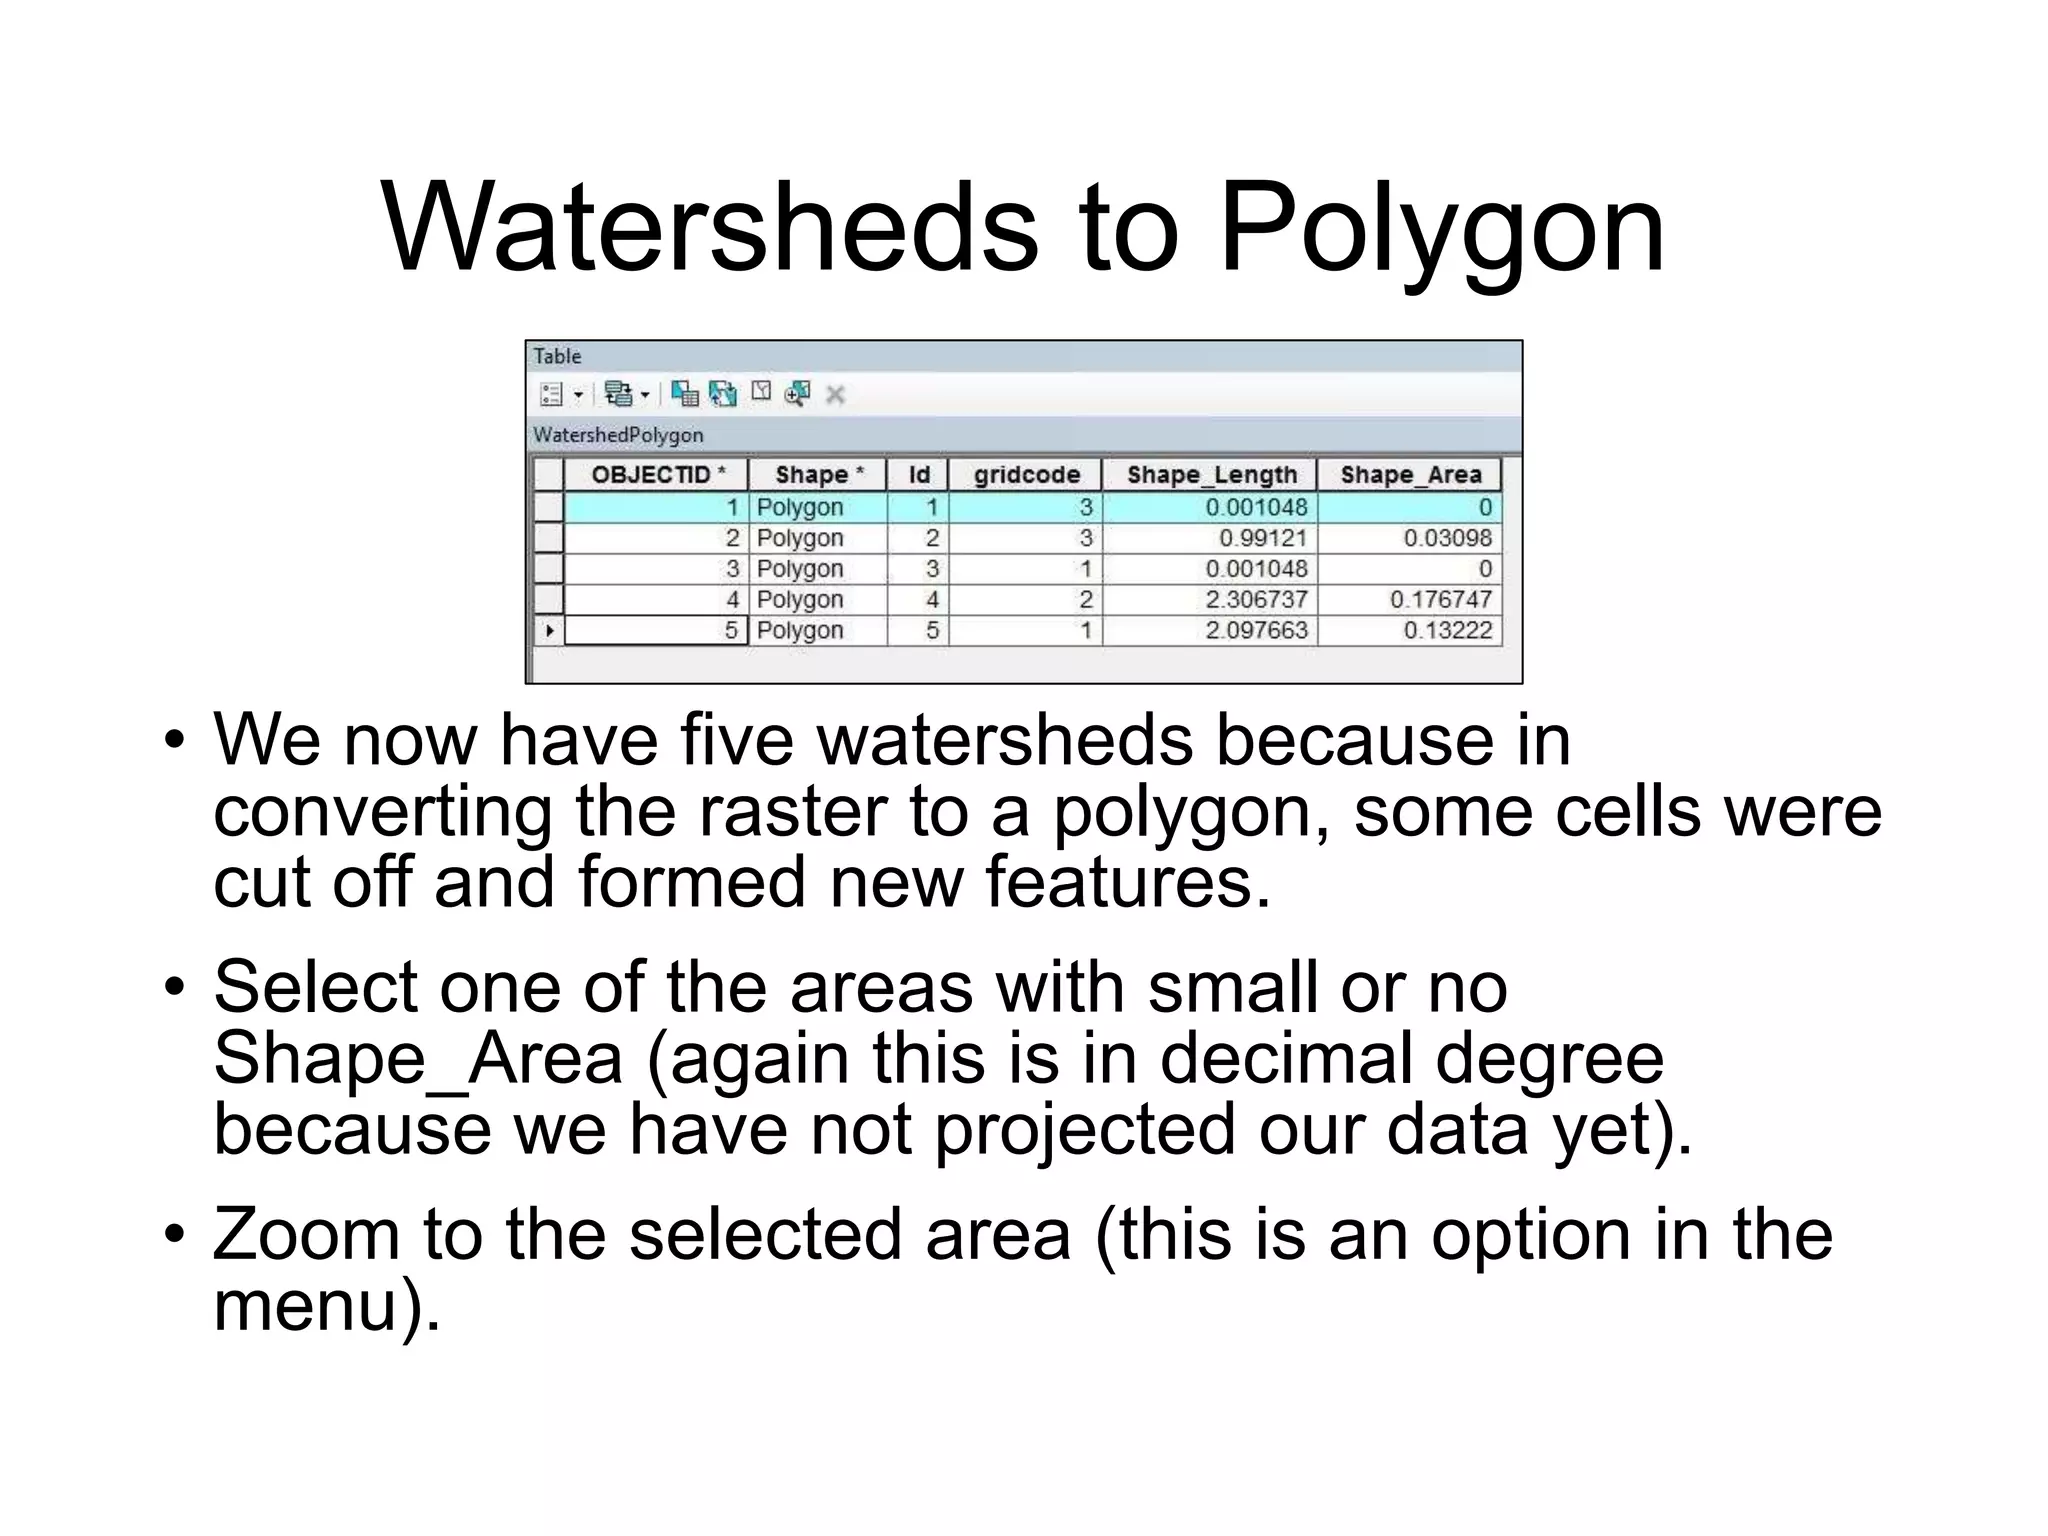


The document is an open training module for geographic information science focused on watershed delineation, specifically developed for students at UBC. It includes instructions on utilizing SRTM data and ArcMap software to derive streams, basins, and analyze watersheds, particularly in the context of studying the Faro River basin's potential to cross the Cameroon-Nigeria border. The training aims to equip learners with practical skills for creating digital elevation models and responding to geographic questions.