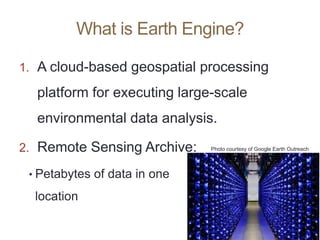
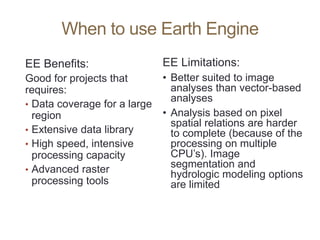
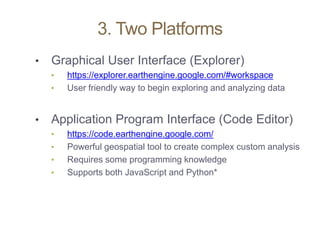
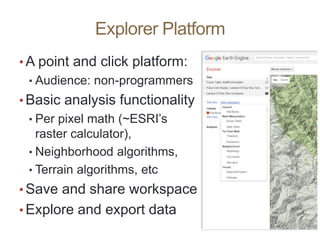
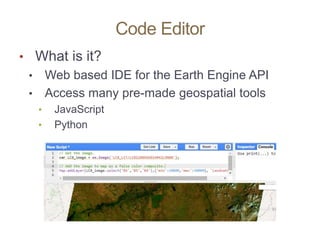
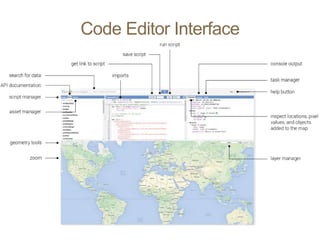
Introduction to
Google Earth Engine
Jumadi
Earth Engine Overview
•What is Google Earth Engine?
•Example Applications
• Two Platforms:
• Code Editor
• Explorer
•Demo
What is Earth Engine?
1. A cloud-based geospatial processing
platform for executing large-scale
environmental data analysis.
2. Remote Sensing Archive:
• Petabytes of data in one
location
Photo courtesy of Google Earth Outreach
What it’s not …
Why is it such a powerful
image analysis software?
1. Public data catalog: vast amounts of publicly
available data (you don’t need to store data)
2. Processing power (computation engine):
1. Distributed computation power
2. Cloud processing (Google’s computer clusters)
3. Comprehensive toolset to analyze data: scientific
algorithms ready for use & the building blocks to
create your own
3. Interactive development platforms:
1. Explorer
2. Code Editor
4. Save and share work routines
1. Earth Engine Public Data Catalog
• Imagery
• Geophysical
• Climate & Weather
• Demographic
• Vector Data
Image: Dave Thau
2. Computation Engine
“The computation engine is a just in time
distributed computation model, a cloud-based
processing infrastructure that automatically
parallelizes analyses on many CPUs across many
computers in Google’s data centers.”
Storage Clusters (petabytes of data)
Computing clusters (1,000’s of CPUs
2. Computation Engine
Storage Clusters (petabytes of data)
Computing clusters (1,000’s of CPUs
2. Computation Engine
• Unprecedented speed: reduce processing
times by orders of magnitude by using the
distributed, cloud-based computing power
• Ease of use and lower costs: online
platform with easy access to data, scientific
algorithms, computational power.
Example Application
Resource Need:
• Map all change between 2000 – 2010 over
a specific forest
• Extent of change
• Year of occurrence
• How would you accomplish this task?
Traditional Method
• Select Area of Interest
• Find WRS path/row(s) – assume an area
of 4 scenes
Data Prep:
• Download and store all Landsat during
growing season (1 GB / zipped scene)
• Extract and layer stack all Landsat (1.75
GB / scene)
• ~48 scenes per year * 11 years = ~528 scenes, or 924 GB
• Apply atmospheric correction (924 more
GB)
• Normalize scenes
• Apply FMASK or similar to remove clouds
and shadows
• Create composite and mosaic by year
• Generate vegetation index per year (NDVI
and/or NBR)
Analysis:
• Build spatial model in ERDAS to compare
year pairs
• Generate change layer
• Classify pixels > certain value as “change”
• Build spatial model to apply year attribute
to each pixel
• Repeat for each year pair
• Build spatial model to stack all attributed
change layers into a single raster image,
with the most recently changed pixel on
top
• Apply color ramp visually demonstrating
change
In Earth Engine It took an
experienced
geospatial
programmer ~1 hour
and 100 lines of code
to get the same
result
Example Application
• Classifying land cover conditions and change
detection:
• Video of deforestation in Brazil
https://earthengine.google.com/timelapse/?location=rondonia
• Global Forest Change Map,
Hansen et al
http://earthenginepartners.appspot.com/science-2013-global-forest
Earth Engine Costs
• It’s free
An excerpt from their website:
“Why is Google working on Earth Engine?
Google's mission is to organize the world's
information and make it universally accessible and
useful. In line with this mission, Earth Engine
organizes geospatial information and makes it
available for analysis. More generally, Google
strives to make the world a better place through the
use of technology. Earth Engine’s technical
infrastructure powers humanitarian, scientific, and
environmental initiatives which Google is proud to
support.”
EE Benefits:
Good for projects that
requires:
• Data coverage for a large
region
• Extensive data library
• High speed, intensive
processing capacity
• Advanced raster
processing tools
EE Limitations:
• Better suited to image
analyses than vector-based
analyses
• Analysis based on pixel
spatial relations are harder
to complete (because of the
processing on multiple
CPU’s). Image
segmentation and
hydrologic modeling options
are limited
When to use Earth Engine
How GTAC uses Earth Engine
• Streamline & Share GIS/RS workflows
• Develop novel methods and algorithms
• Bridge gap between literature &
application
• Create applications to deliver data &
analysis capabilities to non Earth
Engine users
Examples: GTAC use of Earth Engine
• Robust cloud-shadow masking
• Who: USFS Northern Research Station for EPA Great Lakes Restoration Initiative (GLRI)
• Target: Robust cloud shadow removal
• Where: Great Lakes Basins - now being utilized in nearly all EE-based projects
• When: 1984-2014
• Automated retrospective annual forest
disturbance detection
• Who: USFS Forest Health Technology Enterprise Team (FHTET) Operational Remote Sensing
• Target: Both perennial and ephemeral forest disturbance events
• Where: Continental US
• When: Currently a pilot project intended to be implemented annually
• Automated deforestation and degradation
detection
• Who: Lowering Emissions in Asian Forests (LEAF) / UN REDD+
• Target: Perennial forest disturbance events with effects that persist > 2 years
• Where: Madang, Papua New Guinea; Houaphan, Laos; Measa Kongma, Thailand; Lamdong, Vietnam
• When: 2000-2014
Where We Use Earth Engine
USFS EE Use Considerations
1. Google Earth Engine is a free platform that anybody
can set up an account with. If you plan on using it for
operational purposes, please email
jesstclark@fs.fed.us and/or dvanderzanden@fs.fed.us
2. Google offers 256 gigabytes of extra storage space per
user, plus 10 terabytes of shared storage space in
addition to the data catalogs already considerable size.
3. Make sure you consider the sensitivity and privacy of
any data you upload. Sensitive data (e.g. FIA plots)
should be kept within the USFS, and not exposed to
GEE.
3. Two Platforms
• Graphical User Interface (Explorer)
• https://explorer.earthengine.google.com/#workspace
• User friendly way to begin exploring and analyzing data
• Application Program Interface (Code Editor)
• https://code.earthengine.google.com/
• Powerful geospatial tool to create complex custom analysis
• Requires some programming knowledge
• Supports both JavaScript and Python*
Explorer Platform
• A point and click platform:
• Audience: non-programmers
• Basic analysis functionality
• Per pixel math (~ESRI’s
raster calculator),
• Neighborhood algorithms,
• Terrain algorithms, etc
• Save and share workspace
• Explore and export data
Explorer Platform
Cons:
• Limited analysis power:
• subset of tools
• Some collections cannot
be accessed
Code Editor
• What is it?
• Web based IDE for the Earth Engine API
• Access many pre-made geospatial tools
• JavaScript
• Python
Code Editor Interface
Registration Process
• Sign up for an Evaluator account:
• Register here:
https://earthengine.google.com/signup/
• It may take up to one week to be granted access
• If you don’t have access to the developers
forum, sign up here:
• https://groups.google.com/forum/#!forum/google-
earth-engine-developers.
Some Code Editor Benefits
• Allows user to create extremely complex
workflows (batch tasks) using
• any data in Earth Engine, and
• its extremely high speed computation engine
• Workflows can be shared easily between
users
Some Code Editor Cons
• Requires programming knowledge
• Need to be aware of unique GEE classes
and methods
Common Classes
• Images
• Image Collections
• Feature Collections
• Geometries
Demonstration
• https://code.earthengine.google.com/46bf1
bebe7f905c4cf840ecb457d3ad3
• https://explorer.earthengine.google.com/#w
orkspace
Questions?

Introduction to Google Earth Engine .pptx

  • 1.
  • 2.
    Earth Engine Overview •Whatis Google Earth Engine? •Example Applications • Two Platforms: • Code Editor • Explorer •Demo
  • 3.
    What is EarthEngine? 1. A cloud-based geospatial processing platform for executing large-scale environmental data analysis. 2. Remote Sensing Archive: • Petabytes of data in one location Photo courtesy of Google Earth Outreach
  • 4.
  • 5.
    Why is itsuch a powerful image analysis software? 1. Public data catalog: vast amounts of publicly available data (you don’t need to store data) 2. Processing power (computation engine): 1. Distributed computation power 2. Cloud processing (Google’s computer clusters) 3. Comprehensive toolset to analyze data: scientific algorithms ready for use & the building blocks to create your own 3. Interactive development platforms: 1. Explorer 2. Code Editor 4. Save and share work routines
  • 6.
    1. Earth EnginePublic Data Catalog • Imagery • Geophysical • Climate & Weather • Demographic • Vector Data Image: Dave Thau
  • 7.
    2. Computation Engine “Thecomputation engine is a just in time distributed computation model, a cloud-based processing infrastructure that automatically parallelizes analyses on many CPUs across many computers in Google’s data centers.” Storage Clusters (petabytes of data) Computing clusters (1,000’s of CPUs
  • 8.
    2. Computation Engine StorageClusters (petabytes of data) Computing clusters (1,000’s of CPUs
  • 9.
    2. Computation Engine •Unprecedented speed: reduce processing times by orders of magnitude by using the distributed, cloud-based computing power • Ease of use and lower costs: online platform with easy access to data, scientific algorithms, computational power.
  • 10.
    Example Application Resource Need: •Map all change between 2000 – 2010 over a specific forest • Extent of change • Year of occurrence • How would you accomplish this task?
  • 11.
    Traditional Method • SelectArea of Interest • Find WRS path/row(s) – assume an area of 4 scenes Data Prep: • Download and store all Landsat during growing season (1 GB / zipped scene) • Extract and layer stack all Landsat (1.75 GB / scene) • ~48 scenes per year * 11 years = ~528 scenes, or 924 GB • Apply atmospheric correction (924 more GB) • Normalize scenes • Apply FMASK or similar to remove clouds and shadows • Create composite and mosaic by year • Generate vegetation index per year (NDVI and/or NBR) Analysis: • Build spatial model in ERDAS to compare year pairs • Generate change layer • Classify pixels > certain value as “change” • Build spatial model to apply year attribute to each pixel • Repeat for each year pair • Build spatial model to stack all attributed change layers into a single raster image, with the most recently changed pixel on top • Apply color ramp visually demonstrating change
  • 12.
    In Earth EngineIt took an experienced geospatial programmer ~1 hour and 100 lines of code to get the same result
  • 13.
    Example Application • Classifyingland cover conditions and change detection: • Video of deforestation in Brazil https://earthengine.google.com/timelapse/?location=rondonia • Global Forest Change Map, Hansen et al http://earthenginepartners.appspot.com/science-2013-global-forest
  • 14.
    Earth Engine Costs •It’s free An excerpt from their website: “Why is Google working on Earth Engine? Google's mission is to organize the world's information and make it universally accessible and useful. In line with this mission, Earth Engine organizes geospatial information and makes it available for analysis. More generally, Google strives to make the world a better place through the use of technology. Earth Engine’s technical infrastructure powers humanitarian, scientific, and environmental initiatives which Google is proud to support.”
  • 15.
    EE Benefits: Good forprojects that requires: • Data coverage for a large region • Extensive data library • High speed, intensive processing capacity • Advanced raster processing tools EE Limitations: • Better suited to image analyses than vector-based analyses • Analysis based on pixel spatial relations are harder to complete (because of the processing on multiple CPU’s). Image segmentation and hydrologic modeling options are limited When to use Earth Engine
  • 16.
    How GTAC usesEarth Engine • Streamline & Share GIS/RS workflows • Develop novel methods and algorithms • Bridge gap between literature & application • Create applications to deliver data & analysis capabilities to non Earth Engine users
  • 17.
    Examples: GTAC useof Earth Engine • Robust cloud-shadow masking • Who: USFS Northern Research Station for EPA Great Lakes Restoration Initiative (GLRI) • Target: Robust cloud shadow removal • Where: Great Lakes Basins - now being utilized in nearly all EE-based projects • When: 1984-2014 • Automated retrospective annual forest disturbance detection • Who: USFS Forest Health Technology Enterprise Team (FHTET) Operational Remote Sensing • Target: Both perennial and ephemeral forest disturbance events • Where: Continental US • When: Currently a pilot project intended to be implemented annually • Automated deforestation and degradation detection • Who: Lowering Emissions in Asian Forests (LEAF) / UN REDD+ • Target: Perennial forest disturbance events with effects that persist > 2 years • Where: Madang, Papua New Guinea; Houaphan, Laos; Measa Kongma, Thailand; Lamdong, Vietnam • When: 2000-2014
  • 18.
    Where We UseEarth Engine
  • 19.
    USFS EE UseConsiderations 1. Google Earth Engine is a free platform that anybody can set up an account with. If you plan on using it for operational purposes, please email jesstclark@fs.fed.us and/or dvanderzanden@fs.fed.us 2. Google offers 256 gigabytes of extra storage space per user, plus 10 terabytes of shared storage space in addition to the data catalogs already considerable size. 3. Make sure you consider the sensitivity and privacy of any data you upload. Sensitive data (e.g. FIA plots) should be kept within the USFS, and not exposed to GEE.
  • 20.
    3. Two Platforms •Graphical User Interface (Explorer) • https://explorer.earthengine.google.com/#workspace • User friendly way to begin exploring and analyzing data • Application Program Interface (Code Editor) • https://code.earthengine.google.com/ • Powerful geospatial tool to create complex custom analysis • Requires some programming knowledge • Supports both JavaScript and Python*
  • 21.
    Explorer Platform • Apoint and click platform: • Audience: non-programmers • Basic analysis functionality • Per pixel math (~ESRI’s raster calculator), • Neighborhood algorithms, • Terrain algorithms, etc • Save and share workspace • Explore and export data
  • 22.
    Explorer Platform Cons: • Limitedanalysis power: • subset of tools • Some collections cannot be accessed
  • 23.
    Code Editor • Whatis it? • Web based IDE for the Earth Engine API • Access many pre-made geospatial tools • JavaScript • Python
  • 24.
  • 25.
    Registration Process • Signup for an Evaluator account: • Register here: https://earthengine.google.com/signup/ • It may take up to one week to be granted access • If you don’t have access to the developers forum, sign up here: • https://groups.google.com/forum/#!forum/google- earth-engine-developers.
  • 26.
    Some Code EditorBenefits • Allows user to create extremely complex workflows (batch tasks) using • any data in Earth Engine, and • its extremely high speed computation engine • Workflows can be shared easily between users
  • 27.
    Some Code EditorCons • Requires programming knowledge • Need to be aware of unique GEE classes and methods
  • 28.
    Common Classes • Images •Image Collections • Feature Collections • Geometries
  • 29.
  • 30.

Editor's Notes

  • #3 In this quick presentation and demo - you’ll learn what Earth Engine is, and how you can access data and conduct spatial analysis with it. There are two platforms you can choose to interact with Earth Engine – and we’ll briefly explore both today. Since we are limited on time and we have a lot to cover, I’ll address questions at the end of the presentation. Also, because we have such a large group I’ve muted everyone to cut down on white noise. However, do feel free to type them into the chat pod and Nolan will compile them while I demonstrate the software. You can also press star 6 on their phone to unmute and ask a question – however, please leave these questions until the end of the demonstration.
  • #4 It is a cloud-based geospatial processing platform for executing large-scale environmental data analysis. Applications of environmental analyses in Earth Engine include detecting deforestation, classifying land cover, and urban mapping.
  • #5 There has been a lot of confusion lately about the differences between Google Earth, Earth Engine, and Maps Engine. While Google Earth uses products created in Earth Engine (for example, a global cloud-free Landsat mosaic at 15m resolution), they are not directly connected.
  • #6 Three aspects of Earth Engine make it quite powerful as a geospatial processing tool. The first is its extensive public data catalog, the second is the processing power of the computation engine, and the third is its interactive development platforms.
  • #7 In the data catalog, there is over 40 years of current and historical imagery and data in the Earth Engine data library. Available data sets include Imagery – these imagery sets include both raw and pre-processed, georeferenced data products that are ready for use. Examples include NAIP, comprehensive Landsat archive, and MODIS data and ancillary products such as global composites and max NDVI. Geophysical data – such as digital elevation models, surface temperature, and land cover Climate and weather – NASA’s TOMS atmospheric data and – forecast weather and climate model data Demographic data – such as population density estimates Users are also able to load in their own data – both imagery and vector files to use for analysis.
  • #8 This means that the analysis requests are sent out to many different computers; each computer runs the calculations on a small area (small number of pixels) and returns the results. Requests are also efficient – it only computes for the input data of your requested values or to the extent of your screen. Results are then cached so that multiple requests for the same image or values do not result in re-computation. This results in: – unprecedented speed: reduce processing times by orders of magnitude by using the cloud-based computing power – Ease of use and lower costs. Online platform with easy access to data, scientific algorithms, computational power.
  • #9 This means that the analysis requests are sent out to many different computers; each computer runs the calculations on a small area (small number of pixels) and returns the results. Requests are also efficient – it only computes for the input data of your requested values or to the extent of your screen. Results are then cached so that multiple requests for the same image or values do not result in re-computation. This results in: – unprecedented speed: reduce processing times by orders of magnitude by using the cloud-based computing power – Ease of use and lower costs. Online platform with easy access to data, scientific algorithms, computational power.
  • #10 This means that the analysis requests are sent out to many different computers; each computer runs the calculations on a small area (small number of pixels) and returns the results. Requests are also efficient – it only computes for the input data of your requested values or to the extent of your screen. Results are then cached so that multiple requests for the same image or values do not result in re-computation. This results in: – unprecedented speed: reduce processing times by orders of magnitude by using the cloud-based computing power – Ease of use and lower costs. Online platform with easy access to data, scientific algorithms, computational power.
  • #12 To solve the resource problem in question using traditional methods, we’d need to find and download individual Landsat scenes. Because of clouds, we’d look to download all images acquired during a growing season so we could use the best possible pixel during a year in our cloud-free composite. The amount of data needed to do such a process is mind-boggling (~1TB just to extract the necessary Landsat scenes in a relatively small area of interest, such as a district). Then we need to start doing the necessary data prep, such as image normalization, atmospheric correction, cloud-shadow busting, compositing, etc. Finally, we need to generate vegetation indices for each scene to help facilitate the change mapping. With the data prep done, we would then start creating models to classify / threshold each pixel into change/no-change, then attribute each pixel with “when” the change occurred. Finally, we’d need to stack all the change layers back together with the most recent changed pixel on top and then display that spatially. Whew! This would take months to accomplish this process.
  • #13 The new method took an experienced geospatial programmer about an hour and ~100 lines of code to generate a raster layer showing the extent of landscape change thematically colored by year of change (in this case, yellow changed closer to the year 2000 and red colors changed closer to 2010. Users can change the AOI very simply and run this same process anywhere in the world, then export the results to a raster TIFF image. This represents an extremely dramatic improvement in efficiency. In fact, it allows us to ask new questions.
  • #14 It is a cloud-based geospatial processing platform for executing large-scale environmental data analysis. Applications of environmental analyses in Earth Engine include detecting deforestation, classifying land cover, and urban mapping.
  • #18 Some of the major remote sensing analyses we’ve performed in Earth Engine are shown on this slide. The cloud-shadow masking we perform for the GLRI project is now used in nearly all our other projects due to its effectiveness.
  • #21 Earth Engine’s geospatial processing algorithms and API interface enables interactive algorithm development. These include basic spatial analysis operations (overlay, map algebra, vector based extraction of image statistics, etc.) and more advanced algorithms such as image classification, terrain modeling, and time series analysis. Results can be reported as charts, maps, tables, or image exports. Google Earth Engine algorithms and user-submitted sample scripts – are constantly being added, enhanced, and updated – enabled by an open source environment. Highly interactive algorithm development – a web based IDE for rapid proto-typing and visualization of complex spatial analyses across the world. Read more here: https://earthengine.google.com/platform/ Two Platforms Explorer - a light-weight web app with point and click processing. Code Editor - an IDE where users can program analysis scripts in either JavaScript or python. This allows the user to take advantage of a larger suite of Earth Engine processing algorithms and methods and create more complicated workflows. Both platforms include a mapping window for instant visualization of results and data export capabilities. You have to register to access computational power in either platform; although you can visualize data in the Explorer without having an account.
  • #25 Point out the Data search bar – this is similar to the one we saw in Explorer Scripts and docs – Scripts Manager - a wide variety of preloaded example scripts to provide simple examples of API usage; Shared and your scripts can also be saved here – in the private scripts area; Documentation List – a searchable list of documentation for the predefined GEE object types and methods (functions). Text editor – write and edit code here. Click run to execute script. Map output area – visualize the results of your query or analysis Information panel - inspector, console, and tasks. Inspector - locate information about the layers in your map, Console - return messages as the scripts run and record any errors, Manage the exporting of data and results to your google drive. The Help dropdown menu in the upper right hand corner of the screen has many nice documents. The Feature Tour is a nice introduction that points out the different panels and features of the Code Editor.
  • #26 Earth Engine’s geospatial processing algorithms and API interface enables interactive algorithm development. These include basic spatial analysis operations (overlay, map algebra, vector based extraction of image statistics, etc.) and more advanced algorithms such as image classification, terrain modeling, and time series analysis. Results can be reported as charts, maps, tables, or image exports. Google Earth Engine algorithms and user-submitted sample scripts – are constantly being added, enhanced, and updated – enabled by an open source environment. Highly interactive algorithm development – a web based IDE for rapid proto-typing and visualization of complex spatial analyses across the world. Read more here: https://earthengine.google.com/platform/ Two Platforms Explorer - a light-weight web app with point and click processing. Code Editor - an IDE where users can program analysis scripts in either JavaScript or python. This allows the user to take advantage of a larger suite of Earth Engine processing algorithms and methods and create more complicated workflows. Both platforms include a mapping window for instant visualization of results and data export capabilities. You have to register to access computational power in either platform; although you can visualize data in the Explorer without having an account.
  • #30 Workspace- Landsat 5 8 Day composite -August 13, 2011 – Aug 21, 2011 -July 28, 1985 – Aug 5, 1985 -Zoom in to GSL in UT to show change over time (between the two dates)