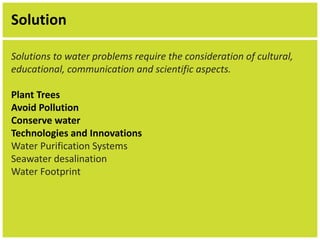
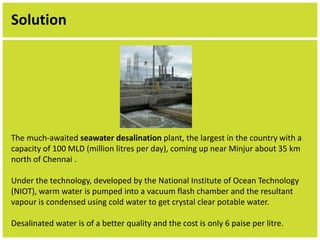
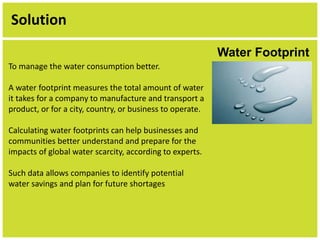
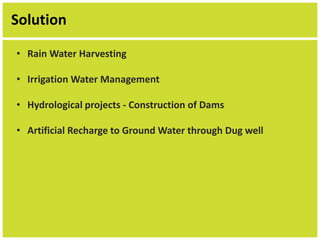
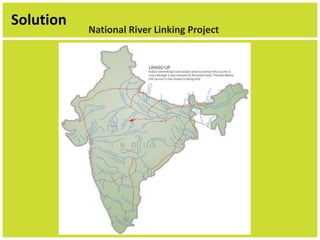
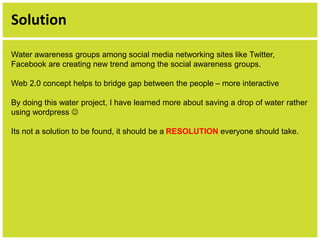
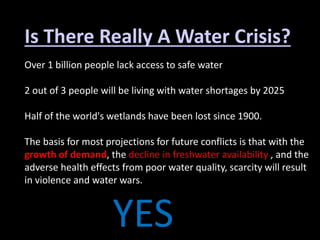
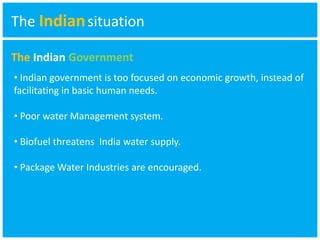
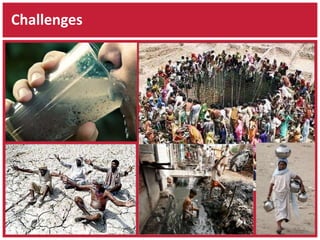
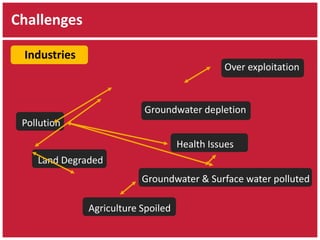
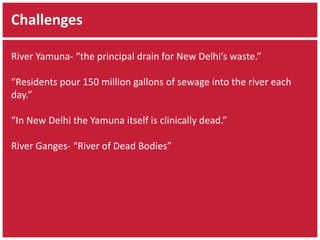
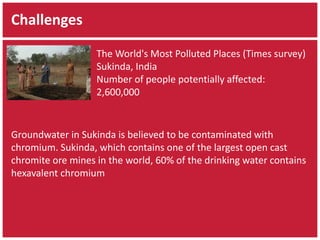
The document discusses the global and Indian water crisis. It notes that over 1 billion people lack access to safe water and 2 out of 3 people will face water shortages by 2025. In India, groundwater is being depleted, surface water is polluted, and rainfall is being wasted. This puts pressure on India's population and economic growth. Some solutions proposed include investing in desalination plants, implementing water footprinting to improve conservation, harvesting rainwater, and increasing awareness through social media. However, addressing the water crisis requires consideration of cultural, educational, technological and scientific factors.

![? Why…
[Situation]](https://image.slidesharecdn.com/waterpollution-140910080357-phpapp01/85/Water-pollution-4-320.jpg)
![TheIndian situation
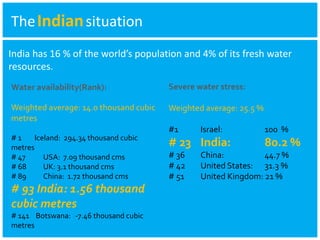
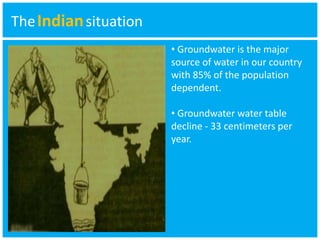
• Groundwater [Depleted]
• Surface water [Polluted]
• Rainfall [Wasted]
• Population [ ]
• Demand [ ]
• Consumption [ ]
SCARCITY
• Agriculture [ ]
• Health & Environment[ ]
• Future [ ? ]
• Industrial Growth [ ]
• Economy-Industry [ ]
• Water Business[ ]](https://image.slidesharecdn.com/waterpollution-140910080357-phpapp01/85/Water-pollution-9-320.jpg)

![? How…
[Problem]](https://image.slidesharecdn.com/waterpollution-140910080357-phpapp01/85/Water-pollution-16-320.jpg)
![Signs of hope…
[Solution]](https://image.slidesharecdn.com/waterpollution-140910080357-phpapp01/85/Water-pollution-30-320.jpg)