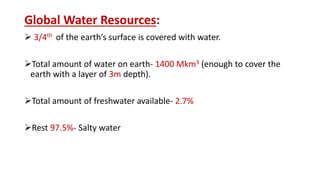
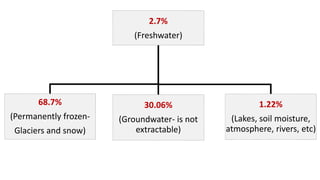
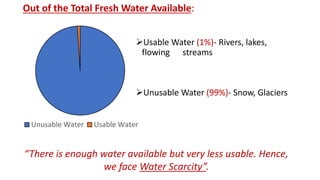
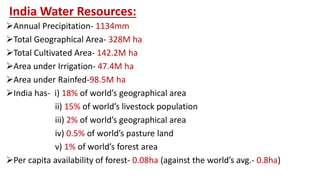
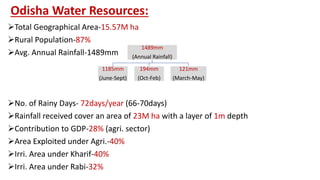
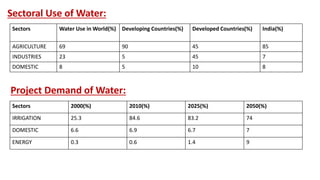
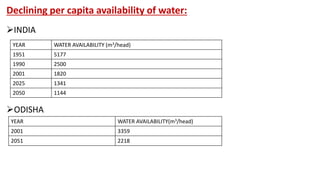
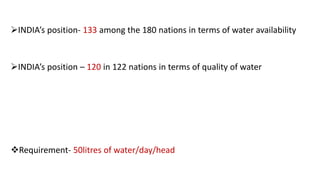
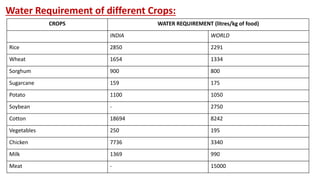
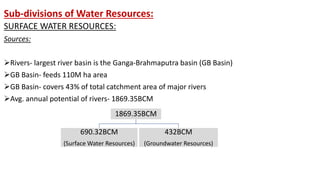
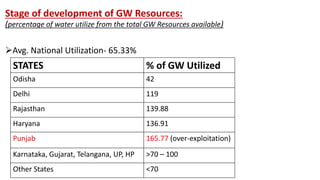
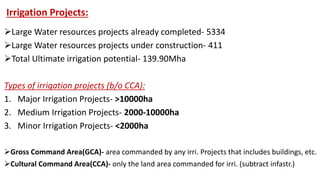
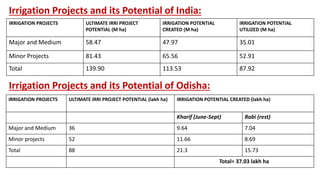
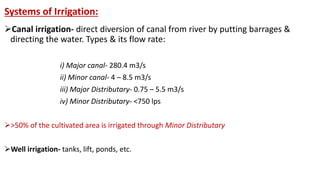
Water Resources:
Sources of water that are useful to human.
Uses- agriculture, industry, household, recreational,
environmental activities, etc.
Water- renewable resource, yet the world’s supply of
clean, freshwater is steadily decreasing.
Global Water Resources:
 3/4th of the earth’s surface is covered with water.
Total amount of water on earth- 1400 Mkm3 (enough to cover the
earth with a layer of 3m depth).
Total amount of freshwater available- 2.7%
Rest 97.5%- Salty water
2.7%
(Freshwater)
68.7%
(Permanently frozen-
Glaciers and snow)
30.06%
(Groundwater- is not
extractable)
1.22%
(Lakes, soil moisture,
atmosphere, rivers, etc)
Fig.- https://en.wikipedia.org/wiki/Water_resources#/media/File:Earth's_water_distribution.svg
A graphical distribution of the
locations of water on Earth
Only 3% of the Earth's water is
fresh water
Most of it is in icecaps and
glaciers (69%) and groundwater
(30%)
all lakes, rivers and swamps
combined only account for a
small fraction (0.3%)
Unusable Water Usable Water
Out of the Total Fresh Water Available:
Usable Water (1%)- Rivers, lakes,
flowing streams
Unusable Water (99%)- Snow, Glaciers
“There is enough water available but very less usable. Hence,
we face Water Scarcity”.
India Water Resources:
Annual Precipitation- 1134mm
Total Geographical Area- 328M ha
Total Cultivated Area- 142.2M ha
Area under Irrigation- 47.4M ha
Area under Rainfed-98.5M ha
India has- i) 18% of world’s geographical area
ii) 15% of world’s livestock population
iii) 2% of world’s geographical area
iv) 0.5% of world’s pasture land
v) 1% of world’s forest area
Per capita availability of forest- 0.08ha (against the world’s avg.- 0.8ha)
Odisha Water Resources:
Total Geographical Area-15.57M ha
Rural Population-87%
Avg. Annual Rainfall-1489mm
No. of Rainy Days- 72days/year (66-70days)
Rainfall received cover an area of 23M ha with a layer of 1m depth
Contribution to GDP-28% (agri. sector)
Area Exploited under Agri.-40%
Irri. Area under Kharif-40%
Irri. Area under Rabi-32%
1489mm
(Annual Rainfall)
1185mm
(June-Sept)
194mm
(Oct-Feb)
121mm
(March-May)
Sectoral Use of Water:
Sectors Water Use in World(%) Developing Countries(%) Developed Countries(%) India(%)
AGRICULTURE 69 90 45 85
INDUSTRIES 23 5 45 7
DOMESTIC 8 5 10 8
Project Demand of Water:
Sectors 2000(%) 2010(%) 2025(%) 2050(%)
IRRIGATION 25.3 84.6 83.2 74
DOMESTIC 6.6 6.9 6.7 7
ENERGY 0.3 0.6 1.4 9
Water Related Issues:
4 out of 10 people- suffer water scarcity
1/3rd of world population now in water stressed countries
25%- doesn't have safe drinking water
40%- doesn’t have adequate water
50%- have water related diseases
80%- diseases due to water contamination
2.2Million people each year die (water contamination)
8 seconds- a child dies due to water related disease
Contd…
2025- 2/3rd world – water scarcity
2050- 7Billion population and 60 countries- water scarcity
Amount of water required/head is decreasing
 1700m3 or less- water stress
 1000m3 or less- water scarcity
 500m3 or less- absolute scarcity level
Declining per capita availability of water:
INDIA
YEAR WATER AVAILABILITY (m3/head)
1951 5177
1990 2500
2001 1820
2025 1341
2050 1144
ODISHA
YEAR WATER AVAILABILITY(m3/head)
2001 3359
2051 2218
INDIA’s position- 133 among the 180 nations in terms of water availability
INDIA’s position – 120 in 122 nations in terms of quality of water
Requirement- 50litres of water/day/head
Water Requirement of different Crops:
CROPS WATER REQUIREMENT (litres/kg of food)
INDIA WORLD
Rice 2850 2291
Wheat 1654 1334
Sorghum 900 800
Sugarcane 159 175
Potato 1100 1050
Soybean - 2750
Cotton 18694 8242
Vegetables 250 195
Chicken 7736 3340
Milk 1369 990
Meat - 15000
Discipline Values:
3 Rs- Reduce
Reuse
Recycle
Less resource intensive and more sustainable lifestyles
Have to be self discipline in management of water
Crop yield should not be sacrificed- water used judiciously
Minimise waste of food materials (minimises water wastage)
Sub-divisions of Water Resources:
SURFACE WATER RESOURCES:
Sources:
Rivers- largest river basin is the Ganga-Brahmaputra basin (GB Basin)
GB Basin- feeds 110M ha area
GB Basin- covers 43% of total catchment area of major rivers
Avg. annual potential of rivers- 1869.35BCM
1869.35BCM
690.32BCM
(Surface Water Resources)
432BCM
(Groundwater Resources)
Classification of Rivers:
Rivers(b/o Catchment Area-CA)
Major(>20000ha)
No. of Major rivers- 12
Medium(2000-20000ha)
No. of medium rivers- 46
Minor(<2000ha)
No. of minor rivers- 8
Desert(CA not necessary)
No. of desert rivers- 6
Rivers (b/o geography)
Perennial Rivers
(there is rainfall)
Seasonal
Rivers
Flossy Rivers
(originating from mountains, temporary period
& bring disasters)
Virgin Rivers
(Desert Rivers)
Other sources of surface water resources- canals, ponds, tanks, reservoirs,
lakes, ox-bow lakes etc.
Other sources accounts for- 7.4M ha
RIVERS CATCHMENT AREA(M ha)
Indus 32.1
Godaveri 31.3
Krishna 25.9
Mahanadi 14.2
GROUNDWATER(GW) RESOURCES:
Sources:
Precipitation covers 67% total GW resources
Rest 33%- from other sources
Storage Structures- Reservoirs
Seepage loss from canals
Seepage loss from Natural bodies(lakes, rivers, etc.)
Return flow from irrigation- percolation to deep percolation to recharge GW
Rainfall
S-W Monsoon
73%
Other Monsoon
Rest%
Dynamic GW Resource Assessment in India:
Monsoon Season Non-Monsoon Season
Recharge from Rainfall 251.9 BCM 36.34 BCM
Other Resources 66.49 BCM 77.13 BCM
 Total GW Potential in India= 431.86 BCM
 Total Natural Drainage= 39.16 BCM
 Extractable GW= 392.7 BCM
 GW Presently used for irrigation= 221.46 BCM
 GW Presently used for domestic use= 24.87 BCM
 GW Presently used for industrial use= 2.38 BCM
 Total GW Utilised= 248.7 BCM
 Total GW left= 173.25 BCM (for future use)
Stage of development of GW Resources:
(percentage of water utilize from the total GW Resources available)
Avg. National Utilization- 65.33%
STATES % of GW Utilized
Odisha 42
Delhi 119
Rajasthan 139.88
Haryana 136.91
Punjab 165.77 (over-exploitation)
Karnataka, Gujarat, Telangana, UP, HP >70 – 100
Other States <70
Irrigation Projects:
Large Water resources projects already completed- 5334
Large Water resources projects under construction- 411
Total Ultimate irrigation potential- 139.90Mha
Types of irrigation projects (b/o CCA):
1. Major Irrigation Projects- >10000ha
2. Medium Irrigation Projects- 2000-10000ha
3. Minor Irrigation Projects- <2000ha
Gross Command Area(GCA)- area commanded by any irri. Projects that includes buildings, etc.
Cultural Command Area(CCA)- only the land area commanded for irri. (subtract infastr.)
IRRIGATION PROJECTS ULTIMATE IRRI PROJECT
POTENTIAL (M ha)
IRRIGATION POTENTIAL
CREATED (M ha)
IRRIGATION POTENTIAL
UTILIZED (M ha)
Major and Medium 58.47 47.97 35.01
Minor Projects 81.43 65.56 52.91
Total 139.90 113.53 87.92
Irrigation Projects and its Potential of India:
Irrigation Projects and its Potential of Odisha:
IRRIGATION PROJECTS ULTIMATE IRRI PROJECT POTENTIAL (lakh ha) IRRIGATION POTENTIAL CREATED (lakh ha)
Kharif (June-Sept) Rabi (rest)
Major and Medium 36 9.64 7.04
Minor projects 52 11.66 8.69
Total 88 21.3 15.73
Total= 37.03 lakh ha
Systems of Irrigation:
Canal irrigation- direct diversion of canal from river by putting barrages &
directing the water. Types & its flow rate:
i) Major canal- 280.4 m3/s
ii) Minor canal- 4 – 8.5 m3/s
iii) Major Distributary- 0.75 – 5.5 m3/s
iv) Minor Distributary- <750 lps
>50% of the cultivated area is irrigated through Minor Distributary
Well irrigation- tanks, lift, ponds, etc.
Contd…
INDIA-
Net Sown Area- 140.8 M ha
Net Irrigated Area- 65.32 M ha
Gross Cropped Area- 195.25 M ha
Gross Irrigated Area- 96.5 M ha
Food grain cropped area- 124.5 M ha & irrigated area- 49.8%
Out of irrigated area, cereals occupy- 52.3%
Water Budgeting-
Total Water Potential of India-
400M ha m
Total Water Resource from
Rainfall- 392M ha m
Total Water Resource from
Snowfall- 8M ha m
Total Water Resource from Other
States- 20M ha m
Fig.-https://link.springer.com/article/10.1007/s10668-018-00307-y/figures/3
water resources.ppt

water resources.ppt

  • 2.
    Water Resources: Sources ofwater that are useful to human. Uses- agriculture, industry, household, recreational, environmental activities, etc. Water- renewable resource, yet the world’s supply of clean, freshwater is steadily decreasing.
  • 3.
    Global Water Resources: 3/4th of the earth’s surface is covered with water. Total amount of water on earth- 1400 Mkm3 (enough to cover the earth with a layer of 3m depth). Total amount of freshwater available- 2.7% Rest 97.5%- Salty water
  • 4.
    2.7% (Freshwater) 68.7% (Permanently frozen- Glaciers andsnow) 30.06% (Groundwater- is not extractable) 1.22% (Lakes, soil moisture, atmosphere, rivers, etc)
  • 5.
    Fig.- https://en.wikipedia.org/wiki/Water_resources#/media/File:Earth's_water_distribution.svg A graphicaldistribution of the locations of water on Earth Only 3% of the Earth's water is fresh water Most of it is in icecaps and glaciers (69%) and groundwater (30%) all lakes, rivers and swamps combined only account for a small fraction (0.3%)
  • 6.
    Unusable Water UsableWater Out of the Total Fresh Water Available: Usable Water (1%)- Rivers, lakes, flowing streams Unusable Water (99%)- Snow, Glaciers “There is enough water available but very less usable. Hence, we face Water Scarcity”.
  • 7.
    India Water Resources: AnnualPrecipitation- 1134mm Total Geographical Area- 328M ha Total Cultivated Area- 142.2M ha Area under Irrigation- 47.4M ha Area under Rainfed-98.5M ha India has- i) 18% of world’s geographical area ii) 15% of world’s livestock population iii) 2% of world’s geographical area iv) 0.5% of world’s pasture land v) 1% of world’s forest area Per capita availability of forest- 0.08ha (against the world’s avg.- 0.8ha)
  • 8.
    Odisha Water Resources: TotalGeographical Area-15.57M ha Rural Population-87% Avg. Annual Rainfall-1489mm No. of Rainy Days- 72days/year (66-70days) Rainfall received cover an area of 23M ha with a layer of 1m depth Contribution to GDP-28% (agri. sector) Area Exploited under Agri.-40% Irri. Area under Kharif-40% Irri. Area under Rabi-32% 1489mm (Annual Rainfall) 1185mm (June-Sept) 194mm (Oct-Feb) 121mm (March-May)
  • 9.
    Sectoral Use ofWater: Sectors Water Use in World(%) Developing Countries(%) Developed Countries(%) India(%) AGRICULTURE 69 90 45 85 INDUSTRIES 23 5 45 7 DOMESTIC 8 5 10 8 Project Demand of Water: Sectors 2000(%) 2010(%) 2025(%) 2050(%) IRRIGATION 25.3 84.6 83.2 74 DOMESTIC 6.6 6.9 6.7 7 ENERGY 0.3 0.6 1.4 9
  • 10.
    Water Related Issues: 4out of 10 people- suffer water scarcity 1/3rd of world population now in water stressed countries 25%- doesn't have safe drinking water 40%- doesn’t have adequate water 50%- have water related diseases 80%- diseases due to water contamination 2.2Million people each year die (water contamination) 8 seconds- a child dies due to water related disease
  • 11.
    Contd… 2025- 2/3rd world– water scarcity 2050- 7Billion population and 60 countries- water scarcity Amount of water required/head is decreasing  1700m3 or less- water stress  1000m3 or less- water scarcity  500m3 or less- absolute scarcity level
  • 12.
    Declining per capitaavailability of water: INDIA YEAR WATER AVAILABILITY (m3/head) 1951 5177 1990 2500 2001 1820 2025 1341 2050 1144 ODISHA YEAR WATER AVAILABILITY(m3/head) 2001 3359 2051 2218
  • 13.
    INDIA’s position- 133among the 180 nations in terms of water availability INDIA’s position – 120 in 122 nations in terms of quality of water Requirement- 50litres of water/day/head
  • 14.
    Water Requirement ofdifferent Crops: CROPS WATER REQUIREMENT (litres/kg of food) INDIA WORLD Rice 2850 2291 Wheat 1654 1334 Sorghum 900 800 Sugarcane 159 175 Potato 1100 1050 Soybean - 2750 Cotton 18694 8242 Vegetables 250 195 Chicken 7736 3340 Milk 1369 990 Meat - 15000
  • 15.
    Discipline Values: 3 Rs-Reduce Reuse Recycle Less resource intensive and more sustainable lifestyles Have to be self discipline in management of water Crop yield should not be sacrificed- water used judiciously Minimise waste of food materials (minimises water wastage)
  • 16.
    Sub-divisions of WaterResources: SURFACE WATER RESOURCES: Sources: Rivers- largest river basin is the Ganga-Brahmaputra basin (GB Basin) GB Basin- feeds 110M ha area GB Basin- covers 43% of total catchment area of major rivers Avg. annual potential of rivers- 1869.35BCM 1869.35BCM 690.32BCM (Surface Water Resources) 432BCM (Groundwater Resources)
  • 17.
    Classification of Rivers: Rivers(b/oCatchment Area-CA) Major(>20000ha) No. of Major rivers- 12 Medium(2000-20000ha) No. of medium rivers- 46 Minor(<2000ha) No. of minor rivers- 8 Desert(CA not necessary) No. of desert rivers- 6 Rivers (b/o geography) Perennial Rivers (there is rainfall) Seasonal Rivers Flossy Rivers (originating from mountains, temporary period & bring disasters) Virgin Rivers (Desert Rivers)
  • 18.
    Other sources ofsurface water resources- canals, ponds, tanks, reservoirs, lakes, ox-bow lakes etc. Other sources accounts for- 7.4M ha RIVERS CATCHMENT AREA(M ha) Indus 32.1 Godaveri 31.3 Krishna 25.9 Mahanadi 14.2
  • 19.
    GROUNDWATER(GW) RESOURCES: Sources: Precipitation covers67% total GW resources Rest 33%- from other sources Storage Structures- Reservoirs Seepage loss from canals Seepage loss from Natural bodies(lakes, rivers, etc.) Return flow from irrigation- percolation to deep percolation to recharge GW Rainfall S-W Monsoon 73% Other Monsoon Rest%
  • 20.
    Dynamic GW ResourceAssessment in India: Monsoon Season Non-Monsoon Season Recharge from Rainfall 251.9 BCM 36.34 BCM Other Resources 66.49 BCM 77.13 BCM  Total GW Potential in India= 431.86 BCM  Total Natural Drainage= 39.16 BCM  Extractable GW= 392.7 BCM  GW Presently used for irrigation= 221.46 BCM  GW Presently used for domestic use= 24.87 BCM  GW Presently used for industrial use= 2.38 BCM  Total GW Utilised= 248.7 BCM  Total GW left= 173.25 BCM (for future use)
  • 21.
    Stage of developmentof GW Resources: (percentage of water utilize from the total GW Resources available) Avg. National Utilization- 65.33% STATES % of GW Utilized Odisha 42 Delhi 119 Rajasthan 139.88 Haryana 136.91 Punjab 165.77 (over-exploitation) Karnataka, Gujarat, Telangana, UP, HP >70 – 100 Other States <70
  • 22.
    Irrigation Projects: Large Waterresources projects already completed- 5334 Large Water resources projects under construction- 411 Total Ultimate irrigation potential- 139.90Mha Types of irrigation projects (b/o CCA): 1. Major Irrigation Projects- >10000ha 2. Medium Irrigation Projects- 2000-10000ha 3. Minor Irrigation Projects- <2000ha Gross Command Area(GCA)- area commanded by any irri. Projects that includes buildings, etc. Cultural Command Area(CCA)- only the land area commanded for irri. (subtract infastr.)
  • 23.
    IRRIGATION PROJECTS ULTIMATEIRRI PROJECT POTENTIAL (M ha) IRRIGATION POTENTIAL CREATED (M ha) IRRIGATION POTENTIAL UTILIZED (M ha) Major and Medium 58.47 47.97 35.01 Minor Projects 81.43 65.56 52.91 Total 139.90 113.53 87.92 Irrigation Projects and its Potential of India: Irrigation Projects and its Potential of Odisha: IRRIGATION PROJECTS ULTIMATE IRRI PROJECT POTENTIAL (lakh ha) IRRIGATION POTENTIAL CREATED (lakh ha) Kharif (June-Sept) Rabi (rest) Major and Medium 36 9.64 7.04 Minor projects 52 11.66 8.69 Total 88 21.3 15.73 Total= 37.03 lakh ha
  • 24.
    Systems of Irrigation: Canalirrigation- direct diversion of canal from river by putting barrages & directing the water. Types & its flow rate: i) Major canal- 280.4 m3/s ii) Minor canal- 4 – 8.5 m3/s iii) Major Distributary- 0.75 – 5.5 m3/s iv) Minor Distributary- <750 lps >50% of the cultivated area is irrigated through Minor Distributary Well irrigation- tanks, lift, ponds, etc.
  • 25.
    Contd… INDIA- Net Sown Area-140.8 M ha Net Irrigated Area- 65.32 M ha Gross Cropped Area- 195.25 M ha Gross Irrigated Area- 96.5 M ha Food grain cropped area- 124.5 M ha & irrigated area- 49.8% Out of irrigated area, cereals occupy- 52.3%
  • 26.
    Water Budgeting- Total WaterPotential of India- 400M ha m Total Water Resource from Rainfall- 392M ha m Total Water Resource from Snowfall- 8M ha m Total Water Resource from Other States- 20M ha m Fig.-https://link.springer.com/article/10.1007/s10668-018-00307-y/figures/3