Downloaded 198 times
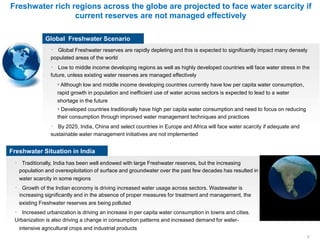
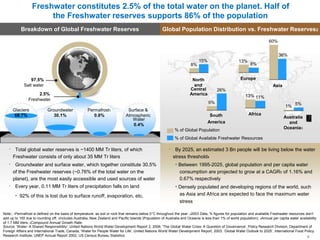
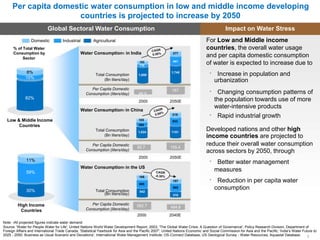
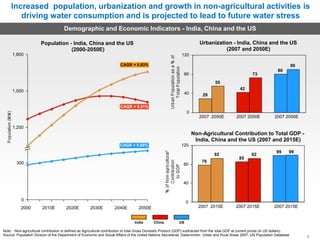
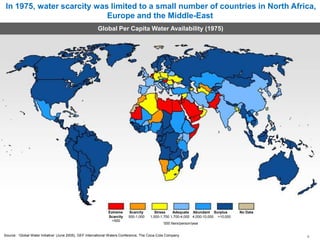
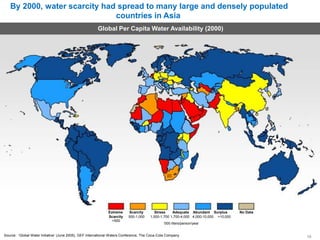
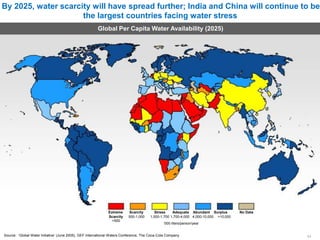
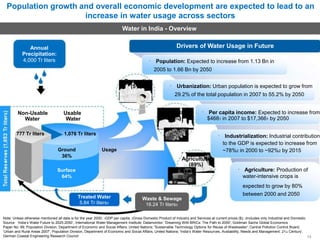
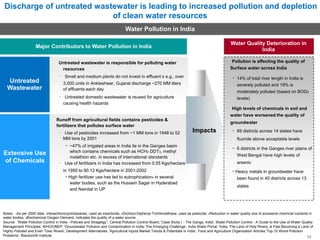


The document discusses global and India's freshwater situation. Globally, freshwater reserves are depleting rapidly due to population growth, inefficient use, and climate change. By 2025, many countries including India, China, and parts of Europe and Africa will face water scarcity. In India, traditional water reserves are under strain from increasing population, urbanization, and economic development. Improved national water management strategies are needed to integrate regional initiatives and ensure long-term sustainable water usage across sectors.


