Geometric modeling: Wire frame, surface and solid modeling - Engineering analysis;
design review and evaluation, automated drafting.
Numerical control: Need - advantages and disadvantages – classifications – Point to
point, straight cut and contouring positioning - incremental and absolute systems – open
loop and closed loop systems – DDA integrator and Interpolators – resolution – CNC and
DNC.
Programmable Logic Controllers (PLC): need – relays - logic ladder program –
timers, simple problems only - Devices in N.C. systems: Driving devices - feed
back devices: encoders, moire fringes, digitizer, resolver, inductosyn, and
tachometer.
AN EXPERIMENTAL STUDY ON THE AUTOMOTIVE PRODUCTION LINE USING ASSEMBLY LINE B...IAEME Publication
The main aim of an assembly line is to group the different facilities and workers inan efficient manner in order to obtain effective utilization of man power and machine.This calls for uniform rate of production as well as decrease in the work in process
inventory. Hence, this paper attempts to achieve these in an assembly line of anautomotive manufacturing unit using three different techniques such as Largestcandidate rule (LCR), Kilbridge and wester column method (KWC) and Rank
positional weighted method (RPW). All the three methods show better efficiency and acomparison is also drawn amongst the three to determine the best suited techniquepertaining to the current research work
DESIGN AND CONTROL OF ATC FOR SHORTER TIME INTERVAL IN CNC MACHINESIAEME Publication
This project focuses on the design and control of Automatic Tool Change (ATC)system in CNC machineries to reduce the time interval during tool change process.
Here three methods are used in this project, whereas the first method is the set of
mathematical logics is used to find the shortest distance in Tool magazine during toolchange.The second method is the use of Rotary encoder in the Magazine motor, In the
present system the digital input (count sensor) is used to count the pocket movement in
the magazine using Cam movement(Fixed position) from one pocket to another pocket,but the time interval between pocket to pocket is more. Hence to reduce this time,rotary encoder is being used to read each pocket positions through high pulse input.The third method is the creating and interfacing the Tool change database in Auto mode during machining, the detailed analysis of these three methods is shown below.
Computer – Aided process planning (CAPP),What is process planning ,Difficulties in traditional process planning, approaches to CAPP ,Machinability data systems, Database systems, Benefits of CAPP.
FLUID FLOW ANALYSIS OF CENTRIFUGAL FAN BY USING FEMIAEME Publication
The forward backward curved (mixed) Centrifugal fan 630 has been analyzed aerodynamically for compare experimental results with simulation results by using ANSYS FLUENT (Finite Element Analysis Software). The material of the fan impeller was specified as ALUMINIUM. Boundary conditions on the Centrifugal fan-630 are taken from the reference. The flow distribution across the fan is obtained. The maximum static pressure at the inlet is known and the pressure distributions across the blade are obtained accordingly. The obtained results are compared with Experimental results is discussed. In final recommended the design of the centrifugal fan and results are tabulated. It’s observed that simulation results are nearer to the experimental results.
Efficiency of bond graph and external model integration for alarm processing ...IJAAS Team
The design of a supervision system based on the external model by structuring the industrial process according to several modes of operation (degraded and normal). The disadvantage of this model is that it describes the industrial process components as functions regardless of their dynamics without going into detail. Hence the interest of the bond graph model to fill the external model limits. The performance of the proposed supervisory system using both models lies in the detection and location of faults for each mode of operation. The bond graph model enriched by the concept of causality and thanks to these structural properties can clearly display the elements of the physical system taking into account their dynamics in normal and abnormal operation. The results of our research have been applied to central air conditioning system; the development of the proposed project has proceeded from the modeling stage to the reconfiguration stage of the system.
Balancing the line by using heuristic method based on cpm in salbp –a case studyeSAT Journals
Abstract
In mass production systems, line balancing plays a great role, but this is not easy even if it is a simple straight line. So, in order to
solve these problems Heuristic methods are very much desirable. It is also found that Heuristic methods play a great role in the
formation of metaheuristic methods.Therefore it is very much important to use more efficient heuristic methods. In this research
paper we presents a heuristic method that is based on critical path method for simple assembly line balancing. This research is
mainly concerned with objectives of minimizing the number of workstations, improvement of smoothness index, mean absolute
deviation (MAD) and increasing line efficiency.
Keywords-Heuristic methods,Assembly line balancing problem, Critical path method, Simple assembly line balancing.
Poor layout design is determined as a major problem
in small and medium industry. These particular problems thus
affect the productivity and the line efficiency as well. In
automotive industries, assembly line is the major area to be
taken into consideration for increasing productivity. The focus
of this paper is to identify the bottleneck workstations in the
current layout and eliminate those activities that are taking time
on that workstations. The time study is done by using camera.
The current layout is redesigned by computing takt time and
processing times in each workstations. The case study shows how
the takt time calculation is done and from this takt time the
processing time is decided for all workstations. The time
consuming activities are reduced and thus the processing times
at all workstations is made possibly equal. The time reduction
increases productivity in the form of increased number of units
of production in the same previous time.
Line efficiency is also found to be improved which is described
with the terms Overall Line Efficiency (OLE) and First Pass
Yield (First Time Through) units.
Linking design and manufacturing on a PLM platformiosrjce
IOSR Journal of Mechanical and Civil Engineering (IOSR-JMCE) is a double blind peer reviewed International Journal that provides rapid publication (within a month) of articles in all areas of mechanical and civil engineering and its applications. The journal welcomes publications of high quality papers on theoretical developments and practical applications in mechanical and civil engineering. Original research papers, state-of-the-art reviews, and high quality technical notes are invited for publications.
The team of ten members was tasked with designing a plant to manufacture and assemble hair dryers for use in regional peripheral warehouses, shopping malls, and shops. A well-equipped assembly area, a raw materials warehouse (RMW), a finished product warehouse (FPW), a semi-finished storage area, and service areas have all been available at the plant. Geometric and volumetric sizing, lines and/or cells and/or work departments, shelving, reception areas, shipping areas, picking areas, packaging areas, and finished product containment buildings were all the responsibility of each project team.
Electrically small antennas: The art of miniaturizationEditor IJARCET
We are living in the technological era, were we preferred to have the portable devices rather than unmovable devices. We are isolating our self rom the wires and we are becoming the habitual of wireless world what makes the device portable? I guess physical dimensions (mechanical) of that particular device, but along with this the electrical dimension is of the device is also of great importance. Reducing the physical dimension of the antenna would result in the small antenna but not electrically small antenna. We have different definition for the electrically small antenna but the one which is most appropriate is, where k is the wave number and is equal to and a is the radius of the imaginary sphere circumscribing the maximum dimension of the antenna. As the present day electronic devices progress to diminish in size, technocrats have become increasingly concentrated on electrically small antenna (ESA) designs to reduce the size of the antenna in the overall electronics system. Researchers in many fields, including RF and Microwave, biomedical technology and national intelligence, can benefit from electrically small antennas as long as the performance of the designed ESA meets the system requirement.
Remote sensing and monitoring are changing the mining industry for the better. These are providing innovative solutions to long-standing challenges. Those related to exploration, extraction, and overall environmental management by mining technology companies Odisha. These technologies make use of satellite imaging, aerial photography and sensors to collect data that might be inaccessible or from hazardous locations. With the use of this technology, mining operations are becoming increasingly efficient. Let us gain more insight into the key aspects associated with remote sensing and monitoring when it comes to mining.
Putting the SPARK into Virtual Training.pptxCynthia Clay
This 60-minute webinar, sponsored by Adobe, was delivered for the Training Mag Network. It explored the five elements of SPARK: Storytelling, Purpose, Action, Relationships, and Kudos. Knowing how to tell a well-structured story is key to building long-term memory. Stating a clear purpose that doesn't take away from the discovery learning process is critical. Ensuring that people move from theory to practical application is imperative. Creating strong social learning is the key to commitment and engagement. Validating and affirming participants' comments is the way to create a positive learning environment.
Attending a job Interview for B1 and B2 Englsih learnersErika906060
It is a sample of an interview for a business english class for pre-intermediate and intermediate english students with emphasis on the speking ability.
Skye Residences | Extended Stay Residences Near Toronto Airportmarketingjdass
Experience unparalleled EXTENDED STAY and comfort at Skye Residences located just minutes from Toronto Airport. Discover sophisticated accommodations tailored for discerning travelers.
Website Link :
https://skyeresidences.com/
https://skyeresidences.com/about-us/
https://skyeresidences.com/gallery/
https://skyeresidences.com/rooms/
https://skyeresidences.com/near-by-attractions/
https://skyeresidences.com/commute/
https://skyeresidences.com/contact/
https://skyeresidences.com/queen-suite-with-sofa-bed/
https://skyeresidences.com/queen-suite-with-sofa-bed-and-balcony/
https://skyeresidences.com/queen-suite-with-sofa-bed-accessible/
https://skyeresidences.com/2-bedroom-deluxe-queen-suite-with-sofa-bed/
https://skyeresidences.com/2-bedroom-deluxe-king-queen-suite-with-sofa-bed/
https://skyeresidences.com/2-bedroom-deluxe-queen-suite-with-sofa-bed-accessible/
#Skye Residences Etobicoke, #Skye Residences Near Toronto Airport, #Skye Residences Toronto, #Skye Hotel Toronto, #Skye Hotel Near Toronto Airport, #Hotel Near Toronto Airport, #Near Toronto Airport Accommodation, #Suites Near Toronto Airport, #Etobicoke Suites Near Airport, #Hotel Near Toronto Pearson International Airport, #Toronto Airport Suite Rentals, #Pearson Airport Hotel Suites
Memorandum Of Association Constitution of Company.pptseri bangash
www.seribangash.com
A Memorandum of Association (MOA) is a legal document that outlines the fundamental principles and objectives upon which a company operates. It serves as the company's charter or constitution and defines the scope of its activities. Here's a detailed note on the MOA:
Contents of Memorandum of Association:
Name Clause: This clause states the name of the company, which should end with words like "Limited" or "Ltd." for a public limited company and "Private Limited" or "Pvt. Ltd." for a private limited company.
https://seribangash.com/article-of-association-is-legal-doc-of-company/
Registered Office Clause: It specifies the location where the company's registered office is situated. This office is where all official communications and notices are sent.
Objective Clause: This clause delineates the main objectives for which the company is formed. It's important to define these objectives clearly, as the company cannot undertake activities beyond those mentioned in this clause.
www.seribangash.com
Liability Clause: It outlines the extent of liability of the company's members. In the case of companies limited by shares, the liability of members is limited to the amount unpaid on their shares. For companies limited by guarantee, members' liability is limited to the amount they undertake to contribute if the company is wound up.
https://seribangash.com/promotors-is-person-conceived-formation-company/
Capital Clause: This clause specifies the authorized capital of the company, i.e., the maximum amount of share capital the company is authorized to issue. It also mentions the division of this capital into shares and their respective nominal value.
Association Clause: It simply states that the subscribers wish to form a company and agree to become members of it, in accordance with the terms of the MOA.
Importance of Memorandum of Association:
Legal Requirement: The MOA is a legal requirement for the formation of a company. It must be filed with the Registrar of Companies during the incorporation process.
Constitutional Document: It serves as the company's constitutional document, defining its scope, powers, and limitations.
Protection of Members: It protects the interests of the company's members by clearly defining the objectives and limiting their liability.
External Communication: It provides clarity to external parties, such as investors, creditors, and regulatory authorities, regarding the company's objectives and powers.
https://seribangash.com/difference-public-and-private-company-law/
Binding Authority: The company and its members are bound by the provisions of the MOA. Any action taken beyond its scope may be considered ultra vires (beyond the powers) of the company and therefore void.
Amendment of MOA:
While the MOA lays down the company's fundamental principles, it is not entirely immutable. It can be amended, but only under specific circumstances and in compliance with legal procedures. Amendments typically require shareholder
Premium MEAN Stack Development Solutions for Modern BusinessesSynapseIndia
Stay ahead of the curve with our premium MEAN Stack Development Solutions. Our expert developers utilize MongoDB, Express.js, AngularJS, and Node.js to create modern and responsive web applications. Trust us for cutting-edge solutions that drive your business growth and success.
Know more: https://www.synapseindia.com/technology/mean-stack-development-company.html
[Note: This is a partial preview. To download this presentation, visit:
https://www.oeconsulting.com.sg/training-presentations]
Sustainability has become an increasingly critical topic as the world recognizes the need to protect our planet and its resources for future generations. Sustainability means meeting our current needs without compromising the ability of future generations to meet theirs. It involves long-term planning and consideration of the consequences of our actions. The goal is to create strategies that ensure the long-term viability of People, Planet, and Profit.
Leading companies such as Nike, Toyota, and Siemens are prioritizing sustainable innovation in their business models, setting an example for others to follow. In this Sustainability training presentation, you will learn key concepts, principles, and practices of sustainability applicable across industries. This training aims to create awareness and educate employees, senior executives, consultants, and other key stakeholders, including investors, policymakers, and supply chain partners, on the importance and implementation of sustainability.
LEARNING OBJECTIVES
1. Develop a comprehensive understanding of the fundamental principles and concepts that form the foundation of sustainability within corporate environments.
2. Explore the sustainability implementation model, focusing on effective measures and reporting strategies to track and communicate sustainability efforts.
3. Identify and define best practices and critical success factors essential for achieving sustainability goals within organizations.
CONTENTS
1. Introduction and Key Concepts of Sustainability
2. Principles and Practices of Sustainability
3. Measures and Reporting in Sustainability
4. Sustainability Implementation & Best Practices
To download the complete presentation, visit: https://www.oeconsulting.com.sg/training-presentations
3.0 Project 2_ Developing My Brand Identity Kit.pptxtanyjahb
A personal brand exploration presentation summarizes an individual's unique qualities and goals, covering strengths, values, passions, and target audience. It helps individuals understand what makes them stand out, their desired image, and how they aim to achieve it.
The world of search engine optimization (SEO) is buzzing with discussions after Google confirmed that around 2,500 leaked internal documents related to its Search feature are indeed authentic. The revelation has sparked significant concerns within the SEO community. The leaked documents were initially reported by SEO experts Rand Fishkin and Mike King, igniting widespread analysis and discourse. For More Info:- https://news.arihantwebtech.com/search-disrupted-googles-leaked-documents-rock-the-seo-world/
Accpac to QuickBooks Conversion Navigating the Transition with Online Account...PaulBryant58
This article provides a comprehensive guide on how to
effectively manage the convert Accpac to QuickBooks , with a particular focus on utilizing online accounting services to streamline the process.
Improving profitability for small businessBen Wann
In this comprehensive presentation, we will explore strategies and practical tips for enhancing profitability in small businesses. Tailored to meet the unique challenges faced by small enterprises, this session covers various aspects that directly impact the bottom line. Attendees will learn how to optimize operational efficiency, manage expenses, and increase revenue through innovative marketing and customer engagement techniques.
Enterprise Excellence is Inclusive Excellence.pdfKaiNexus
Enterprise excellence and inclusive excellence are closely linked, and real-world challenges have shown that both are essential to the success of any organization. To achieve enterprise excellence, organizations must focus on improving their operations and processes while creating an inclusive environment that engages everyone. In this interactive session, the facilitator will highlight commonly established business practices and how they limit our ability to engage everyone every day. More importantly, though, participants will likely gain increased awareness of what we can do differently to maximize enterprise excellence through deliberate inclusion.
What is Enterprise Excellence?
Enterprise Excellence is a holistic approach that's aimed at achieving world-class performance across all aspects of the organization.
What might I learn?
A way to engage all in creating Inclusive Excellence. Lessons from the US military and their parallels to the story of Harry Potter. How belt systems and CI teams can destroy inclusive practices. How leadership language invites people to the party. There are three things leaders can do to engage everyone every day: maximizing psychological safety to create environments where folks learn, contribute, and challenge the status quo.
Who might benefit? Anyone and everyone leading folks from the shop floor to top floor.
Dr. William Harvey is a seasoned Operations Leader with extensive experience in chemical processing, manufacturing, and operations management. At Michelman, he currently oversees multiple sites, leading teams in strategic planning and coaching/practicing continuous improvement. William is set to start his eighth year of teaching at the University of Cincinnati where he teaches marketing, finance, and management. William holds various certifications in change management, quality, leadership, operational excellence, team building, and DiSC, among others.
1. ISSN: 2278 – 1323
International Journal of Advanced Research in Computer Engineering & Technology (IJARCET)
Volume 2, Issue 6, June 2013
www.ijarcet.org 2177
Integrating Assembly Lines based on Lean Line Design
Concept
Ms. Surekha. S1
, Dr. R. V Praveena Gowda2
, Mr. Manoj Kulkarni3
Abstract
In today‟s competitive business scenario
manufacturing industries are under the
pressure to reduce cost and cycle time. It is a
lean manufacturing concept with a systematic
approach to identify and eliminate waste
through continuous and sustained
improvements by manufacturing the product
at the pull of the customer in pursuit of
perfection. This paper is to Design and
Integrate Assembly Lines „A‟ and „B‟ based
on „Lean Concept‟ using MTM/UAS analysis
for determine the time and to identify the
improvement. The study was carried out in 2
assembly lines in a reputed manufacturing
industry. The paper concentrates only on
assembly line and where assembly line „B‟ is
to be accommodated into assembly line „A‟.
The main focus of the paper is to study the
existing system and designing the new
solution based on Lean Line Design concept
which would follow the standards of the
manufacturing industry
Keywords: Integration, manual work system, line
balancing, manual time.
Abbreviations:
LLD- Lean line design
CTT– Customer takt time
OEE- Overall equipment effectiveness
PC/T- Planned cycle time
OBC- Operator balance chart
SW- Standardized work
CIP- Continuous improvement process
I. Introduction
The aim of the paper to integrate 2 assembly
lines by reducing space and operator which
results in effectively utilization of space and
the manpower. Different tools like takt time,
line balancing, and MTM/UAS analysis are
used to achieve the purpose. The integration
of the 2 lines is based on the LLD technique.
[4] The expected benefit is to effectively
utilize the space and manpower by 50% and
30%.
A. Method time measurement (MTM) and
universal analysis system (UAS) - is a
“Predetermined Time Systems” used
primarily in industrial settings to analyze
the methods used to perform any manual
operations or task & as a product of that
analysis, let the standard time in which a
worker should complete the task.
B. Lean Line Design- Lean Line Design is a
method for implementing manufacturing
industries principles like process
orientation, perfect quality,
standardization, flexibility, waste
elimination, transparent process, associate
involvement etc. LLD technique is as
shown in fig 1 while planning the new
design of manual and semi-automated
work systems this LLD technique is
required to result in the better line. The
qualitative aim is to redesign production
and logistics according to manufacturing
industries criteria. The quantitative aim is
to increase productivity and flexibility, as
well as lowering the investment ratio,
space requirements and through-put times.
Fig 1: LLD Technique
C. Approaches to LLD- Designing the lean
line means to rearrange the stations in the
existing line which would be meeting the
manufacturing industries standards. [3]
LLD which is used for rearranging is a
step by step approach, the approaches flow
is shown in fig 2.
Fig 2: Flow chart of LLD approaches
2. ISSN: 2278 – 1323
International Journal of Advanced Research in Computer Engineering & Technology (IJARCET)
Volume 2, Issue 6, June 2013
www.ijarcet.org 2178
II. Problem Statement
In recent days „A‟ elements has encountered
with a fluctuation in demand i.e., from high
demand to moderate demand, and there is a
moderate demand for „B‟ elements, therefore
there is no effective utilization of the line and
the man power in both the Pumps.
III. Initial Calculation
A. Customer Takt Time (CTT) - It is the rate
at which products or parts must be
produced to fulfill customer orders.
Equation to calculate CTT is as below in
e.q. 1.
E.q. 1: CTT
B. Planned Cycle Time (PC/T) - It is the
Customer Takt Time taking into accounts
C. all influencing parameters and losses
(included in OEE) at maximum capacity
of the line. Equation to calculate CTT is
as below in e.q. 2.
E.q. 2: PC/T
Note: Planned cycle time need to be at least
10% less than CTT, so that the product
could be delivered on time
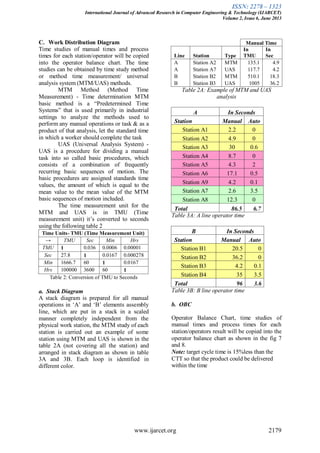
The CTT and the PC/T for the A and
B line is calculated as shown in the table 1.
Which shows us how the CTT and PC/T for
A and B line is done.
Planned Operating
Time / day
Volume
A
Working
days B
Demand per
day = A/B
CTT PC/T
A
25200 seconds 9812
units
24 days 409 units 62
Seconds
52
Seconds
B
25200 seconds 840
units
24 days 35 units 720
Seconds
612
Seconds
Table 1: CTT and PC/T calculation for A and B line
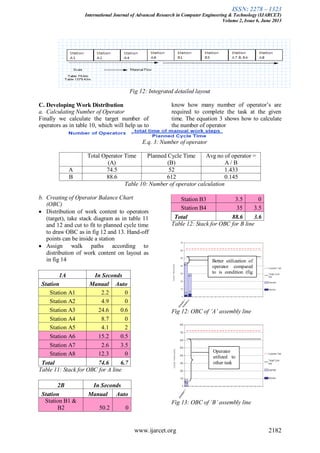
IV. Asses Current Condition
A. Current Layout
Current layout of „A‟ and „B‟ elements can be
referred to the fig 3 and 4 shows the current
layout, where B line need to be
accommodated into A line
Fig 3: Existing layout of ‘A’ assembly line
Fig 4: Existing layout of ‘B’ assembly line
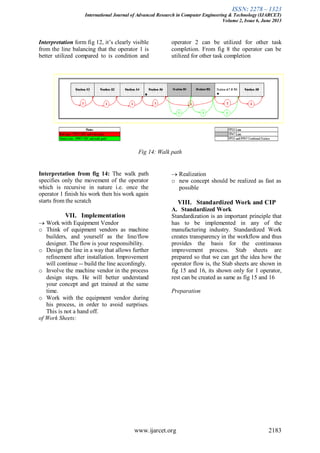
B. Process Flow
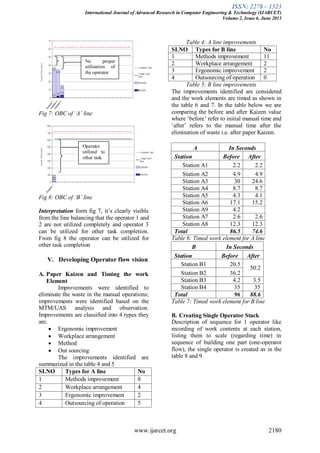
Process flow would help us to know the flow
carried out in the assembly line. [1] The
below fig 5 and fig 6 shows us the process
flow currently carried out in „A‟ and „B‟ lines
respectively.
3. ISSN: 2278 – 1323
International Journal of Advanced Research in Computer Engineering & Technology (IJARCET)
Volume 2, Issue 6, June 2013
www.ijarcet.org 2179
C. Work Distribution Diagram
Time studies of manual times and process
times for each station/operator will be copied
into the operator balance chart. The time
studies can be obtained by time study method
or method time measurement/ universal
analysis system (MTM/UAS) methods.
MTM Method (Method Time
Measurement) - Time determination MTM
basic method is a “Predetermined Time
Systems” that is used primarily in industrial
settings to analyze the methods used to
perform any manual operations or task & as a
product of that analysis, let the standard time
in which a worker should complete the task
UAS (Universal Analysis System) -
UAS is a procedure for dividing a manual
task into so called basic procedures, which
consists of a combination of frequently
recurring basic sequences of motion. The
basic procedures are assigned standards time
values, the amount of which is equal to the
mean value to the mean value of the MTM
basic sequences of motion included.
The time measurement unit for the
MTM and UAS is in TMU (Time
measurement unit) it‟s converted to seconds
using the following table 2
Time Units- TMU (Time Measurement Unit)
→ TMU Sec Min Hrs
TMU 1 0.036 0.0006 0.00001
Sec 27.8 1 0.0167 0.000278
Min 1666.7 60 1 0.0167
Hrs 100000 3600 60 1
Table 2: Conversion of TMU to Seconds
a. Stack Diagram
A stack diagram is prepared for all manual
operations in „A‟ and „B‟ elements assembly
line, which are put in a stack in a scaled
manner completely independent from the
physical work station, the MTM study of each
station is carried out an example of some
station using MTM and UAS is shown in the
table 2A (not covering all the station) and
arranged in stack diagram as shown in table
3A and 3B. Each loop is identified in
different color.
Manual Time
Line Station Type
In
TMU
In
Sec
A Station A2 MTM 135.1 4.9
A Station A7 UAS 117.7 4.2
B Station B2 MTM 510.1 18.3
B Station B3 UAS 1005 36.2
Table 2A: Example of MTM and UAS
analysis
A In Seconds
Station Manual Auto
Station A1 2.2 0
Station A2 4.9 0
Station A3 30 0.6
Station A4 8.7 0
Station A5 4.3 2
Station A6 17.1 0.5
Station A9 4.2 0.1
Station A7 2.6 3.5
Station A8 12.3 0
Total 86.5 6.7
Table 3A: A line operator time
B In Seconds
Station Manual Auto
Station B1 20.5 0
Station B2 36.2 0
Station B3 4.2 0.1
Station B4 35 3.5
Total 96 3.6
Table 3B: B line operator time
b. OBC
Operator Balance Chart, time studies of
manual times and process times for each
station/operators result will be copied into the
operator balance chart as shown in the fig 7
and 8.
Note: target cycle time is 15%less than the
CTT so that the product could be delivered
within the time
4. ISSN: 2278 – 1323
International Journal of Advanced Research in Computer Engineering & Technology (IJARCET)
Volume 2, Issue 6, June 2013
www.ijarcet.org 2180
Fig 7: OBC of ‘A’ line
Fig 8: OBC of ‘B’ line
Interpretation form fig 7, it‟s clearly visible
from the line balancing that the operator 1 and
2 are not utilized completely and operator 3
can be utilized for other task completion.
From fig 8 the operator can be utilized for
other task completion
V. Developing Operator flow vision
A. Paper Kaizen and Timing the work
Element
Improvements were identified to
eliminate the waste in the manual operations;
improvements were identified based on the
MTM/UAS analysis and observation.
Improvements are classified into 4 types they
are.
Ergonomic improvement
Workplace arrangement
Method
Out sourcing
The improvements identified are
summarized in the table 4 and 5
SLNO Types for A line No
1 Methods improvement 8
2 Workplace arrangement 4
3 Ergonomic improvement 2
4 Outsourcing of operation 5
Table 4: A line improvements
SLNO Types for B line No
1 Methods improvement 11
2 Workplace arrangement 2
3 Ergonomic improvement 2
4 Outsourcing of operation 0
Table 5: B line improvements
The improvements identified are considered
and the work elements are timed as shown in
the table 6 and 7. In the table below we are
comparing the before and after Kaizen value
where „before‟ refer to initial manual time and
„after‟ refers to the manual time after the
elimination of waste i.e. after paper Kaizen.
A In Seconds
Station Before After
Station A1 2.2 2.2
Station A2 4.9 4.9
Station A3 30 24.6
Station A4 8.7 8.7
Station A5 4.3 4.1
Station A6 17.1 15.2
Station A9 4.2
Station A7 2.6 2.6
Station A8 12.3 12.3
Total 86.5 74.6
Table 6: Timed work element for A line
B In Seconds
Station Before After
Station B1 20.5
50.2
Station B2 36.2
Station B3 4.2 3.5
Station B4 35 35
Total 96 88.6
Table 7: Timed work element for B line
B. Creating Single Operator Stack
Description of sequence for 1 operator like
recording of work contents at each station,
listing them to scale (regarding time) in
sequence of building one part (one-operator
flow), the single operator is created as in the
table 8 and 9.
No proper
utilization of
the operator
Operator
utilized to
other task
5. ISSN: 2278 – 1323
International Journal of Advanced Research in Computer Engineering & Technology (IJARCET)
Volume 2, Issue 6, June 2013
www.ijarcet.org 2181
1A In Seconds
Station Manual Auto
Station A1 2.2 0
Station A2 4.9 0
Station A3 24.6 0.6
Station A4 8.7 0
Station A5 4.1 2
Station A6 15.2 0.5
Station A7 2.6 3.5
Station A8 12.3 0
Total 74.6 6.7
Table 8: Single operator stack for A line
2B In Seconds
Station Manual Auto
Station B1 &
B2 50.2 0
Station B3 3.5 0
Station B4 35 3.5
Total 88.6 3.6
Table 9: Single operator stack for B line
VI. Line Design
A. Rough Line Concept
Rough line concepts helps us to plan and
design the new line according to the
manufacturing industries principles, we
would be following 4 steps to draw the new
line,
a. Step 1: Start with a simple, straight-line
sketch of workstations
Design the line so the operator can flow as
intended not necessarily to scale yet
Design the line independent of the number
of operators, as shown in fig 9.
Fig 9: Rough Line step 1
b. Step 2: Write the operator cycle times above each station as shown in fig 10
Fig 10: Rough Line step 2
c. Step 3: list the parts needed under each station as shown in fig 11
d. Step 4: list cycle time of automatic process underneath the station as shown in fig 11
Fig 11: Rough Line step 3 & 4
B. Detailing and Finalizing the Layout
With knowledge of operator flow, rough line layout and supply of components we can detail the
layout and draw to scale
6. ISSN: 2278 – 1323
International Journal of Advanced Research in Computer Engineering & Technology (IJARCET)
Volume 2, Issue 6, June 2013
www.ijarcet.org 2182
Fig 12: Integrated detailed layout
C. Developing Work Distribution
a. Calculating Number of Operator
Finally we calculate the target number of
operators as in table 10, which will help us to
know how many number of operator‟s are
required to complete the task at the given
time. The equation 3 shows how to calculate
the number of operator
E.q. 3: Number of operator
Total Operator Time
(A)
Planned Cycle Time
(B)
Avg no of operator =
A / B
A 74.5 52 1.433
B 88.6 612 0.145
Table 10: Number of operator calculation
b. Creating of Operator Balance Chart
(OBC)
Distribution of work content to operators
(target), take stack diagram as in table 11
and 12 and cut to fit to planned cycle time
to draw OBC as in fig 12 and 13. Hand-off
points can be inside a station
Assign walk paths according to
distribution of work content on layout as
in fig 14
1A In Seconds
Station Manual Auto
Station A1 2.2 0
Station A2 4.9 0
Station A3 24.6 0.6
Station A4 8.7 0
Station A5 4.1 2
Station A6 15.2 0.5
Station A7 2.6 3.5
Station A8 12.3 0
Total 74.6 6.7
Table 11: Stack for OBC for A line
2B In Seconds
Station Manual Auto
Station B1 &
B2 50.2 0
Station B3 3.5 0
Station B4 35 3.5
Total 88.6 3.6
Table 12: Stack for OBC for B line
Fig 12: OBC of ‘A’ assembly line
Fig 13: OBC of ‘B’ assembly line
Operator
utilized to
other task
Better utilization of
operator compared
to is condition (fig
7)
7. ISSN: 2278 – 1323
International Journal of Advanced Research in Computer Engineering & Technology (IJARCET)
Volume 2, Issue 6, June 2013
www.ijarcet.org 2183
Interpretation form fig 12, it‟s clearly visible
from the line balancing that the operator 1 is
better utilized compared to is condition and
operator 2 can be utilized for other task
completion. From fig 8 the operator can be
utilized for other task completion
Fig 14: Walk path
Interpretation from fig 14: The walk path
specifies only the movement of the operator
which is recursive in nature i.e. once the
operator 1 finish his work then his work again
starts from the scratch
VII. Implementation
Work with Equipment Vendor
o Think of equipment vendors as machine
builders, and yourself as the line/flow
designer. The flow is your responsibility.
o Design the line in a way that allows further
refinement after installation. Improvement
will continue -- build the line accordingly.
o Involve the machine vendor in the process
design steps. He will better understand
your concept and get trained at the same
time.
o Work with the equipment vendor during
his process, in order to avoid surprises.
This is not a hand off.
Realization
o new concept should be realized as fast as
possible
VIII. Standardized Work and CIP
A. Standardized Work
Standardization is an important principle that
has to be implemented in any of the
manufacturing industry. Standardized Work
creates transparency in the workflow and thus
provides the basis for the continuous
improvement process. Stab sheets are
prepared so that we can get the idea how the
operator flow is, the Stab sheets are shown in
fig 15 and 16, its shown only for 1 operator,
rest can be created as same as fig 15 and 16
Preparation
of Work Sheets:
8. ISSN: 2278 – 1323
International Journal of Advanced Research in Computer Engineering & Technology (IJARCET)
Volume 2, Issue 6, June 2013
www.ijarcet.org 2184
Fig 15: Data input for worksheet
Fig 16: STAB
B. Point CIP
Continuous improvement process (CIP),
description of the work sequence according to
the current standard need to be implemented
which can be carried out by informing and
training of the employees of the line based on
the operator time. Fig 17 shows us the
implementation of the point-CIP.
Fig 17: Point CIP
9. ISSN: 2278 – 1323
International Journal of Advanced Research in Computer Engineering & Technology (IJARCET)
Volume 2, Issue 6, June 2013
www.ijarcet.org 2185
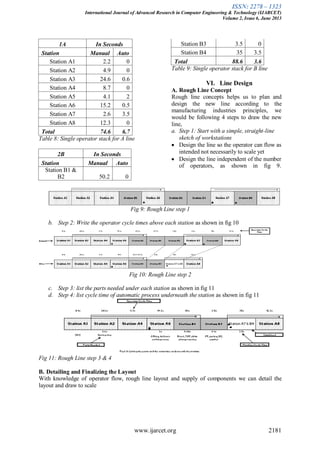
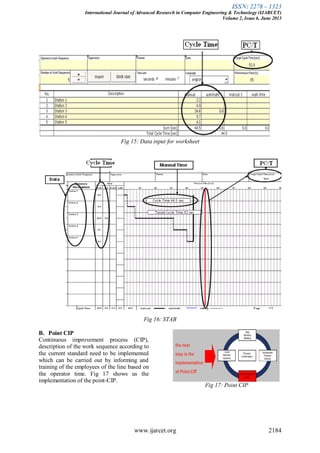
IX. Results
The results of integrating the 2 lines A and B
are as shown in the table 13
SL
No
Action
Existi
ng
Integrat
ed
1
Area in sq
meters
A 618
B 311.4
Total 929.4 481.2
2
Material
Movement
in meters
A 938
B 360
Total 1298 800
3
Operator
Cycle Time
A 86.5
B 96
Total 182.5 157.1
4
Number of
Operators
A 3 2
B 1 1
Total 4 3
6 Productivity
A 24.8 37.1
B 10 10
Table 13: Results
X. Conclusion
The aim of the paper to integrate 2 lines by
reducing space and operator results in
effectively utilization of space by 48% and
the manpower by 33% was achieved.
Different tools like takt time, line balancing,
MTM/UAS analysis etc. were used under
LLD technique. The integration carried out on
parameters like number of operators, cycle
time, space. Integrated layout is simulated and
validated through trial runs. The project
yielded good results in terms of space and
manpower utilization.
References
[1]. Process Cycle Efficiency Improvement
through Lean: A Case Study, Author: D.
Rajentbirakumar; P.V. Mohanram; S.G.
Harikarthik, Journal: International Journal
of Lean Thinking, Year: 2011 Vol: 2
Issue: 1 Pages/record No.: 46-58.
[2]. Designing of an Assembly Line based on
Reliability Approach, Author: Dilip Roy;
Debdip Khan, Journal: International
Journal of Optimization and Control:
Theories & Applications, Year: 2011 Vol:
1 Issue: 1 Pages/record No.: 45-52
[3]. Bosch Ltd, “BPS manual”, 2005, Bosch
Ltd, “Industrial Engineering hand book”,
2007
[4]. References: Bosch Norms - N62C, MTM
Grundlehrgang material of DMTMV,
MTM Basic Course material of MICO, I
E Handbook of MICO/BanW
[5]. http://www.linkedin.com/answers/busines
s-operations/supply-chain
management/OPS_SCH/260818-2596096
By: Alvis Lazarus A. Country Manager -
All India Distribution Ops (Logistics,
Warehousing, Transportation & Supply
chain)
[6]. http://www.productivity.in/knowledgebas
e/Industrial%20Engineering%20Docs/b.
%20Methods%20Engineering/2.1%20Wo
rk%20Study.pdf
1
MTech (MEM) Student, Department of
Industrial Engineering and Management,
DSCE, Kumarswamy Layout, Bangalore-78,
India.
2
Professor, Department of Industrial
Engineering and Management, DSCE,
Kumarswamy Layout, Bangalore-78, India.
3
Deputy Manager, Industrial Engineering,
Bosch Ltd., Bangalore