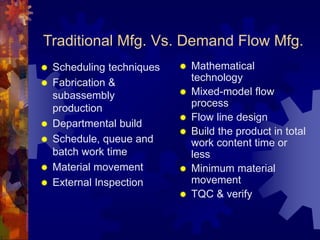
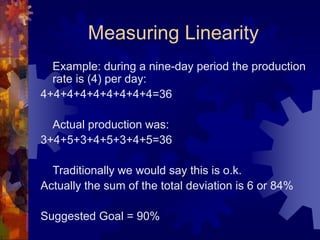
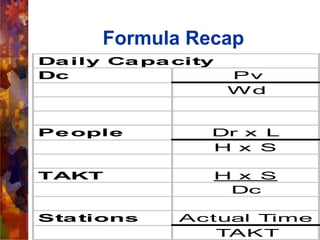
Welcome To Demand Flow
Technology Workshop
Principles of Lean Manufacturing
Objectives
 Develop the knowledge of what the
philosophies and techniques are and why
they are important
 Total picture of the the demand flow
technology business strategy
 Understand and establish how to perform the
techniques and skills learned
 Exercises and feedback
 Technical information and examples
Cycle Time
One of the most noteworthy
accomplishments in keeping the price of
Ford products low is the gradual
shortening of the production cycle. The
longer an article is in the process of
manufacture and the more it is moved
about, the greater is its ultimate cost.
WHAT IS DFT ANYWAY?
Lean Is Market Driven
Every morning in Africa, a gazelle wakes up. It
knows it must run faster than the fastest lion
or it will be killed. Every morning a lion wakes
up. It knows it must outrun the slowest
gazelle or it will starve to death.
It doesn’t matter whether you are a lion or a
gazelle – when the sun comes up, you had
better be running.
Defining DFT
DFT has been defined in many different
ways:
A systematic approach to identifying
and eliminating waste (non-value-
added-activities) through continuous
improvement by flowing the product at
the pull of the customer in pursuit of
perfection.
Defining DFT
A manufacturing technology that focuses
an aggressive flow process that seeks
to eliminate or minimize non-value
added work in the production process
while emphasizing quality throughout
the process.
Primary Objective
to build a HIGH QUALITY product in the
SHORTEST PRODUCTION time and at
the LOWEST POSSIBLE COST
What are the advantages of DFT
 People – the number of people needed
to produce the daily rate is calculated
daily
 Processes and quality checks are
documented (A.I., OMS & SOE’s)
 Quality built into the product
 Kanban
 Less material in WIP and RIP
What are the advantages of DFT
 Component kanban – two-bin system
 NVA work is minimized or eliminated
 Processes are in a constant continuous
improvement state
 Speed-to-market
 Next day
 Customer Responsiveness
Cost Distribution
 Labor – 10%
 Pay Cut
 Layoff
 Work Harder
 Overhead – 20%
 Benefits
 Utilities
 Training & Education
 Material – 70%
 Eliminate Scrap
 Eliminate Inventory
 Demand Flow Business Strategy
70%
20%
10%
 Station 1
 One-Down Operation
 Out-of-Box
 FG’s
 Customer
Cost to the Company
Defect Found At …..
Traditional Mfg. Vs. Demand Flow Mfg.
 Scheduling techniques
 Fabrication &
subassembly
production
 Departmental build
 Schedule, queue and
batch work time
 Material movement
 External Inspection
 Mathematical
technology
 Mixed-model flow
process
 Flow line design
 Build the product in total
work content time or
less
 Minimum material
movement
 TQC & verify
Product Synchronization
A relationship of the processes in a flow to
produce a product.
Product Synch
Teams
DFT Activity Sheet Transports MP-3 Stacker-2 Depositor Key/edplt MMD Divert Divert-Tran PPM IDM CASSETTE Bins Prt-A
Develop DFT Implementation Sch. X X X X X X X X X X X X X
Train Personal in DFT Concept X X X X X X X X X X X X X
Develop Product Sync X X X X X X X X X X X X X
Establish Takt X X X x X X X X X
Completed SOE'S ( Timing) X X X X X X X X X X X X
Develop Oms's X X X X X
Balance Line X X X X X X X X X
Set IPK's x X X X X X X X X
Calculate OPR & Manning X X X X X X X X X
Trained and Certify Operatios X X X X X X X X X X X X X
Perform Pull Sequence Audit X X X X X X X X X
Wet Line X X X X X X X X X X X X X
TPCt X X X X X X X X X
Flow Rate X X X X X X X X X
Teams Attacking TPCt X X X X X X X X X
Process Mapping
Matrix of products across the top and
processes along the side
Process Mapping Build Base MMD Team MP-B,C Divert line Trans/Div TQC MMD is Ship to
Place on pushes cart place dual place Div is place on checks TQC'd for finish goods
cart to MP-B,C Picker on on top of top of Div. are done wiring Unit
line cart to Picker, tightens on all is tested
Divert Line tightens latches, & modules recorded
MMD latches& add belt. CCA brd on test log
Module add belt. Cart is is added
Cart pushed pushed to wire are
to Trans/Div MMD line routed &
line log is
filled out.
00100264F14A * * * * * * *
00100264F24B * * * * * *
00100264F24A * * * * *
00102716F14A * * * * * * *
00102716F14B * * * * * * *
00102170F14A * * * * * *
00101070F14D * * * * * *
00101070F13A * * * * * *
00101070F24A * * * * * *
00101070F21A * * * * * *
00101070F21B * * * * *
Sequence of Events
Defines quality criteria against each work
element, value-added steps and time
estimates.
SOE
Part Number: 49-006633-000D SEQUENCE of EVENTS Date: 3/9/01
SEQ Task Description VA SET-UP MACHINE LABOR MOVE TQC INFORMATION
# M L M L
Station 1
10 Position floor brace into T-22586. * 0:02
20 Place floor in T-22586 (on top of Floor * 0:04 Verify- The minimum/maximum floor
Brace). width from end to end at the bend line
30 Insert rivets into 4 holes. Seat the rivets * 0:26 using T-28598, at least 1 per hour.
by using the trigger on the gun. Verify- 4 Studs are present on floor
40 Insert the stand-offs into the tool. Place * 0:30 assembly.
into the tool. Apply Loctite onto the Verify- Rivets are flush and floor brace
screws and secure to stand-offs. is tight.
Remove floor from tool.
50 Prepare surface of floor by cleaning the * 0:07
spring mounting area with alcohol and
water solution. Verify- The surface is thoroughly dry
60 Repeat steps 1 through 5 for second 1:09 before preceeding.
floor.
Total time for station = 2:18
Operational Method Sheet
(OMS)
A “colored” graphic representation of
quality criteria and work content
defined by the S.O.E. to be performed
at an operation
Work Content
TQC – check someone else work
Verify – check your own work
Demand at Capacity - Dc
The highest targeted volume output of
products that is planned to be achieved
by a demand flow manufacturing
process
Dc
Dc = Pv
Wd
100 units per month
20 days =
5 units/day
Dc = Designed Daily Rate
He = Effective Work Hours
S = Shifts per day
400 units per month
20 days =
20 units/day
Total Product Cycle Time (TPCT)
The calculated work content through the
longest path of the processes required
to build a product
Money Picker (6633D) = 30 min/prs 0.5
Stacker (7835H) = 42 min/prs 0.7
Transport (7836B) = 23min/prs 0.383
Printer (1670A) = 40 min/prs 0.66
TAKT
The calculated target of work content time
to be performed independently by a
person or machine in a demand flow
line
TAKT Conversion
100’s or Minutes
 7.66/5 = 1.532 hr/unit (IDM)
92 min/unit
7.66/20 = 0.383 hr/unit (R/L transport)
23 min/unit
 7.66/111 = 0.069 (Picker)
4.14 min/unit
Stations
Actual Time
TAKT Time
Money Picker
30 minutes assembly time
4.14 TAKT
= 7.24
= 7 stations
Resources
Resources can be:
Operations – labor
Machines
Pieces – batch equipment
People - flexible
Flexible Employees
 Employees in a DFT line have a
minimum flexibility of three operations:
 Primary
 One up-stream
 One down-stream
People (Dr)
Resources are
calculated daily to
determine the
requirement to
produce the daily
rate
Dc x L
H x S
Money picker
50 x .50
(8) X (1)
=3.125
3 people
Line Balancing Tools
Tools used when actual time at an operation
exceed TAKT
 Relocate work
 Reduce or eliminate non-value added work
content
 Add resources or duplicate resources
 Move inventory and time (Kanban)
Certification
 Meet TAKT
 Train others
 Meet quality criteria
 Flex
In-Process Kanban (IPK)
A visual signal that identifies when work
needs to be performed in a line
Kanban Card
A card used as a communications signal
to pull material based on demand
Pull Sequence
Every part that is kanban pulled must
have a definable path that identifies the
supply and consumption points
(e.g Line, Rip, Wip, FG’s)
Mixed Model Line
A primary goal of demand flow manufacturing is
to design flow lines to produce families of
similar products. The mixed model line has
the ability to build a range of volumes of any
product, any day, based on the direction of
actual customer demand.
Backflush
The method used to relieve RIP (Raw in
Process) inventory of a product’s bill of
material quantity when a product is
complete
Communication Lights
Management Light – A light that can be
seen from a wide area to identify if
action needs to be taken on the line
e.g Andon
Measuring Linearity
Example: during a nine-day period the production
rate is (4) per day:
4+4+4+4+4+4+4+4+4=36
Actual production was:
3+4+5+3+4+5+3+4+5=36
Traditionally we would say this is o.k.
Actually the sum of the total deviation is 6 or 84%
Suggested Goal = 90%
Formula Recap
Daily Capacity
Dc Pv
Wd
People Dr x L
H x S
TAKT H x S
Dc
Stations Actual Time
TAKT
QUESTIONS???

Demand Flow Technology workshop - Lean manufacturing

  • 1.
    Welcome To DemandFlow Technology Workshop Principles of Lean Manufacturing
  • 2.
    Objectives  Develop theknowledge of what the philosophies and techniques are and why they are important  Total picture of the the demand flow technology business strategy  Understand and establish how to perform the techniques and skills learned  Exercises and feedback  Technical information and examples
  • 3.
    Cycle Time One ofthe most noteworthy accomplishments in keeping the price of Ford products low is the gradual shortening of the production cycle. The longer an article is in the process of manufacture and the more it is moved about, the greater is its ultimate cost.
  • 4.
    WHAT IS DFTANYWAY?
  • 5.
    Lean Is MarketDriven Every morning in Africa, a gazelle wakes up. It knows it must run faster than the fastest lion or it will be killed. Every morning a lion wakes up. It knows it must outrun the slowest gazelle or it will starve to death. It doesn’t matter whether you are a lion or a gazelle – when the sun comes up, you had better be running.
  • 6.
    Defining DFT DFT hasbeen defined in many different ways: A systematic approach to identifying and eliminating waste (non-value- added-activities) through continuous improvement by flowing the product at the pull of the customer in pursuit of perfection.
  • 7.
    Defining DFT A manufacturingtechnology that focuses an aggressive flow process that seeks to eliminate or minimize non-value added work in the production process while emphasizing quality throughout the process.
  • 8.
    Primary Objective to builda HIGH QUALITY product in the SHORTEST PRODUCTION time and at the LOWEST POSSIBLE COST
  • 9.
    What are theadvantages of DFT  People – the number of people needed to produce the daily rate is calculated daily  Processes and quality checks are documented (A.I., OMS & SOE’s)  Quality built into the product  Kanban  Less material in WIP and RIP
  • 10.
    What are theadvantages of DFT  Component kanban – two-bin system  NVA work is minimized or eliminated  Processes are in a constant continuous improvement state  Speed-to-market  Next day  Customer Responsiveness
  • 11.
    Cost Distribution  Labor– 10%  Pay Cut  Layoff  Work Harder  Overhead – 20%  Benefits  Utilities  Training & Education  Material – 70%  Eliminate Scrap  Eliminate Inventory  Demand Flow Business Strategy 70% 20% 10%
  • 12.
     Station 1 One-Down Operation  Out-of-Box  FG’s  Customer Cost to the Company Defect Found At …..
  • 13.
    Traditional Mfg. Vs.Demand Flow Mfg.  Scheduling techniques  Fabrication & subassembly production  Departmental build  Schedule, queue and batch work time  Material movement  External Inspection  Mathematical technology  Mixed-model flow process  Flow line design  Build the product in total work content time or less  Minimum material movement  TQC & verify
  • 14.
    Product Synchronization A relationshipof the processes in a flow to produce a product.
  • 15.
    Product Synch Teams DFT ActivitySheet Transports MP-3 Stacker-2 Depositor Key/edplt MMD Divert Divert-Tran PPM IDM CASSETTE Bins Prt-A Develop DFT Implementation Sch. X X X X X X X X X X X X X Train Personal in DFT Concept X X X X X X X X X X X X X Develop Product Sync X X X X X X X X X X X X X Establish Takt X X X x X X X X X Completed SOE'S ( Timing) X X X X X X X X X X X X Develop Oms's X X X X X Balance Line X X X X X X X X X Set IPK's x X X X X X X X X Calculate OPR & Manning X X X X X X X X X Trained and Certify Operatios X X X X X X X X X X X X X Perform Pull Sequence Audit X X X X X X X X X Wet Line X X X X X X X X X X X X X TPCt X X X X X X X X X Flow Rate X X X X X X X X X Teams Attacking TPCt X X X X X X X X X
  • 16.
    Process Mapping Matrix ofproducts across the top and processes along the side
  • 17.
    Process Mapping BuildBase MMD Team MP-B,C Divert line Trans/Div TQC MMD is Ship to Place on pushes cart place dual place Div is place on checks TQC'd for finish goods cart to MP-B,C Picker on on top of top of Div. are done wiring Unit line cart to Picker, tightens on all is tested Divert Line tightens latches, & modules recorded MMD latches& add belt. CCA brd on test log Module add belt. Cart is is added Cart pushed pushed to wire are to Trans/Div MMD line routed & line log is filled out. 00100264F14A * * * * * * * 00100264F24B * * * * * * 00100264F24A * * * * * 00102716F14A * * * * * * * 00102716F14B * * * * * * * 00102170F14A * * * * * * 00101070F14D * * * * * * 00101070F13A * * * * * * 00101070F24A * * * * * * 00101070F21A * * * * * * 00101070F21B * * * * *
  • 18.
    Sequence of Events Definesquality criteria against each work element, value-added steps and time estimates.
  • 19.
    SOE Part Number: 49-006633-000DSEQUENCE of EVENTS Date: 3/9/01 SEQ Task Description VA SET-UP MACHINE LABOR MOVE TQC INFORMATION # M L M L Station 1 10 Position floor brace into T-22586. * 0:02 20 Place floor in T-22586 (on top of Floor * 0:04 Verify- The minimum/maximum floor Brace). width from end to end at the bend line 30 Insert rivets into 4 holes. Seat the rivets * 0:26 using T-28598, at least 1 per hour. by using the trigger on the gun. Verify- 4 Studs are present on floor 40 Insert the stand-offs into the tool. Place * 0:30 assembly. into the tool. Apply Loctite onto the Verify- Rivets are flush and floor brace screws and secure to stand-offs. is tight. Remove floor from tool. 50 Prepare surface of floor by cleaning the * 0:07 spring mounting area with alcohol and water solution. Verify- The surface is thoroughly dry 60 Repeat steps 1 through 5 for second 1:09 before preceeding. floor. Total time for station = 2:18
  • 20.
    Operational Method Sheet (OMS) A“colored” graphic representation of quality criteria and work content defined by the S.O.E. to be performed at an operation Work Content TQC – check someone else work Verify – check your own work
  • 21.
    Demand at Capacity- Dc The highest targeted volume output of products that is planned to be achieved by a demand flow manufacturing process
  • 22.
    Dc Dc = Pv Wd 100units per month 20 days = 5 units/day Dc = Designed Daily Rate He = Effective Work Hours S = Shifts per day 400 units per month 20 days = 20 units/day
  • 23.
    Total Product CycleTime (TPCT) The calculated work content through the longest path of the processes required to build a product Money Picker (6633D) = 30 min/prs 0.5 Stacker (7835H) = 42 min/prs 0.7 Transport (7836B) = 23min/prs 0.383 Printer (1670A) = 40 min/prs 0.66
  • 24.
    TAKT The calculated targetof work content time to be performed independently by a person or machine in a demand flow line
  • 25.
    TAKT Conversion 100’s orMinutes  7.66/5 = 1.532 hr/unit (IDM) 92 min/unit 7.66/20 = 0.383 hr/unit (R/L transport) 23 min/unit  7.66/111 = 0.069 (Picker) 4.14 min/unit
  • 26.
    Stations Actual Time TAKT Time MoneyPicker 30 minutes assembly time 4.14 TAKT = 7.24 = 7 stations
  • 27.
    Resources Resources can be: Operations– labor Machines Pieces – batch equipment People - flexible
  • 28.
    Flexible Employees  Employeesin a DFT line have a minimum flexibility of three operations:  Primary  One up-stream  One down-stream
  • 29.
    People (Dr) Resources are calculateddaily to determine the requirement to produce the daily rate Dc x L H x S Money picker 50 x .50 (8) X (1) =3.125 3 people
  • 30.
    Line Balancing Tools Toolsused when actual time at an operation exceed TAKT  Relocate work  Reduce or eliminate non-value added work content  Add resources or duplicate resources  Move inventory and time (Kanban)
  • 31.
    Certification  Meet TAKT Train others  Meet quality criteria  Flex
  • 32.
    In-Process Kanban (IPK) Avisual signal that identifies when work needs to be performed in a line
  • 33.
    Kanban Card A cardused as a communications signal to pull material based on demand
  • 34.
    Pull Sequence Every partthat is kanban pulled must have a definable path that identifies the supply and consumption points (e.g Line, Rip, Wip, FG’s)
  • 35.
    Mixed Model Line Aprimary goal of demand flow manufacturing is to design flow lines to produce families of similar products. The mixed model line has the ability to build a range of volumes of any product, any day, based on the direction of actual customer demand.
  • 36.
    Backflush The method usedto relieve RIP (Raw in Process) inventory of a product’s bill of material quantity when a product is complete
  • 37.
    Communication Lights Management Light– A light that can be seen from a wide area to identify if action needs to be taken on the line e.g Andon
  • 38.
    Measuring Linearity Example: duringa nine-day period the production rate is (4) per day: 4+4+4+4+4+4+4+4+4=36 Actual production was: 3+4+5+3+4+5+3+4+5=36 Traditionally we would say this is o.k. Actually the sum of the total deviation is 6 or 84% Suggested Goal = 90%
  • 39.
    Formula Recap Daily Capacity DcPv Wd People Dr x L H x S TAKT H x S Dc Stations Actual Time TAKT
  • 40.