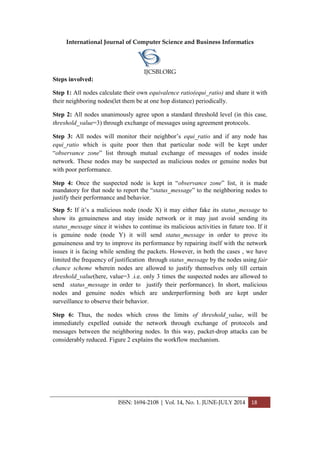
The document is a research paper that presents a new symmetric block cipher algorithm for image encryption based on the 3D Rossler system, demonstrating its efficacy through experimentation. The algorithm combines chaotic cryptography with a unique key-splitting method applied to the RGB channels of color images, enhancing both the encryption structure and diffusion scheme. Security analyses show promising results, indicating strong performance and resistance to vulnerabilities in comparison to existing methods.


![Table of Contents VOL 14, NO 1 JULY 2014
Symmetric Image Encryption Algorithm Using 3D Rossler System........................................................1
Vishnu G. Kamat and Madhu Sharma
Node Monitoring with Fellowship Model against Black Hole Attacks in MANET.................................... 14
Rutuja Shah, M.Tech (I.T.-Networking), Lakshmi Rani, M.Tech (I.T.-Networking) and S. Sumathy, AP [SG]
Load Balancing using Peers in an E-Learning Environment ...................................................................... 22
Maria Dominic and Sagayaraj Francis
E-Transparency and Information Sharing in the Public Sector ................................................................ 30
Edison Lubua (PhD)
A Survey of Frequent Subgraphs and Subtree Mining Methods ............................................................. 39
Hamed Dinari and Hassan Naderi
A Model for Implementation of IT Service Management in Zimbabwean State Universities ................ 58
Munyaradzi Zhou, Caroline Ruvinga, Samuel Musungwini and Tinashe Gwendolyn Zhou
Present a Way to Find Frequent Tree Patterns using Inverted Index ..................................................... 66
Saeid Tajedi and Hasan Naderi
An Approach for Customer Satisfaction: Evaluation and Validation ....................................................... 79
Amina El Kebbaj and A. Namir
Spam Detection in Twitter – A Review...................................................................................................... 92
C. Divya Gowri and Professor V. Mohanraj
IJCSBI.ORG](https://image.slidesharecdn.com/vol14no1-july2014-171208072343/85/Vol-14-No-1-July-2014-2-320.jpg)
![International Journal of Computer Science and Business Informatics
IJCSBI.ORG
ISSN: 1694-2108 | Vol. 14, No. 1. JUNE-JULY 2014 1
Symmetric Image Encryption
Algorithm Using 3D Rossler System
Vishnu G. Kamat
M Tech student in Information Security and Management
Department of IT, DIT University
Dehradun, India
Madhu Sharma
Assistant Professor
Department of Computer Science, DIT University
Dehradun, India
ABSTRACT
Recently a lot of research has been done in the field of image encryption using chaotic
maps. In this paper, we propose a new symmetric block cipher algorithm using the 3D
Rossler system. The algorithm utilizes the approach used by Mohamed Amin et al.
[Commun. Nonlinear Sci. Numer. Simulat, (2010)] and Vinod Patidar et al. [Commun
Nonlinear SciNumerSimulat, (2009)]. The merits of these algorithms such as the encryption
structure and the diffusion scheme respectively are combined with an approach to split the
key for the three dimensions to use for encryption of color (RGB) images. The
experimentation results suggest an overall better performance of the algorithm.
Keywords
Image Encryption, Rossler System, Block Cipher, Security Analysis.
1. INTRODUCTION
Image encryption is relatively different from text encryption. Image is made
up of pixels and they are highly correlated; so different approaches are
followed for encryption of images [1-12]. One of the approaches is known
as chaotic cryptography. In this approach, for encryption we use chaotic
maps, which generate good pseudo-random numbers. Cryptographic
properties of these maps such as, sensitive dependence on initial parameters,
ergodic and random like behavior, make them ideal for use in designing
secure cryptographic algorithms. Many scholars have proposed various
chaos-based encryption schemes in recent years [4-12].
A scheme proposed by Mohamed Amin et al. [11] uses Tent map as the
chaotic map and the scheme is implemented for gray scale images. They
proposed a new approach of using the plaintext as blocks of bits rather than
block of pixels. Another scheme proposed by Vinod Patidaret al.[12] uses
chaotic standard and logistic maps and they introduce a way of spreading
the bits using diffusion to avoid redundancy. In this paper, we propose an
algorithm which utilizes the merits of the mentioned schemes. The](https://image.slidesharecdn.com/vol14no1-july2014-171208072343/85/Vol-14-No-1-July-2014-3-320.jpg)
![International Journal of Computer Science and Business Informatics
IJCSBI.ORG
ISSN: 1694-2108 | Vol. 14, No. 1. JUNE-JULY 2014 2
algorithm uses the Rossler system for the chaotic key generation. We
demonstrate a way to split the 3 dimensions of the key for the 3 image
channels i.e. Red, Green and Blue. The algorithm in [11] is used as a base
structure and the diffusion concept from [12] is used to spread the effect of
adding the key. The symmetric Feistel structure, diffusion method and key
splitting of the encryption scheme provide better results.
The rest of the paper is organized as follows: Section 2 provides a brief
overview of the Rossler system. Section 3 provides the algorithmic details.
The results of the security analysis are shown in section 4. Lastly, Section 5
concludes the paper.
2. BRIEF OVERVIEW OF 3D ROSSLER SYSTEM
Rossler system is a system of non-linear differential equations which has
chaotic properties [13]. Otto Rossler defined these equations in 1976. The
equations are as given below
Xn+1 = -Yn-Zn
Yn+1 = Xn + αYn (1)
Zn+1 = β + Zn (Xn-γ)
where, α, β and γ are real parameters. Rossler system's behavior is
dependent on the values of the parameters α, β and γ. For different values of
these parameters the system displays considerable changes. It may be
chaotic, converge toward a fixed point, follow a periodic orbit or escape
towards infinity. The Rossler system displays chaotic behavior for the
values of α=0.432, β=2 and γ=4.
The chaotic behavior refers to the fact that keeping the parameters constant,
even a slight change in the initial value would bring a significant change in
the subsequent values. For example the value of Z0 = 0.3 generates the value
of Z1 = 0.5. After changing the value of Z0to0.6it generates the value of Z1 =
-1. The same chaotic rule applies for the changes of other two dimensions
(X and Y). This chaotic behavior is known as deterministic chaos, i.e. the
knowledge of initial values and parameter values can help in recreating the
same chaotic pattern. Hence the initial conditions have to be shared between
the entities using the system for encryption/decryption process.
3. PROPOSED ALGORITHM
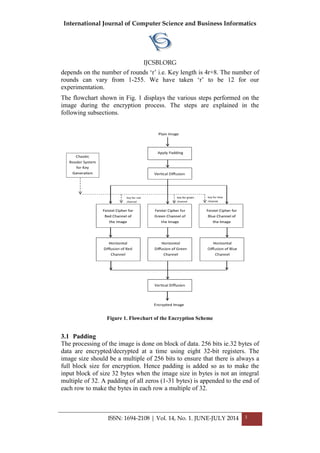
In this section we provide details of our algorithm. The algorithm is
designed to work with color images (RGB). In this scheme the plaintext
(image) is taken as blocks of bits. The block size is 8w, where ‘w’ is the
word size which is 32 bits. Each block of data is divided and stored into 8
w-bit registers and operations are performed on them. The key length](https://image.slidesharecdn.com/vol14no1-july2014-171208072343/85/Vol-14-No-1-July-2014-4-320.jpg)
![International Journal of Computer Science and Business Informatics
IJCSBI.ORG
ISSN: 1694-2108 | Vol. 14, No. 1. JUNE-JULY 2014 4
For example if the image is of dimensions 252 x 252 pixels, a 4 byte
padding of zeros is appended at the end of each row. The last byte of the
image then stores the number of bytes used as padding as a pixel value i.e. 4
in this case. This pixel value is used to remove the padding after decryption.
After retrieving the number of bytes padded ‘n’, all rows are checked to
determine if zeros exist in all the last ‘n’ bytes and in ‘n-1’ bytes of the last
row. The padding is then removed to generate the original image.
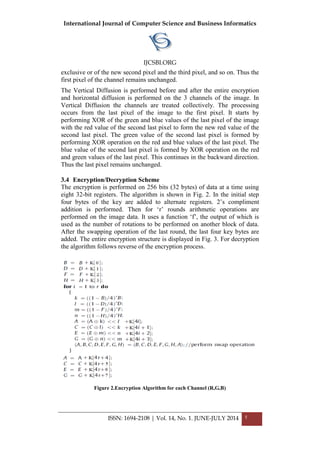
3.2 Key Generation
The key is generated by the 3D chaotic Rossler system as shown in (1). The
number of key bytes ‘t’ depends on the number of rounds ‘r’ i.e. t=4r+8. We
use the three equations separately. The random sequence generated by each
equation of the map is used as a key separately during the encryption
process of the red, green and blue channel of the image respectively. The
key generation concept is as shown below. The steps repeat ‘t’ number of
times to generate necessary key bytes.
a. Iterate Rossler system of equations (1) ‘r’ times where ‘r’ is the
number of rounds.
b. Use the decimal part of the X, Y, Z values to generate the key byte.
Xn = abs (Xn - integer part); // decimal part of x
Yn = abs (Yn - integer part); // decimal part of y
Zn = abs (Zn - integer part); // decimal part of z
c. Key byte for each dimension (R,G,B) is taken as X, Y, Z values
respectively by mapping it to a value between 0-255.
d. For the next set of key bytes the number of iterations is changed to a
value obtained by performing exclusive-or on the current set of key
bytes.
Iterations for next key byte = XOR (Xn, Yn, Zn);
3.3 Vertical and Horizontal Diffusion
The diffusion process explained in [12] is used in the algorithm. The
horizontal diffusion in our algorithm is used in a slightly different way i.e. it
is performed separately on each channel after the encryption of the channel
rather than using it on the entire image. The diffusion ensures spread of the
key additions for the channel. The horizontal diffusion moves in the forward
direction from the first pixel of a channel to the last. The second pixel is the
exclusive or of first and second pixel of a channel, the third pixel is the](https://image.slidesharecdn.com/vol14no1-july2014-171208072343/85/Vol-14-No-1-July-2014-6-320.jpg)
![International Journal of Computer Science and Business Informatics
IJCSBI.ORG
ISSN: 1694-2108 | Vol. 14, No. 1. JUNE-JULY 2014 7
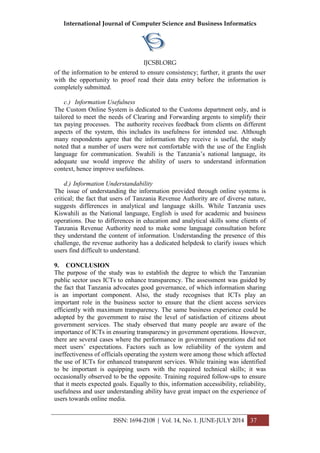
4. EXPERIMENTATION RESULTS
We performed security analysis on six 256 x 256 color(RGB) images as
shown in Fig. 4. The statistical and differential analysis tests performed
display very favorable results. The results display the strength and security
of the algorithm. The results have been given in [14] to demonstrate the
overcoming of vulnerability in [11].
Figure 4.Plain images (clockwise from top left): Lena, Bridge, Lake, Plane,
Peppersand Mandrill
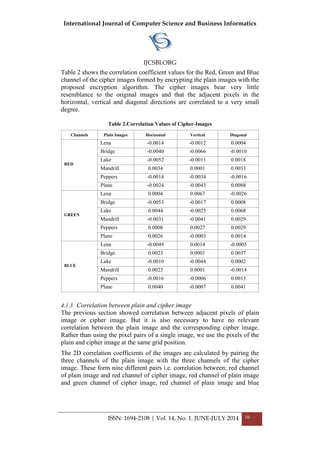
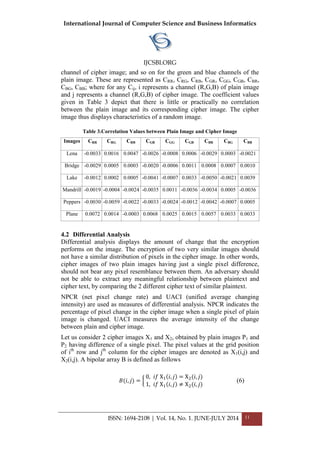
4.1 Statistical Analysis
Statistical analysis is performed to determine the correlation between the
plain image and the cipher image. For an encryption system to be strong the
cipher image should not be correlated to the plain image and the cipher
image pixels should not have correlation among them. In this section we
provide the histogram and correlation analysis.
4.1.1 Histogram Analysis
When the encrypted image and the plain image do not show high degree of
correlation we can consider the encryption to be secure form information
leakage. Histograms are used to plot the number of pixels at each intensity
level i.e. pixels having values 0-255. This helps in displaying how the pixels
are distributed.
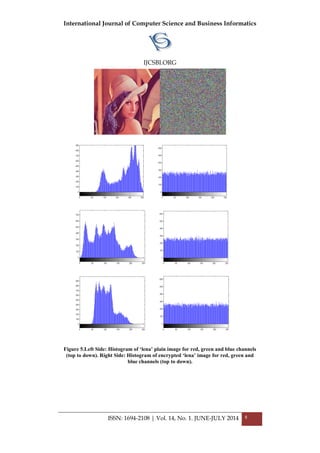
Fig. 5 depicts the histogram for the red, green and blue channels of the plain
image ‘lena’ on the left side (from top to down) and the histograms of the
‘lena’ image after encryption for the three channels respectively on the right
side. They depict that the encryption does not leave any concentration of a
single pixel value.](https://image.slidesharecdn.com/vol14no1-july2014-171208072343/85/Vol-14-No-1-July-2014-9-320.jpg)

![International Journal of Computer Science and Business Informatics
IJCSBI.ORG
ISSN: 1694-2108 | Vol. 14, No. 1. JUNE-JULY 2014 12
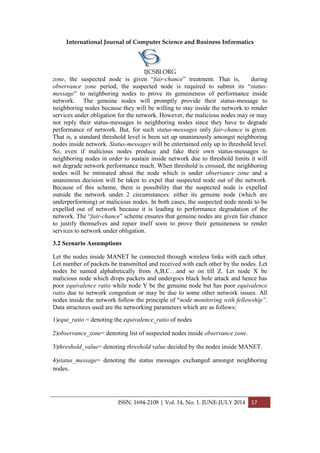
Values for NPCR and UACI are calculated as given in equations (7) and (8),
where W and H denote width and height of the cipher images, T denotes the
largest supported pixel value in the cipher images (255 in our case) and
abs() computes the absolute value. The NPCR and UACI values given in
Table 4 show that the encryption algorithm is secure against differential
attacks.
NPCR =
𝐵(𝑖,𝑗)𝑖,𝑗
W x H
x 100% (7)
UACI =
1
W x H
𝑎𝑏𝑠(x1 𝑖,𝑗 −x2 𝑖,𝑗 )
𝑇𝑖,𝑗 x 100% (8)
Table 4.NPCR and UACI Values Obtained for Encryption of 6 Plain images and Same
Images with 1 Pixel Changed
Plain Images NPCR UACI
Lena 99.6333 33.4706
Bridge 99.5722 33.4403
Lake 99.5900 33.5313
Mandrill 99.6089 33.4595
Peppers 99.6185 33.4657
Plane 99.6206 33.4539
5. CONCLUSION
In this paper we proposed a new image encryption algorithm. The merits of
the recent research, based on results, were combined along with a symmetric
approach of encryption to provide a secure algorithm. The diffusion
mechanism along with Feistel structure makes the algorithm stronger. The
3D Rossler system of equations is used for the random key generation. The
splitting of the three dimensions of the key for the three channels makes the
cryptanalysis to obtain the key more difficult. The experimentation
performed depict that the algorithm generates favorable results.
REFERENCES
[1] Chang, C.-C., Hwang, M.-S.and Chen, T.-S., 2001. A New Encryption Algorithm for
Image Cryptosystems. Journal of Systems and Software, Vol. 58, No. 2, pp. 83-91.
[2] Yano, K. and Tanaka, K., 2002. Image Encryption Scheme Based on a Truncated
Baker Transformation. IEICE Transactions on Fundamentals of Electronics,
Communications and Computer Sciences, Vol. E85-A, No. 9, pp. 2025-2035.
[3] Gao, T. and Chen, Z., 2008. Image Encryption Based on a New Total Shuffling
Algorithm.Chaos, Solitons and Fractals, Vol. 38, No. 1, pp. 213-220.](https://image.slidesharecdn.com/vol14no1-july2014-171208072343/85/Vol-14-No-1-July-2014-14-320.jpg)
![International Journal of Computer Science and Business Informatics
IJCSBI.ORG
ISSN: 1694-2108 | Vol. 14, No. 1. JUNE-JULY 2014 13
[4] Chen, G., Mao, Y. and Chui, C.K., 2004. A Symmetric Image Encryption Based on 3D
Chaotic Cat Maps. Chaos, Solitons and Fractals, Vol. 21, pp. 749-761.
[5] Mao, Y., Chen, G. and Lian, S., 2004. A Novel Fast Image Encryption Scheme Based
on 3D Chaotic Baker Maps. International Journal of Bifurcation and Chaos, Vol. 14,
No. 10, pp. 3613-3624.
[6] Guan, Z.-H., Huang, F. and Guan, W., 2005. Chaos Based Image Encryption
Algorithm. Physics Letters A, Vol. 346, pp. 153-157.
[7] Zhang, L., Liao, X. and Wang, X., 2005. An Image Encryption Approach Based on
Chaotic Maps. Chaos, Solitons and Fractals, Vol. 24, pp. 759-765.
[8] Gao, H., Zhang, Y., Liag, S. and Li, D., 2006. A New Chaotic Algorithm for Image
Encryption. Chaos, Solitons and Fractals, Vol. 29, pp. 393-399.
[9] Pareek, N.K., Patidar, V. and Sud, K.K., 2006. Image Encryption Using Chaotic
Logistic Map. Image and Vision Computing, Vol. 24, pp. 926-934.
[10]Wong, K.-W., Kwok, B.S.-H.and Law, W.-S., 2008. A Fast Image Encryption Scheme
Based on Chaotic Standard Map. Physics Letters A, Vol. 372, pp. 2645-2652.
[11]Amin, M., Faragallah, O.S. and Abd El-Latif, A.A., 2010. A Chaotic Block Cipher
Algorithm for Image Cryptosystems. Communications in Nonlinear Science and
Numerical Simulation, Vol. 15, pp. 3484-3497.
[12]Patidar, V., Pareek, N.K. and Sud, K.K.,2009. A New Substitution-Diffusion Based
Image Cipher Using Chaotic Standard and Logistic Maps. Communications in
Nonlinear Science and Numerical Simulation, Vol. 14, pp. 3056-3075.
[13]Rossler, O.E., 1976. An Equation for Continuous Chaos. Physics Letters A, Vol. 57,
No. 5, pp. 397-398.
[14]Kamat, V.G. and Sharma, M., 2014. Enhanced Chaotic Block Cipher Algorithm for
Image Cryptosystems. International Journal of Computer Science Engineering, Vol. 3,
No. 2, pp. 117-124.
This paper may be cited as:
Kamat V. G. and Sharma M., 2014. Symmetric Image Encryption
Algorithm Using 3D Rossler System. International Journal of Computer
Science and Business Informatics, Vol. 14, No. 1, pp. 1-13.](https://image.slidesharecdn.com/vol14no1-july2014-171208072343/85/Vol-14-No-1-July-2014-15-320.jpg)
![International Journal of Computer Science and Business Informatics
IJCSBI.ORG
ISSN: 1694-2108 | Vol. 14, No. 1. JUNE-JULY 2014 14
Node Monitoring with Fellowship
Model against Black Hole Attacks in
MANET
Rutuja Shah, M.Tech (I.T.-Networking)
School of Information Technology & Engineering, VIT University
Lakshmi Rani, M.Tech (I.T.-Networking)
School of Information Technology & Engineering, VIT University
S. Sumathy, AP [SG]
School of Information Technology & Engineering, VIT University
Abstract
Security issues have been considerably increased in mobile ad-hoc networks. Due to absence of any
centralized controller, the detection of problems and recovery from such issues is difficult. The packet
drop attacks are one of those attacks which degrade the network performance. In this paper, we
propose an effective node monitoring mechanism with fellowship model against packet drop attacks
by setting up an observance zone where suspected nodes are observed for their performance and
behavior. Threshold limits are set to monitor the equivalence ratio of number of packets received at
the node and transmitted by node inside mobile ad hoc networks. This fellowship model enforces a
binding on the nodes to deliver essential services in order to receive services from neighboring nodes
thus improving the overall network performance.
Keywords: Black-hole attack, equivalence ratio, fair-chance scheme, observance zone, fellowship
model.
1. INTRODUCTION
Mobile ad-hoc networks are infrastructure less and self organized or configured
network of mobile devices connected with radio signals. There is no centralized
controller for the networking activities like monitoring, modifications and updating
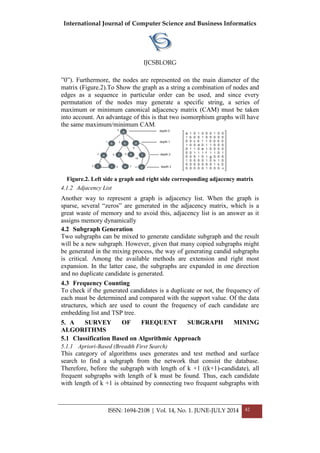
of the nodes inside the network as shown in figure 1. Each node is independent to
move in any direction and hence have the freedom to change the links to other nodes
frequently. There have been serious security threats in MANET in recent years.
These usually lead to performance degradation, less throughput, congestion, delayed
response time, buffer overflow etc. Among them is a famous attack on packets
known as black-hole attack which is also a part of DoS(Denial of service) attacks. In
this, a router relays packets to different nodes but due to presence of malicious nodes](https://image.slidesharecdn.com/vol14no1-july2014-171208072343/85/Vol-14-No-1-July-2014-16-320.jpg)
![International Journal of Computer Science and Business Informatics
IJCSBI.ORG
ISSN: 1694-2108 | Vol. 14, No. 1. JUNE-JULY 2014 15
these packets are susceptible to packet drop attacks. Due to this, there is hindrance is
secure and reliable communication inside network.
Figure 1. MANET Scenario
Section 2 addresses the seriousness of packet drop attacks and related work done so
far in this area. Section 3 elaborates our proposal and defending scheme for packet
drop attacks. Section 4 provides concluding remarks.
2. LITERATURE SURVEY
The packet drop loss in ad-hoc network gained importance because of self-serving
nodes which fail to provide the basic facility of forwarding the packets to
neighboring nodes. This causes an occupational hazard in the functionality of
network. Generally there are two types of nodes- selfish and malicious nodes. Selfish
nodes are those nodes which act in the context of enhancing its performance while
malicious nodes are those which mortifies the functions of network through its
continual activity. The WATCHERS [1] from UC Davis was presented to detect and
remove routers that maliciously drop or misroute packets. A WATCHER was based
on the “principle of packet flow conservation”. But it could not differentiate much
between malicious and genuine nodes. Although it was robust against byzantine
faults, it could not be much effective in today’s internet world to reduce packet loss.
The basic mechanism of packet drop loss is that the nodes do not progress the
packets to other nodes selfishly or maliciously. Packet Drop loss could occur due to
Black hole attack. Sometimes the routers behave maliciously i.e. the routers do not
forwards packets, such kinds of attacks are known as “Grey Hole Attack”. In case of
routers, the attacks can be traced quickly while in the case of nodes it’s a
cumbersome task. Many researchers have worked in this field and have tried to find](https://image.slidesharecdn.com/vol14no1-july2014-171208072343/85/Vol-14-No-1-July-2014-17-320.jpg)
![International Journal of Computer Science and Business Informatics
IJCSBI.ORG
ISSN: 1694-2108 | Vol. 14, No. 1. JUNE-JULY 2014 16
solutions to this attack [2-6]. Energy level was one of the parameter on which the
researchers have shown their results. This idea works on the basis of the ratio of
fraction of energy committed for a node, to overall energy contributed towards the
network. The node is retained inside the network on the basis of energy level and the
energy level is decided by the activeness of node in a network through mathematical
computations. Mathematical computations are [7] too complicated to clench and
sometimes the results are catastrophic. It can be said that the computations are
accurate but they are very much prone to ambiguity in the case of ad-hoc networks.
Few techniques involve usage of routing table information which is modified after
detecting the MAC address of malicious node which uses jamming style DoS attack
to cease their activities [8]. Another approach to reduce attacks was using historical
evidence trust management based strategy. [9] Direct trust value (DTV) was used
amongst neighboring nodes to monitor the behavior of nodes depending on their past
against black hole attacks. However, there is high possibility that trust values may
get compromised by the malicious nodes. Also the third party used for setting the
trust values is also vulnerable to attacks. Recent methods included an [10]
introduction to a new protocol called RAEED (Robust formally Analyzed protocol
for wirEless sEnsor networks Deployment) which reduces this attack but not by a
considerable percentage. To overcome the issues faced in order to implement these
strategies there is a need of an effective mechanism to curb these attacks and make
network more secure.
3. PROPOSED APPROACH
In this paper, we put forth a mechanism to reduce these packet-drop attacks by
implementing “node monitoring with fellowship” technique. We introduce an
obligation on the nodes inside a particular network to render services to network. If
services are not rendered, the node will be expelled outside the performance.
However, we have kept a “fair-chance” scheme for all nodes which help to make out
whether it is genuine node or malicious node.
3.1 Fellowship of Network
The prime parameter we used in this to address packet drop attacks issue is by
maintaining the count of incoming packets, except the destined one on that node and
the count of outgoing nodes except the ones which are originated at that node,
should be same, referred to as “equivalence ratio”. If that count is same, there is
uniform distribution and forwarding of packets among the nodes inside network.
However, if the count is not same, then that particular node is kept under
“observance zone” in order to monitor its suspicious behavior. We suggest a
periodical reporting of all nodes about their equivalence ratio to neighboring nodes
inside the network.
This will help to decide whether to keep a particular node in “observance zone”
which could be done with polling techniques amongst each other. Inside, observance](https://image.slidesharecdn.com/vol14no1-july2014-171208072343/85/Vol-14-No-1-July-2014-18-320.jpg)
![International Journal of Computer Science and Business Informatics
IJCSBI.ORG
ISSN: 1694-2108 | Vol. 14, No. 1. JUNE-JULY 2014 20
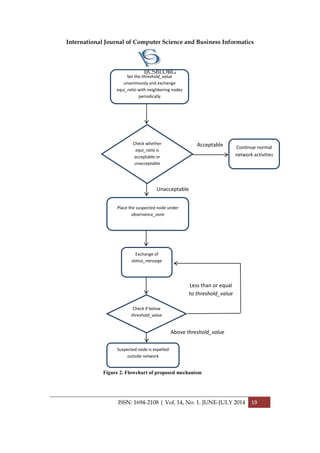
3.3 Advantages:
1. Fair chance scheme ensures genuineness of innocent nodes.
2. No complex mathematical computations of energy levels at each node.
3. Periodical reporting ensures removal of both underperforming and malicious
nodes from the network.
4. Up gradation of network performance in MANET.
3.4 Disadvantages
However, there is an overhead of exchanging more number of messages among the
neighboring nodes. Optimization on number of messages exchanged during
communication can be addressed and worked upon in future research.
4. CONCLUSION
In this paper, we have proposed a novel scheme to reduce packet drop attacks and
enhance the network performance. However, we anticipate our “node-monitoring
with fellowship” model may lead to increase in number of exchanged messages
amongst neighboring nodes during the agreement protocols inside network but at the
same time it will be robust against attacks and thus increase the availability of nodes
in mobile ad-hoc networks. The outcomes of minimizing packet drop loss have better
utility of channel, resources and QoS guaranteed which results in productive priority
management and a considerable controlled traffic by periodic surveillance over
nodes. The future research on this would be to reduce the exchange of messages
amongst the nodes, minimize the overhead and achieve optimization inside mobile
ad-hoc networks.
5. REFERENCES
[1] K. A. Bradley, S. Cheung, N. Puketza, B. Mukherjee and R. A. Olsson, Detecting Disruptive
Routers: A Distributed Network Monitoring Approach, in the 1998 IEEE Symposium on Security and
Privacy, May 1998.
[2] Y.C. Hu, A. Perrig and D. B. Johnson, Ariadne: A Secure On-demand Routing Protocol for Ad
Hoc Networks, presented at International Conference on Mobile Computing and Networking, Atlanta,
Georgia, USA, pp. 12 - 23, 2002.
[3] P. Papadimitratos and Z. J. Haas, Secure Routing for Mobile Ad hoc Networks, presented at SCS
Communication Networks and Distributed Systems Modeling and Simulation Conference, San
Antonio, TX, January2002.
[4] K. Sanzgiri, B. Dahill, B. N. Levine, C. Shields and E. M. Belding-Royer, A Secure Routing
Protocol for Ad Hoc Networks, presented at 10th IEEE International Conference on Network
Protocols (ICNP'02), Paris, pp. 78 - 89, 2002.
[5] V. Balakrishnan and V. Varadharajan, Designing Secure Wireless Mobile Ad hoc Networks,
presented at Proceedings of the 19th IEEE International Conference on advanced information
Networking and Applications (AINA 2005). Taiwan, pp. 5-8, March 2005.](https://image.slidesharecdn.com/vol14no1-july2014-171208072343/85/Vol-14-No-1-July-2014-22-320.jpg)
![International Journal of Computer Science and Business Informatics
IJCSBI.ORG
ISSN: 1694-2108 | Vol. 14, No. 1. JUNE-JULY 2014 21
[6] V. Balakrishnan and V. Varadharajan, Packet Drop Attack: A Serious Threat to Operational
Mobile Ad hoc Networks, presented at Proceedings of the International Conference on Networks and
Communication Systems (NCS 2005), Krabi, pp. 89-95, April 2005.
[7] Venkatesan Balakrishnan and Vijay Varadharajan Short Paper: Fellowship in Mobile Ad hoc
Networks presented at Proceedings of the First International Conference on Security and Privacy for
Emerging Areas in Communications Networks (SECURECOMM’05) IEEE.
[8] Raza, M., and Hyder, S.I. A forced routing information modification model for preventing black
hole attacks in wireless Ad Hoc network presented at Applied Sciences and Technology (IBCAST),
2012, 9th International Bhurban Conference, Islamabad, pp. 418-422, January 2012.
[9] Bo Yang , Yamamoto, R., Tanaka, Y. Historical evidence based trust management strategy
against black hole attacks in MANET published in 14th International Advanced Communication
Technology(ICACT), 2012 on pp. 394 – 399.
[10] Saghar, K., Kendall, D.and Bouridane, A. Application of formal modeling to detect black hole
attacks in wireless sensor network routing protocols .Applied Sciences and Technology (IBCAST),
2014, 11th International Bhurban Conference, Islamabad, pp. 191-194, January 2014.
This paper may be cited as:
Shah, R., Rani, L. and Sumathy, S. 2014. Node Monitoring with Fellowship Model
against Black Hole Attacks in MANET. International Journal of Computer Science
and Business Informatics, Vol. 14, No. 1, pp. 14-21.](https://image.slidesharecdn.com/vol14no1-july2014-171208072343/85/Vol-14-No-1-July-2014-23-320.jpg)
![International Journal of Computer Science and Business Informatics
IJCSBI.ORG
ISSN: 1694-2108 | Vol. 14, No. 1. JUNE-JULY 2014 22
Load Balancing using Peers in an
E-Learning Environment
Maria Dominic
Department of Computer Science,
Sacred Heart College, India
Sagayaraj Francis
Department of Computer Science and Engineering,
Pondicherry Engineering College, India
ABSTRACT
When an e-Learning System is installed on a server, numerous learners make use of it and
they download various learning objects from the server. Most of the time the request is for
same learning object and downloaded from the server which results in server performing
the same repetitive task of locating the file and sending it across to the requestor or the
client. This results in wasting the precious CPU usage of the server for the same task which
has been performed already. This paper provides a novel structure and an algorithm which
stores the details of the various clients who have already downloaded the learning objects
in a dynamic hash table and look up that table when a new request comes in and sends the
learning object from that client to the requestor thus saving the precious CPU time of the
server by harnessing the computing power of the clients.
Keywords
Learning Objects, e-Learning, Load Distribution, Load Balancing, Data Structure, Peer –
Peer Distribution.
1. INTRODUCTION
1.1 e-Learning
Education is defined as the conscious attempt to promote learning in others
to acquire knowledge, skills and character [1]. To achieve this mission
different pedagogies were used and later on with the advent of new
information communication technology tools and popularity gained by
internet were used to enhance the teaching learning process and gave way to
the birth of e-learning [2]. This enabled the learner to learn by breaking the
time, geographical barriers and it allowed them to have individualized
learning paths [3]. The perception on e-Learning or electronic learning is
that it is a combination of internet, electronic form and network to
disseminate knowledge. The key factors of e-learning are reusing, sharing
resources and interoperability [4]. At present there are various organizations](https://image.slidesharecdn.com/vol14no1-july2014-171208072343/85/Vol-14-No-1-July-2014-24-320.jpg)
![International Journal of Computer Science and Business Informatics
IJCSBI.ORG
ISSN: 1694-2108 | Vol. 14, No. 1. JUNE-JULY 2014 23
providing e-learning tools of multiple functionalities and one such is
MOODLE (Modular Object Oriented Dynamic Learning Environment) [5]
which is used in our campus. This in turn created difficulty in sharing the
learning objects between heterogeneous sites and standards such as SCORM
& SCORM LOM [6], IMS & IMS DRI [7], AICC [8] and likewise were
proposed by different organizations. In Berner-Lee’s famous architecture for
Semantic Web, ontology’s are used for sharing and interoperability which
can be used to build better e-learning systems [9]. In order to define
components for e-learning systems the methodology used is the principle of
composibility in Service Oriented Architecture [10] since it enables us to
define the inter-relations between the different e-learning components. The
most popular model used nowadays in teaching learning process is Felder-
Silverman learning style model [11]. The e-Learning components are based
on key topics, topic types and associations and occurrences. VLE – Virtual
Learning Environment is the software which handles all the activities of
learning. Learning Objects are the learning materials which promotes a
conscious attempt to promote visual, verbal, logical and musical intelligence
[12] through presentations, tutorials, problem solving and projects. By the
multimedia, gaming and simulation kin aesthetic intelligence are promoted.
Interpersonal, intrapersonal and naturalistic intelligence are promoted by
means of chat, SMS, e-mail, forum, video, audio conference, survey, voting
and search. Finally assessment is used to test the knowledge acquired by the
learner and the repository is the place which will hold all the learning
materials.
This algorithm is useful when the learners access the learning objects which
are stored in the repository. It reduces the server’s response rate by the
directing a client to respond to the requestor with the file it has already
downloaded from the server.
1.2 Load Balancing
The emergence of large and faster networks with thousands of computers
connected to it provided a challenge to provide effective sharing of resource
around the computers in the network. Load balancing is a critical issue in
peer to peer network [14]. The existing load balancing algorithms for
heterogeneous, P2P networks are organized in a hierarchical fashion. Since
P2P have gained popularity it became mandatory to manage huge volume of
data to make sure that the response time is acceptable to the users. Due to
the requirement for the data from multiple clients at the same instance may
cause some of the peers to become bottleneck, and thereby creating severe
load imbalance and the response time to the user. So to reduce the
bottlenecks and the overhead of the server there was a need to harness the
computing power of the peers [15]. Much work has been done on harnessing](https://image.slidesharecdn.com/vol14no1-july2014-171208072343/85/Vol-14-No-1-July-2014-25-320.jpg)
![International Journal of Computer Science and Business Informatics
IJCSBI.ORG
ISSN: 1694-2108 | Vol. 14, No. 1. JUNE-JULY 2014 24
the computing power of the computer in the network in high performance
computing and scientific application, faster access to data and reducing the
computing time is still to be explored. In a P2P network the data is de-
clustered across the peers in the network. When there is requirement for a
popular data from across the peer then there occurs a bottleneck and
degrading the system response. So to handle this, a new strategy using a
new structure and an algorithm are proposed in this paper.
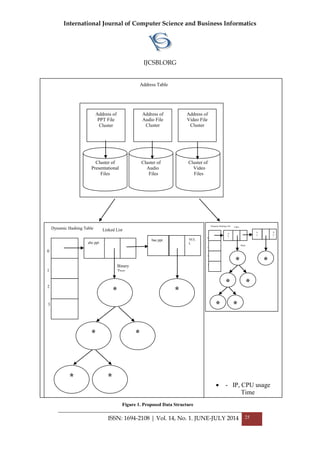
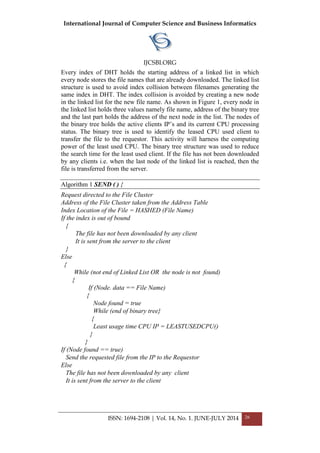
2. PROPOSED DATA STRUCTURE AND THE ALGORITHM
The objective of this architecture is to harness the computational power of
the clients in the network. This architecture is with respect to the clients
available in the e-learning network. The network comprises of Master
degree students of Computer Applications accessing learning materials for
their course. The degree programme is a three year programme. So the
clients are categorized to three different clusters namely I MCA, II MCA, III
MCA. We shall name it as class cluster. Every class cluster contains many
clusters inside it, let us name it as file clusters, one cluster for one type of
file since the learning objects can be made up of presentation, video, audio,
picture, animation etc [13]. An address table, named file address table holds
the address of each file cluster in the class cluster. When a request for a file
is received the corresponding cluster is identified by reading the address
from the address table. The following algorithm represents the working
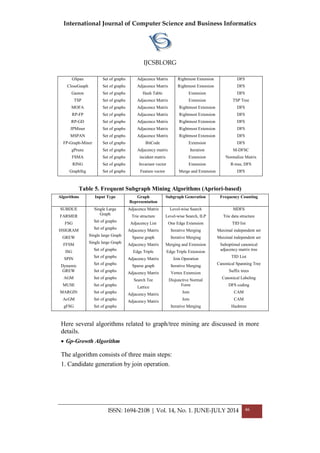
logic of the concept. The data structure is represented in Figure 1. Every file
cluster holds a Dynamic Hash Table (DHT), Linked List and a Binary Tree.
The dynamic hash table holds the address of the linked list which holds the
file names that are already downloaded from the server. The hashing
function used to identify an index in the DHT is as follows,
1. Represent every character in the filename with its position in the
alphabet list and its position in the filename.
Eg: File Name - abc.ppt = 112233, the value for a is got as 11 since
the position of it in the alphabet list is 1 and its position in the file
name is 1.
2. Sum all the digits calculated from step 1.
Eg: 112233 = 12
3. Divide the sum by length of the file name, so 12/3 = 4, which becomes
the index for the file in DHT. The above three steps are mathematical
formulated in equation 1.](https://image.slidesharecdn.com/vol14no1-july2014-171208072343/85/Vol-14-No-1-July-2014-26-320.jpg)

![International Journal of Computer Science and Business Informatics
IJCSBI.ORG
ISSN: 1694-2108 | Vol. 14, No. 1. JUNE-JULY 2014 29
REFERENCES
[1] Lavanya Rajendran, Ramachandran Veilumuthu., 2011. A Cost Effective Cloud
Service for E-Learning Video on Demand, European Journal of Scientific Research,
pp.569-579.
[2] Maria Dominic, Sagyaraj Francis, Philomenraj., 2013. A Study On Users On Moodle
Through Sarasin Model, International Journal Of Computer Engineering And
Technology, Volume 4, Issue 1, pp 71-79.
[3] Maria Dominic, Sagyaraj Francis., 2013. Assessment Of Popular E-Learning Systems
Via Felder-Silverman Model And A Comphrehensive E-Learning System,
International Journal Of Modern Education And Computer Science, Hong Kong,
Volume 5, Issue 11, pp 1-10.
[4] Zhang Guoli, Liu Wanjun, 2010. The Applied Research of Cloud Computing. Platform
Architecture in the E-Learning Area, IEEE.
[5] www.moodle.org
[6] SCORM(Sharable Courseware Object Reference Model), http://www.adlnet.org
[7] IMS Global Learning Consortium, Inc., “Instructional Management System (IMS)”,
http://www.imsglobal.org.
[8] http://www.aicc.org
[9] Uschold, Gruninger., 1996. Ontologies, Principles , Methods and Applications,
Knowledge Engineering Review, Volume 11, Issue 2.
[10]Papazoglou, Heuvel., 2007. Service Oriented Architectures: Approaches,
Technologies, and research issues, The VLDB Journal, , Volume 16, Issue 3, pp. 389-
415.
[11]Graf, Viola, Kinshuk., 2006. Representative Characterestics of Felder-Silverman
Learning Styles: an Empirical Model, IADIS, pp. 235-242.
[12]Lorna Uden, Ernesto Damiani., 2007. The Future of E-Learning: E-Learning
ecosystem, Proceeding of IEEE Conference on Digital ecosystems and Techniques,
Australia, pp. 113-117.
[13]Maria Dominic, Sagyaraj Francis., 2012. Mapping E-Learning System To Cloud
Computing, International Journal Of Engineering Research And Technology, India,
Volume1, Issue 6.
[14]Chyouhwa Chen, Kun-Cheng Tsai., 2008. The Server Reassignment Problem forload
Balancing In Structured P2P Systems, IEEE Transactions On Parallel And Distributed
Systems, Volume 19, Issue 2.
[15]A. Rao, K. Lakshminarayanan, S. Surana, R. Karp, and I. Stoica., 2006. Load
Balancing in Structured P2P Systems. Proc. Second Int’l Workshop Peer-to-Peer
Systems (IPTPS ’03).
This paper may be cited as:
Dominic, M. and Francis, S. 2014. Load Balancing using Peers in an E-
Learning Environment. International Journal of Computer Science and
Business Informatics, Vol. 14, No. 1., pp. 22 -29.](https://image.slidesharecdn.com/vol14no1-july2014-171208072343/85/Vol-14-No-1-July-2014-31-320.jpg)

![International Journal of Computer Science and Business Informatics
IJCSBI.ORG
ISSN: 1694-2108 | Vol. 14, No. 1. JUNE-JULY 2014 38
REFERENCES
[1] Badillo-Amador, L., García-Sánchez, A., & Vila, L. E. (2005). Mismatches In The Spanish
Labor Market: Education Vs. Competence Match. International Advances in Economic
Research, Vol 11, 93-109.
[2] Barua, A., Ravindran, S., & Whinston, A. (2007). Enabling Information Sharing Within
Organizations. Information Technology and Management, Vol (3), 31 - 45 .
[3] Cohen, J. (2012). Benefits Of On Job Training. Retrieved February 7, 2013, from
http://jobs.lovetoknow.com
[4] Drake, D., Steckler, N., & Koch, M. (2004). Information Sharing In And Across Government
Agencies: The Role And Influence Of Scientist, Politician, And Bureaucratic Subcultures.
Social Science Computer Research, 22(1), , 67–84.
[5] HAKIELIMU, LHRC, REPOA. (2005). Access To Information In Tanzania: Is Still A
Challenge. Retrieved September 11, 2012, from
http://www.tanzaniagateway.org/docs/Tanzania_Information_Access_Challenge.pdf
[6] Hatala, J.-P., & Lutta, J. (2009). Managing Information Sharing Within an Organisation
Settings: A social Network Perspective. Retrieved September 13, 2012, from
http://www.performancexpress.org/wp-content/uploads/2011/11/Managing-Information-
Sharing.pdf
[7] Im, B., & Jung, J. (2001). Using ICT For Strengthening Government Transparency. Retrieved
May 10, 2011, from http://www.oecd.org/dataoecd/53/55/2537402.pdf
[8] Kilama, J. (2013). Impacts Of Social Networks In Citizen Involvements To Politics . Dar es
Salaam: Mzumbe University.
[9] Mkapa, B. (2003). Improving Public Communication Of The Government Policies And
Enhancing Media Relations. Bagamoyo.
[10]Navarra, D. D. (2006). Governance Architecture Of Global ICT Programme: The Case Of
Jordan. London: London School of Economics and Political Science.
[11]United Republic of Tanzania. (1995). The Constitution of United Republic of Tanzania. Dar
Es Salaam, Tanzania: Government Printer.
[12]Van Niekerk, B., Pillay, K., & Maharaj, M. (2011). Analyzing the Role of ICTs in the
Tunisian and Egyptian Unrest. International Journal of Communication, 5(1406–1416).
This paper may be cited as:
Lubua, E. 2014. E-Transparency and Information Sharing in the Public Sector.
International Journal of Computer Science and Business Informatics, Vol. 14,
No. 1, pp. 30 -38.](https://image.slidesharecdn.com/vol14no1-july2014-171208072343/85/Vol-14-No-1-July-2014-40-320.jpg)
![International Journal of Computer Science and Business Informatics
IJCSBI.ORG
ISSN: 1694-2108 | Vol. 14, No. 1. JUNE-JULY 2014 39
A Survey of Frequent Subgraphs
and Subtree Mining Methods
Hamed Dinari and Hassan Naderi
Department of Computer Engineering
Iran University of Science and Technology
Tehran, Iran
ABSTRACT
A graph is a basic data structure which, can be used to model complex structures and the
relationships between them, such as XML documents, social networks, communication
networks, chemical informatics, biology networks, and structure of web pages. Frequent
subgraph pattern mining is one of the most important fields in graph mining. In light of
many applications for it, there are extensive researches in this area, such as analysis and
processing of XML documents, documents clustering and classification, images and video
indexing, graph indexing for graph querying, routing in computer networks, web links
analysis, drugs design, and carcinogenesis. Several frequent pattern mining algorithms have
been proposed in recent years and every day a new one is introduced. The fact that these
algorithms use various methods on different datasets, patterns mining types, graph and tree
representations, it is not easy to study them in terms of features and performance. This
paper presents a brief report of an intensive investigation of actual frequent subgraphs and
subtrees mining algorithms. The algorithms were also categorized based on different
features.
Keywords
Graph Mining, Subgraph, Frequent Pattern, Graph indexing.
1. INTRODUCTION
Today we are faced with ever-increasing volumes of data. Most of these
data naturally are of graph or tree structure. The process of extracting new
and useful knowledge from graph data is known as graph mining [1] [2]
Frequent subgraph patterns mining [3] is an important part of graph mining.
It is defined as “process of pattern extraction from a database that the
number frequency of which is greater than or equal to a threshold defined by
the user.” Due to its wide utilization in various fields, including social
network analysis [4] [5] [6], XML documents clustering and classification
[7] [8], network intrusion [9] [10], VLSI reverse [11], behavioral modeling
[12], semantic web [13], graph indexing [14] [15] [16] [17] [18], web logs
analysis[19], links analysis[20], drug design [21] [22] [23], and
Classification of chemical compounds[24] [25] [26], this field has been
subject matter of several works.](https://image.slidesharecdn.com/vol14no1-july2014-171208072343/85/Vol-14-No-1-July-2014-41-320.jpg)
![International Journal of Computer Science and Business Informatics
IJCSBI.ORG
ISSN: 1694-2108 | Vol. 14, No. 1. JUNE-JULY 2014 40
The present paper is an attempt to survey subtree and subgraph mining
algorithms. A comparison and classification of these algorithms, according
to their different features, is also made. The next section discusses the
literature review followed by section three that deals with the basic ideas
and concepts of graphs and trees. Mining algorithms, frequent subgraphs are
discussed in section four from different viewpoint such as criteria of
representing graphs (adjacency matrix and adjacency list), generation of
subgraphs, number of replications, pattern growth-based and apriori-based
classifications, classification based on search method, classification based
on transactional and single inputs, classification based on type of output,
and also Mining based on the logic. Fifth section focuses on frequent
Mining algorithm from different angles such as trees representation method,
type of algorithms input, tree-based Mining, and Mining based on
Constraints on outputs.
2. RELATED WORKS
H.J.Patel1, R.Prajapati,et al. [27] Classified graph mining and mentioned
two types of the algorithms, apriori-based and pattern growth based.
K.Lakshmi1,T.Meyyappan [28] studied apriori based and pattern growth
based, taking into account aspects such as input/output type, how to display
a graph, how to generate candidates, and how many times a candidates is
repeated in the graph dataset. In [29] D.Kavitha, B.V.Manikyala, et al.
suggested the third type of graph mining algorithms named as inductive
logic programming. Here a complete survey of graph mining concepts and a
very useful set of examples to ease the understanding of the concept come
next.
3. BASIC CONCEPTS
3.1 Garph
A graph G (V, E) is composed of a set of vertices (V) connected to each
other by and a set of edges (E).
3.2 Tree
A tree T is a connected graph that has no cycle. In other words, there is only
and only one path between any two vertices.
3.3 Subgraph
A subgraph G '(V', E') is a subgraph of G (V, E), which vertices and edges
are subsets of V and E respectively:
V’⊆V
⊆](https://image.slidesharecdn.com/vol14no1-july2014-171208072343/85/Vol-14-No-1-July-2014-42-320.jpg)

![International Journal of Computer Science and Business Informatics
IJCSBI.ORG
ISSN: 1694-2108 | Vol. 14, No. 1. JUNE-JULY 2014 43
length of k. However, in this method, all state of candidate subgraph
generated is considered .Maintenance and processing need plenty of time
and memory, which tackles the performance [30] [2].
5.1.2 Pattern Growth-Based
In FP-growth-based methods a candidate subgraph with length of k+1 is
obtained by extending a frequent pattern with length of k. Since extending a
frequent subgraph with length of k may generate several candidate of length
k+1, thus the way a frequent subgraph is expanded is critical in reducing
generation of copied subgraphs.Table1 lists apriori and pattern growth
algorithms [2].
Table 1. Frequent Subgraph Mining Algorithms
AprioriPattern Growth
FARMER [31]
FSG [3]
HSIGRAM
GREW [32]
FFSM [4]
ISG
SPIN [33]
Dynamic GREW [34]
AGM [35]
MUSE [36]
SUBDUE [37]
AcGM [38]
DPMine
gFSG [39]
MARGIN [40]
GSPan [41]
CloseGraph [42]
Gaston [43]
TSP [44]
MOFa [45]
RP-FP [46]
RP-GD [46]
JPMiner [47]
MSPAN
VSIGRAM [48]
FPF [49]
Gapprox [50]
HybridGMiner
FCPMiner [51]
RING [52]
SCMiner [53]
GraphSig [54]
FP-GraphMiner [55]
gPrune [56]
CLOSECUT [57]
FSMA [58]
5.2 Classification Based on Search Strategy
There are two search strategies to find frequent subgraphs. These two
methods include breadth first search (BFS) and depth first search (DFS).
5.3 Classification Based on Nature of the Input
Depending on input type of algorithms, here tried to be divided two
categories presented as following:](https://image.slidesharecdn.com/vol14no1-july2014-171208072343/85/Vol-14-No-1-July-2014-45-320.jpg)
![International Journal of Computer Science and Business Informatics
IJCSBI.ORG
ISSN: 1694-2108 | Vol. 14, No. 1. JUNE-JULY 2014 44
5.3.1 Single Graph Database
Database consists of a single large graph
5.3.2 Transactional Graph Database
Database consists of a large number of small graphs. Figure.3 shows a
database consist of a set of graphs and two subgraphs and their frequency.
In Figure.3 (left side, g, g2, and g2) demonstrates a transactional graph
database and frequency of two frequent subgraphs (right side).
Figure.3. A database consisting of three graph g1, g2, g3 and two subgraph
and frequency of each
5.4 Classification Based on Nature of the Output
5.4.1 Completeness of the Output
While, some algorithms find all frequent patterns, some other only mines
part of frequent patterns. Frequent patterns mining is closely related to
performance. When the total size of dataset is too high, it is better to use
algorithms that are faster in execution so that reduction of the performance
is avoided, although, not all frequent patterns are minded. Table 2 lists the
completeness of output [29].
Table 2. Completeness of Output
Complete OutputIncomplete Output
FARMER
gSpan
FFSM
Gaston
FSG
HSIGRAM
SUBDUE
GREW
CloseGraph
ISG
5.4.2 Constraint-Based
With increase of size database, the number of frequent pattern is increased.
This makes maintenance and analyzing more difficult as it needs more
memory space. Reducing the number of frequent patterns without losing the
data is achievable through mining and maintains more comprehensive
patterns. Given that each pattern satisfies the condition of being frequent the](https://image.slidesharecdn.com/vol14no1-july2014-171208072343/85/Vol-14-No-1-July-2014-46-320.jpg)
![International Journal of Computer Science and Business Informatics
IJCSBI.ORG
ISSN: 1694-2108 | Vol. 14, No. 1. JUNE-JULY 2014 45
whole subset satisfies the condition, to achieve more comprehend patterns
we can use the following terms:
5.4.2.1 Maximal Pattern
Subgraph g1 is maximal pattern if the pattern is frequent and does not
consist of any super-pattern, so that g2 با g2⊃g1.
5.4.2.2 Closed Pattern
Subgraph g1 is closed if it is frequent and does not consist of any frequent
super-pattern such as g2, g2⊃g1 (i.e. support).Table3 lists maximal and
closed subgraph algorithms.
Table 3. Frequent Subgraph Mining (Constraintd)
MaximalClosed
SPIN
MARGIN
ISG
GREW
CloseGraph
CLOSECUT
TSP
RP-FP
RP-GD
5.5 Logic-Based Mining
Also known as inductive logic programming, which also an area of machine
learning, mainly in biology. This method uses inductive logic to display
structured data. ILP core uses the logic to display for search and the basic
assumptions of that structured way (e.g. WARMR, FOIL, and C-PROGOL),
which is derived from background knowledge [29]. Table 4 lists the Pattern
Growth and Table 5 indicates apriori-based algorithms categorized from
different aspects [59] [27] [60] [61] [62] [28] [30] [63].
Table 4. Frequent Subgraph Mining Algorithms (Pattern Growth-based)
Frequency
Counting
Subgraph
Generation
Graph
Representation
Input TypeAlgorithms](https://image.slidesharecdn.com/vol14no1-july2014-171208072343/85/Vol-14-No-1-July-2014-47-320.jpg)
![International Journal of Computer Science and Business Informatics
IJCSBI.ORG
ISSN: 1694-2108 | Vol. 14, No. 1. JUNE-JULY 2014 47
2. Using a new method for tree representation and look up table that allows
quick access to the information nodes in the candidate generation phase
without having to read the trees of the database.
3. using right most expansion to candidate generation that guaranteed not
generate duplicate candidate.
This algorithm uses lookup table that is implemented as Hash table to store
input trees information. It is the key part, represented as the pair of (T,pos),
where T is identification of input tree and pos is number in preorder
traversal, and value part, represented as (l,s), where l is label and s is scope
of node. In this algorithm a new candidate is generated using scope of each
node That means, first node, which is added to the other node should be
added along the right most expansion and that within the scope of the first
node to be added continually this process other frequent pattern is found
[64].
Fp-Graph Miner Algorithm
This algorithm uses FP-growth method to find frequent subgraphs, Its input
is a set of graphs (Transactional database). First a BitCode for each edge is
defined, then a set of edge is defined for each edge .When, edge is found in
the each of graphs, the BitCode is ‘1’ and otherwise ‘0’. Then a frequency
table is sorted in ascending order based on equivalent BitCode belongs to
each edge and afterward, FP tree is constructed and frequent subgraphs are
obtained through depth traversal [55].
6. FREQUENT SUBTREES MINING ALGORITHMS
CLASSIFICATION
6.1 Trees Representation
A tree can be encoded as a sequence of nodes and edges. Some of most
important ways of encoding trees are introduced below:
6.1.1 DLS (Depth Label Sequence)
Let T be a Labeled Ordered Tree and depth-label pairs including labels and
depth for each node are belonged to V. For example, (d(vi),l(vi)) are added
to string s throughout DFS traversal of tree T. Depth-label sequence of tree
T is obtained as { d(v1), l(v1)), …,(d(vk), l(vk) }. For instance, DLS for tree
in Figure.4 can be presented as follow:
{(0,a),(1,b),(2,e),(3,a),(1,c),(2,f),(3,b),(3,d),(2,a),(1,d),(2,f)(3,c)}
6.1.2 DFS – LS (Depth First Sequence)-(Label Sequence)
Assumed a labeled ordered tree, Labels is added to string of s
during the DFS traversal of Tree T. During backtrack ‘-1’or‘$’or ‘/’ is added](https://image.slidesharecdn.com/vol14no1-july2014-171208072343/85/Vol-14-No-1-July-2014-49-320.jpg)
![International Journal of Computer Science and Business Informatics
IJCSBI.ORG
ISSN: 1694-2108 | Vol. 14, No. 1. JUNE-JULY 2014 48
to the string, DFS-LS code for tree T is illustrated in in Figure.4
{abea$$$cfb$d$$a$$dfc$$$}
6.1.3 BFCS (Breadth First Canonical String)
Let T be an unordered tree. Several sequence encoded string can be
generated using the BFS method and through changing the order of children
of a node. Thus, one may say that BFCS tree T equals to the smallest
lexicographic order of this encoded string. BFCS of tree T is showed in
Figure.4. {a$bcd$e$fa$f$a$bd$$c#}
6.1.4 CPS (Consolidate Prufer Sequence)
Let T be a labeled tree T, and CPS encoding method consists of two parts:
NPS as extended prufer sequence, which uses vertex numbers traversal as
set of unique label is obtained; an d LS (Label Sequence) as a sequence
consisting of labels in prefix traversal after the leafs is removed is achieved.
Both NPS and LS generate a unique encoding for labeled tree. NPS and LS
obtained for the tree presented in Figure.4 is as follow respectively:
{ebaffccafda-}, {aebbdfaccfda}. To obtain NPS, a leaf from the tree is
removed in each step and the parent of the leaf is taken get as output. This is
repeated until only the roots remain and ‘-’ is added to note as the end of the
string. Regarding LS (Label Sequence) the same postfix traversal of the tree
is taken as LS. Table9 remarks this category of trees [65].
Figure.4. A Tree Example](https://image.slidesharecdn.com/vol14no1-july2014-171208072343/85/Vol-14-No-1-July-2014-50-320.jpg)
![International Journal of Computer Science and Business Informatics
IJCSBI.ORG
ISSN: 1694-2108 | Vol. 14, No. 1. JUNE-JULY 2014 49
Table 6. Frequent subtree Mining Algorithms (Tree Representation)
Tree RepresentationAlgorithms
DLS
DFS-LS
DLS
FST-Forest
BFCS
DLS
DFS-LS
DLS
DLS
DFS string
DFS-LS
CPS
BFCS
DFS-LS
BFCS
DFS-LS
uFreqt
SLEUTH
Unot
Path Join
RootedTreeMiner [66]
FREQT
TreeMiner
Chopper
XSPanner
AMIOT
IMB3Miner
TRIPS
FreeTreeMiner
CMTreeMiner
HybridTreeMiner [67]
GP-Growth
6.2 Input Types
6.2.1 Rooted Ordered Trees
Rooted Ordered sub-tree is a kind of tree in which a single node is considered
as the “root” of the tree and there is a relationship between children of each
node so that each child is greater than or equal to its siblings that are placed at
the left hand side of it; moreover it is less than or equal to ones that are
placed at its right hand side. If we elate or definition of rooted ordered tree
such that there was no need to consider the relationship between siblings we
have a rooted unordered sub-tree.in Table7 rooted ordered tree mining
algorithms is shown.
Table 7. Rooted Ordered Tree mining Algorithms
InducedEmbedded
FREQT [68]
AMIOT [69]
IMB3Miner [70]
TRIPES [65]
TIDES [65]
TreeMiner [71]
Chopper [72]
XSPanner [72]
IMB3-Miner
6.2.2 Rooted Unordered Trees
In this type of trees, a node is considered as the root, however, there is no
particular order between the descendants of each node,In Table 8 rooted
unordered tree mining algorithms is listed.](https://image.slidesharecdn.com/vol14no1-july2014-171208072343/85/Vol-14-No-1-July-2014-51-320.jpg)
![International Journal of Computer Science and Business Informatics
IJCSBI.ORG
ISSN: 1694-2108 | Vol. 14, No. 1. JUNE-JULY 2014 50
Table 8. Rooted unordered Tree mining Algorithms
InducedEmbedded
uFreqT [73]
Unot [74]
PathJoin [65]
Rooted TreeMiner [75]
TreeFinder [76]
TreeFinder
Cousin Pair [77]
SLEUTH [78]
6.3 Tree Base Data Mining
Frequent subtrees mining algorithm can be categorized into two major
categories, aprior-based and pattern growth-based. Table 9 lists the apriori
and pattern growth algorithms of trees [79] [76] [80].
Table 9. Frequent Subtree Mining Algorithms
7. CONCLUSIONS AND FUTURE WORKS
Frequent subgraph Mining algorithms were first examined from different
viewpoints such as different ways of representing a graph (e.g. adjacency
matrix and adjacency list), generation of subgraphs, frequency counting,
pattern growth-based and apriori-based algorithm classification, search
based classification, input-based classification (single, transactional), output
based classification. Furthermore, Mining based on logic was discussed.
Afterward, frequent subtrees traversal algorithms were examined from
different viewpoints such as trees representation methods, type of inputs,
tree-based traversal, and also Mining based on Constraints of outputs. Given
the results, it is concluded that in absence of generating patterns by pattern-
AprioriPattern Growth
TreeFinder
AMIOT
FreeTreeMiner
TreeMine [81]
SLEUTH
CMTreeMiner [82]
Pattern Matcher [71]
W3Miner [83]
FTMiner [84]
CFFTree [85]
IMB3-Miner
uFreqt
Unot
FREQT
TRIPS
TIDES
Path Join
XSPanner
Chopper
PrefixTreeISpan [86]
PCITMiner [87]
F3TM [88]
GP-Growth [64]](https://image.slidesharecdn.com/vol14no1-july2014-171208072343/85/Vol-14-No-1-July-2014-52-320.jpg)
![International Journal of Computer Science and Business Informatics
IJCSBI.ORG
ISSN: 1694-2108 | Vol. 14, No. 1. JUNE-JULY 2014 51
growth, it is featured with less computation work and needs smaller memory
size. Moreover, these algorithms are specifically designed for trees and
graphs and cannot be used for other purposes. On the other hand, as they
work on variety of datasets, it is not easy to find tradeoffs between them.
The same frequent patterns can be used for searching similarity, indexing,
classifying graphs and documents in future studies. Parallel methods and
technologies such as Hadoop can also be needed when working with
excessive data volume.
8. ACKNOWLEDGMENTS
Authors are thankful to Mohammad Reza Abbasifard for their support of the
investigations.
REFERENCES
[1] A.Rajaraman, J.D.Ullman, 2012. Mining of Massive Datasets, 2nd ed.
[2] J.Han, M.Kamber, 2006, Data Mining Concepts and Techniques. USA: Diane
Cerra.
[3] Kuramochi, Michihiro, and G.Karypis., 2004. An efficient algorithm for
discovering frequent subgraphs, in IEEE Transactions on Knowledge and
Data Engineering, pp. 1038-1051.
[4] J.Huan, W.Wang, J. Prins, 2003. Efficient Mining of Frequent Subgraph in the
presence of isomorphism, in Third IEEE International Conference on Data
Minign (ICDM).
[5] (2013, Dec.) Trust Network Datasets - TrustLet. [Online].
http://www.trustlet.org
[6] L.YAN, J.WANG, 2011. Extracting regular behaviors from social media
networks, in Third International Conference on Multimedia Information
Networking and Security.
[7] Ivancsy,I. Renata, I.Vajk., 2009. Clustering XML documents using frequent
subtrees, Advances in Focused Retrieval, Vol. 3, pp. 436-445.
[8] J.Yuan, X.Li, L.Ma, 2008. An Improved XML Document Clustering Using
Path Features, in Fifth International Conference on Fuzzy Systems and
knowledge Discovery, Vol. 2.
[9] Lee, Wenke, and Salvatore J. Stolfo, 2000. A framework for constructing
features and models for intrusion detection systems, in ACM transactions on
Information and system security (TiSSEC), pp. 227-261.
[10] Ko, C, Logic induction of valid behavior specifications for intrusion detection
, 2000. in In IEEE Symposium on Security and Privacy (S&P), pp. 142–155.](https://image.slidesharecdn.com/vol14no1-july2014-171208072343/85/Vol-14-No-1-July-2014-53-320.jpg)
![International Journal of Computer Science and Business Informatics
IJCSBI.ORG
ISSN: 1694-2108 | Vol. 14, No. 1. JUNE-JULY 2014 52
[11] Yoshida, K. and Motoda, 1995. CLIP: Concept learning from inference
patterns, in Artificial Intelligence, pp. 63–92.
[12] Wasserman, S., Faust, K., and Iacobucci. D, 1994. Social network analysis :
Methods and applications. Cambridge university Press.
[13] Berendt, B., Hotho, A., and Stumme, G., 2002. semantic web mining, in In
Conference International Semantic Web (ISWC), pp. 264–278.
[14] S.C.Manekar, M.Narnaware, May 2013. Indexing Frequent Subgraphs in
Large graph Database using Parallelization, International Journal of Science
and Research (IJSR), Vol. 2 , No. 5.
[15] Peng, Tao, et al., 2010. A Graph Indexing Approach for Content-Based
Recommendation System, in IEEE Second International Conference on
Multimedia and Information Technology (MMIT), pp. 93-97.
[16] S.Sakr, E.Pardede, 2011. Graph Data Management: Techniques and
Applications, in Published in the United States of America by Information
Science Reference.
[17] Y.Xiaogang, T.Ye, P.Tao, C.Canfeng, M.Jian, 2010. Semantic-Based Graph
Index for Mobile Photo Search," in Second International Workshop on
Education Technology and Computer Science, pp. 193-197.
[18] Yildirim, Hilmi, and Mohammed Javeed Zaki., 2010. Graph indexing for
reachability queries, in 26th International Conference on Data Engineering
Workshops (ICDEW)IEEE, pp. 321-324.
[19] R.Ivancsy and I.Vajk, 2006. Frequent Pattern Mining in Web Log Data, in
Acta Polytechnica Hungarica, pp. 77-90.
[20] G.XU, Y.zhang, L.li, 2010. Web mining and Social Networking. melbourn:
Springer.
[21] S.Ranu, A.K. Singh, 2010. Indexing and mining topological patterns for drug,
in ACM, Data mining and knowlodge discovery, Berlin, Germany.
[22] (2013, Dec.) Drug Information Portal. [Online]. http://druginfo.nlm.nih.gov
[23] (2013, Dec.) DrugBank. [Online]. http://www.drugbank.ca
[24] Dehaspe,Toivonen, and King, R.D., 1998. Finding frequent substructures in
chemical compounds, in In Proc. of the 4th ACM International Conference on
Knowledge Discovery and Data Mining, pp.30-36.
[25] Kramer, S., De Raedt, L., and Helma, C., 2001. Molecular feature mining in
HIV data, in In Proc. of the 7th ACM SIGKDD International Conference on
Knowledge Discovery and Data Mining (KDD-01), pp. 136–143.
[26] Gonzalez, J., Holder, L.B. and Cook, 2001. Application of graph-based
concept learning to the predictive toxicology domain, in In Proc. of the](https://image.slidesharecdn.com/vol14no1-july2014-171208072343/85/Vol-14-No-1-July-2014-54-320.jpg)
![International Journal of Computer Science and Business Informatics
IJCSBI.ORG
ISSN: 1694-2108 | Vol. 14, No. 1. JUNE-JULY 2014 53
Predictive Toxicology Challenge Workshop.
[27] H.J.Patel, R.Prajapati, M.Panchal, M.Patel, Jan. 2013. A Survey of Graph
Pattern Mining Algorithm and Techniques, International Journal of
Application or Innovation in Engineering & Management (IJAIEM), Vol. 2,
No. 1.
[28] K.Lakshmi, T. Meyyappan, 2012. FREQUENT SUBGRAPH MINING
ALGORITHMS - A SURVEY AND FRAMEWORK FOR
CLASSIFICATION, computer science and information technology, pp. 189–
202.
[29] D.Kavitha, B.V.Manikyala Rao and V. Kishore Babu, 2011. A Survey on
Assorted Approaches to Graph Data Mining, in International Journal of
Computer Applications, pp. 43-46.
[30] C.C.Aggarwal,Wang, Haixun, 2010. Managing and Mining Graph Data.
Springer,.
[31] B.Wackersreuther, Bianca, et al. , 2010. Frequent subgraph discovery in
dynamic networks, in ACM, Proceedings of the Eighth Workshop on Mining
and Learning with Graphs, Washington DC USA, pp. 155-162.
[32] Kuramochi, Michihiro, and G.Karypis, 2004. Grew-a scalable frequent
subgraph discovery algorithm, in Fourth IEEE International Conference on
Data Mining (ICDM), pp. 439-442.
[33] Huan, Jun, SPIN: mining maximal frequent subgraphs from graph databases,
2004. in Proceedings of the tenth ACM SIGKDD international conference on
Knowledge discovery and data mining.
[34] Borgwardt, Karsten M., H-P. Kriegel, and P.Wackersreuther, 2006. Pattern
mining in frequent dynamic subgraphs, in Sixth International Conference on
Data Mining (ICDM), pp. 818-822.
[35] Inokuchi, Akihiro, T.Washio, and H.Motoda, 2000. An apriori-based
algorithm for mining frequent substructures from graph data, in Principles of
Data Mining and Knowledge Discovery, pp. 13-23, Springer Berlin
Heidelberg.
[36] Zou, Zhaonian, et al, 2009. Frequent subgraph pattern mining on uncertain
graph data, in Proceedings of the 18th ACM conference on Information and
knowledge management, pp. 583-592.
[37] Ketkar, N.S, Lawrence B.Holder, and D.J.Cook, 2005. Subdue: compression-
based frequent pattern discovery in graph data, in ACM, Proceedings of the
1st international workshop on open source data mining: frequent pattern
mining implementations, pp. 71-76.
[38] A. Inokuchi, T. Washio, and H. Motoda, 2003. Complete mining of frequent
patterns from graphs: Mining graph data, in Machine Learning, pp. 321-354.](https://image.slidesharecdn.com/vol14no1-july2014-171208072343/85/Vol-14-No-1-July-2014-55-320.jpg)
![International Journal of Computer Science and Business Informatics
IJCSBI.ORG
ISSN: 1694-2108 | Vol. 14, No. 1. JUNE-JULY 2014 54
[39] Kuramochi, Michihiro, and G.Karypis, 2007. Discovering frequent geometric
subgraphs, in Information Systems, pp. 1101-1120.
[40] Thomas, Lini T, Satyanarayana R. Valluri, and K.Karlapalem, 2006. Margin:
Maximal frequent subgraph mining, in IEEE Sixth International Conference
on Data Mining (ICDM), pp. 1097-1101.
[41] Yan, Xifeng, and J.Han, 2002. gspan: Graph-based substructure pattern
mining, in Proceedings International Conference on Data Mining.IEEE, pp.
721-724.
[42] Yan, Xifeng, and Jiawei Han, 2003. CloseGraph: mining closed frequent
graph patterns, in Proceedings of the ninth ACM SIGKDD international
conference on Knowledge discovery and data mining, pp. 286-295.
[43] Nijssen, Siegfried, and J.N. Kok., 2005. The gaston tool for frequent subgraph
mining, in Electronic Notes in Theoretical Computer Science, pp. 77-87.
[44] Hsieh, Hsun-Ping, and Cheng-Te Li, 2010. Mining temporal subgraph patterns
in heterogeneous information networks, in IEEE Second International
Conference on Social Computing (SocialCom), pp. 282-287.
[45] Wörlein, Marc, et al, 2005. A quantitative comparison of the subgraph miners
MoFa, gSpan, FFSM, and Gaston, in Knowledge Discovery in Databases:
PKDD , Springer Berlin Heidelberg, pp. 392-403.
[46] S.J.Suryawanshi,S.M.Kamalapur, Mar 2013. Algorithms for Frequent
Subgraph Mining, International Journal of Advanced Research in Computer
and Communication Engineering, Vol. 2, No. 3.
[47] Liu, Yong, Jianzhong Li, and Hong Gao, 2009. JPMiner: mining frequent
jump patterns from graph databases, in IEEE, Sixth International Conference
on Fuzzy Systems and Knowledge Discovery, pp. 114-118.
[48] Reinhardt, Steve, and G.Karypis, 2007. A multi-level parallel implementation
of a program for finding frequent patterns in a large sparse graph, in IEEE
International Parallel and Distributed Processing Symposium (IPDPS), pp. 1-
8.
[49] Schreiber, Falk, and H.Schwobbermeyer., 2005. Frequency concepts and
pattern detection for the analysis of motifs in networks, in Transactions on
computational systems biology III, pp. 89-104, Springer Berlin Heidelberg.
[50] Chent, Chen, et al., 2007. gapprox: Mining frequent approximate patterns
from a massive network, in Seventh IEEE International Conference on Data
Mining (ICDM), pp. 445-450.
[51] Ke, Yiping, J.Cheng, and Jeffrey Xu Yu, 2009. Efficient discovery of frequent
correlated subgraph pairs, in Ninth IEEE International Conference on Data
Mining (ICDM), pp. 239-248.](https://image.slidesharecdn.com/vol14no1-july2014-171208072343/85/Vol-14-No-1-July-2014-56-320.jpg)
![International Journal of Computer Science and Business Informatics
IJCSBI.ORG
ISSN: 1694-2108 | Vol. 14, No. 1. JUNE-JULY 2014 55
[52] Zhang, Shijie, J.Yang, and Shirong Li, 2009. Ring: An integrated method for
frequent representative subgraph mining, in Ninth IEEE International
Conference on Data Mining (ICDM), pp. 1082-1087.
[53] Fromont, Elisa, Céline Robardet, and A.Prado, 2009. Constraint-based
subspace clustering, in International conference on data mining, pp. 26-37.
[54] Ranu, Sayan, and Ambuj K. Singh., 2009. Graphsig: A scalable approach to
mining significant subgraphs in large graph databases, in IEEE 25th
International Conference on Data Engineering (ICDE), pp. 844-855.
[55] R. Vijayalakshmi,R. Nadarajan, J.F.Roddick,M. Thilaga, 2011. FP-
GraphMiner, A Fast Frequent Pattern Mining Algorithm for Network Graphs,
Journal of Graph Algorithms and Applications, Vol. 15, pp. 753-776.
[56] Zhu, Feida, et al., 2007. gPrune: a constraint pushing framework for graph
pattern mining, in Advances in Knowledge Discovery and Data Mining, , pp.
388-400, Springer Berlin Heidelberg.
[57] Yan, Xifeng, X. Zhou, and Jiawei Han, 2005. Mining closed relational graphs
with connectivity constraints, in Proceedings of the eleventh ACM SIGKDD
international conference on Knowledge discovery in data mining, pp. 324-
333.
[58] Wu, Jia, and Ling Chen, 2008. A fast frequent subgraph mining algorithm, in
The 9th International Conference for Young Computer Scientists (ICYCS), pp.
82-87.
[59] Krishna, Varun, N. N. R. R. Suri, G. Athithan, 2011. A comparative survey of
algorithms for frequent subgraph discovery, Current Science(Bangalore), pp.
1980-1988.
[60] K.Lakshmi, T. Meyyappan, Apr. 2012. A COMPARATIVE STUDY OF
FREQUENT SUBGRAPH MINING ALGORITHMS, International Journal
of Information Technology Convergence and Services (IJITCS), Vol. 2, No. 2.
[61] C.Jiang, F.Coenen, M.Zito, 2004. A Survey of Frequent Subgraph Mining
Algorithms, The Knowledge Engineering Review, pp. 1-31.
[62] M.Gholami, A.Salajegheh, Sep. 2012. A Survey on Algorithms of Mining
Frequent Subgraphs, International Journal of Engineering Inventions, Vol. 1,
No. 5, pp. 60-63.
[63] V.Singh, D.Garg, Jul. 2011. Survey of Finding Frequent Patterns in Graph
Mining: Algorithms and Techniques, International Journal of Soft Computing
and Engineering (IJSCE), Vol. 1, No. 3.
[64] Hussein, M.MA, T. H.Soliman, O.H. Karam, 2007. GP-Growth: A New
Algorithm for Mining Frequent Embedded Subtrees. 12th IEEE Symposium on
Computers and Communications.](https://image.slidesharecdn.com/vol14no1-july2014-171208072343/85/Vol-14-No-1-July-2014-57-320.jpg)
![International Journal of Computer Science and Business Informatics
IJCSBI.ORG
ISSN: 1694-2108 | Vol. 14, No. 1. JUNE-JULY 2014 56
[65] Tatikonda, Shirish, S.Parthasarathy,T.Kurc., 2006. TRIPS and TIDES: new
algorithms for tree mining, in Proceedings of the 15th ACM international
conference on Information and knowledge management.
[66] Tung, Jiun-Hung, 2006. MINT: Mining Frequent Rooted Induced Unordered
Tree without Candidate Generation.
[67] Chi, Yun, Y.Yang, and Richard R. Muntz., 2004. HybridTreeMiner: An
efficient algorithm for mining frequent rooted trees and free trees using
canonical forms, in Proceedings 16th International Conference on Scientific
and Statistical Database Management.
[68] T.Asai, H.Arimura, T.Uno, S.Nakano and K.Satoh, 2008. Efficient tree
mining using reverse search.
[69] S.Hido, and H. Kawano., 2005. AMIOT: Induced Ordered Tree Mining in
Tree-structured Databases, in Proceedings of the Fifth IEEE International
Conference on Data Mining (ICDM’05).
[70] H.Tan, T.S. Dillon, F.Hadzic, E.Chang, and L.Feng, 2006. IMB3-Miner:
Mining Induced/Embedded Subtrees by Constraining the Level of Embedding,
in Advances in Knowledge Discovery and Data Mining, Springer Berlin
Heidelberg, pp. 450–461.
[71] M.J.Zaki, 2002. Efficiently mining frequent trees in a forest, in In Proceedings
of the 8th International Conference on Knowledge Discovery and Data
Mining (ACM SIGKDD), pp. 71-80.
[72] C.Wang, M.Hong, J.Pei, H.Zhou, W.Wang, 2004. Efficient pattern-growth
methods for frequent tree pattern mining, in Advances in Knowledge
Discovery and Data Mining, Springer Berlin Heidelberg, pp. 441-451.
[73] S.Nijssen and J.N.Kok, 2003. Efficient Discovery of Frequent Unordered
Trees, in Proc. First Intl Workshop on Mining Graphs Trees and Sequences,
pp. 55-64.
[74] T. Asai, H. Arimura, T.Uno and S. Nakano., 2003. Discovering Frequent
Substructures in Large Unordered Trees, in procceding sixth conference on
Discovery Science, pp. 47-61.
[75] Y.Chi, Y.Yang, and R. Muntz., May 2004. Canonical Forms for Labeled
Trees and Their Applications in Frequent Subtree Mining, Knowledge and
Information Systems, No. 8.2, pp. 203-234.
[76] Chi, Yun, et al.,2005. Frequent subtree mining-an overview, in Fundamenta
Informaticae, pp. 161-198.
[77] Shasha, Dennis, J.Tsong-Li Wang and Sen Zhang.,2004. Unordered tree
mining with applications to phylogeny, in IEEE Proceedings 20th
International Conference on Data Engineering, pp. 708-719.](https://image.slidesharecdn.com/vol14no1-july2014-171208072343/85/Vol-14-No-1-July-2014-58-320.jpg)
![International Journal of Computer Science and Business Informatics
IJCSBI.ORG
ISSN: 1694-2108 | Vol. 14, No. 1. JUNE-JULY 2014 57
[78] M.J.Zaki., 2005. Efficiently Mining Frequent Embedded Unordered Trees, in
IOS Press, pp. 1-20.
[79] Jimenez, Aida, F.Berzal,J.Cubero.,2008. Mining induced and embedded
subtrees in ordered, unordered, and partially-ordered trees, in EEE
Transactions on Knowledge and Data Engineering, Springer Berlin
Heidelberg, pp. 111-120.
[80] Jimenez, Aida,F. Berzal Juan-Carlos Cubero.,2006. Mining Different Kinds of
Trees: A Tree Mining Overview, in Data Mining.
[81] B.Bringmann.,2004. Matching in Frequent Tree Discovery, in Fourth IEEE
International Conference on Data Mining.
[82] Chi, Yun, et al. Mining.,2004. Cmtreeminer: Mining both closed and maximal
frequent subtrees, in Advances in Knowledge Discovery and Data , Springer
Berlin Heidelberg, pp. 63-73.
[83] AliMohammadzadeh, Rahman, et al., Aug 2006. Complete Discovery of
Weighted Frequent Subtrees in Tree-Structured Datasets, International
Journal of Computer Science and Network Security (IJCSNS ), Vol. 6, No. 8,
pp. 188-196.
[84] J.HU, X.Y.LI., Mar 2009. Association Rules Mining Including Weak-Support
Modes Using Novel Measures," WSEAS Transactions on Computers, Vol. 8,
No. 3, pp. 559-568.
[85] Zhao, Peixiang, and J.X.Yu.,2007. Mining closed frequent free trees in graph
databases, in Advances in Databases: Concepts, Systems and Applications,
Springer Berlin Heidelberg, pp. 91-102.
[86] Zou, Lei, et al.,2006. PrefixTreeESpan: A pattern growth algorithm for mining
embedded subtrees, in Web Information Systems (WISE), Springer Berlin
Heidelberg, pp. 499-505.
[87] Kutty, Sangeetha, R.Nayak, Y.Li., 2007. PCITMiner: prefix-based closed
induced tree miner for finding closed induced frequent subtrees, in
Proceedings of the sixth Australasian conference on Data mining and
analytics, Vol. 70, Australian Computer Society.
[88] Zhao, Peixiang, and J.X.Yu., 2008. Fast frequent free tree mining in graph
databases, in Springer World Wide Web, Hong Kong, pp. 71-92.
This paper may be cited as:
Dinari, H. and Naderi, H. 2014. A Survey of Frequent Subgraphs and
Subtree Mining Methods. International Journal of Computer Science and
Business Informatics. Vol. 14, No. 1, pp. 39-57.](https://image.slidesharecdn.com/vol14no1-july2014-171208072343/85/Vol-14-No-1-July-2014-59-320.jpg)
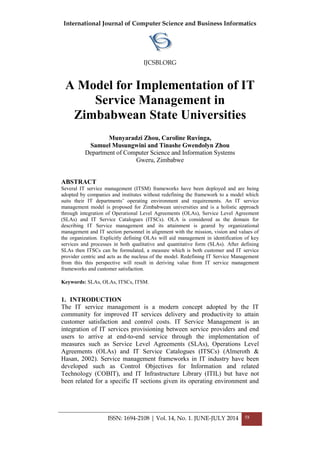
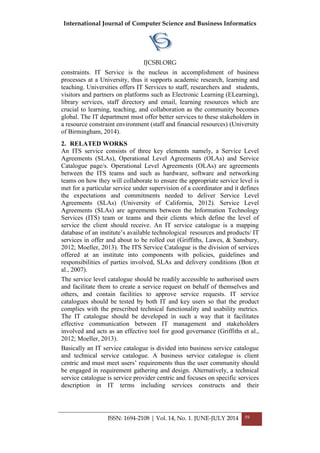

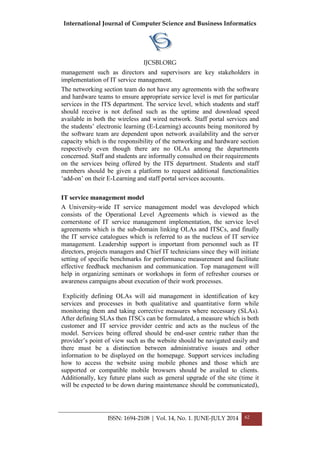
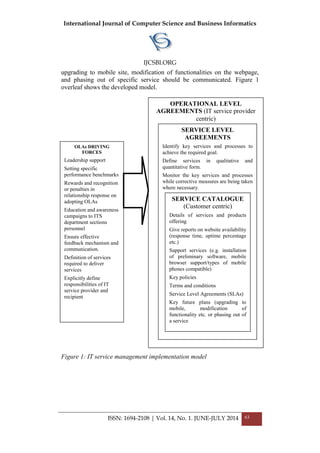
![International Journal of Computer Science and Business Informatics
IJCSBI.ORG
ISSN: 1694-2108 | Vol. 14, No. 1. JUNE-JULY 2014 64
6. CONCLUSIONS
An enabling collaborative approach to quality improvement should be
explored by the ITS teams while involving their clients (staff and students)
so that their needs are satisfied. In achieving ITSM, goals must be
benchmarked and reviewed by the monitoring and evaluation committee
being steered by the project manager. The committee must ensure
availability of human and financial resources for example through lobbying
top management support and training of employees. In addition, the
committee should facilitate a cyclical communication system with
stakeholders and top management so as to ensure their support and
commitment even during the review process. The institutional goals, vision
and mission should be aligned with ITSM strategy adopted. A service
catalogue which acts as a blue-print to clients in understanding and making
an informed decision about the services they use or intends to use must
always be availed to clients, and also it acts as a benchmark for quality
assurance on services the ITS department offers to clients.
OLA between IT service provider and a procurement department or other
departments to obtain hardware or other resources in agreed times and
between a service desk and a support group to provide incident resolution in
agreed times should be defined to ensure appropriate service level is met
(Rudd, 2010). Adoption of OLAs will result in better service delivery and
management of duties and responsibilities. Universities must integrate
various IT teams within departments across the various campuses while
explicitly defining implementation of SLAs, OLAs and ITSCs and also
emphasise on performance reporting which must be facilitated by a team
leaders from all IT sections. Additionally, institutes must identify
facilitating and clogging conditions for successful ITSM and this can be
necessitated through conducting seminars and or workshops on relevant IT
aspects. Conducting post training evaluation on deliberations on ITSM will
help in continuous improvement in service delivery. Relating COBIT and
ITIL to IT service management constructs (OLAS, SLAs and ITSCs)
presents an interesting area for further research.
REFERENCES
[1] Almeroth, K.C. and Hasan, M., 2002. Management of Multimedia on the Internet: 5th
IFIP/IEEE Proceedingds of the International Conference on Management of
Multimedia Networks and Services, MMNS 2002, Santa Barbara, CA, USA, October 6-
9, 200. CA: Springer, p.356.
[2] Bon, J. van et al., 2007. IT Service Management: An Introduction. Van Haren
Publishing, p.514.
[3] Dube, D.P. and Gulati, V.P., 2005. Information System Audit and Assurance. Tata
McGraw-Hill Education, p.671.
[4] Griffiths, R., Lawes, A. and Sansbury, J., 2012. IT Service Management: A Guide for
ITIL Foundation Exam Candidates. BCS, The Chartered Institute for IT, p.200.](https://image.slidesharecdn.com/vol14no1-july2014-171208072343/85/Vol-14-No-1-July-2014-66-320.jpg)
![International Journal of Computer Science and Business Informatics
IJCSBI.ORG
ISSN: 1694-2108 | Vol. 14, No. 1. JUNE-JULY 2014 65
[5] Hiles, A., 2000. Service Level Agreements: Winning a Competitive Edge for Support &
Supply Services. Rothstein Associates Inc, p.287.
[6] Lahti, C.B. and Peterson, R., 2007. Sarbanes-Oxley IT Compliance Using Open Source
Tools. Syngress, p.466.
[7] Moeller, R.R., 2013. Executive’s Guide to IT Governance: Improving Systems
Processes with Service Management, COBIT, and ITIL. John Wiley & Sons, p.416.
[8] Office of Government Commerce, 2010. Introduction to the ITIL service lifecycle. The
Stationery Office, p.247.
[9] Rudd, C., 2010. ITIL V3 Planning to Implement Service Management. The Stationery
Office, p.320.
[10] Saunders, M., Lewis, P., & Thornhill, A. (2009). Research methods for business
students. (5th Edition, Ed.) Pearson Education Limited, Essex, England.
[11]Troy, D. M., Rodrigo, F., & Bill, F. (2007). Defining IT Success Through the Service
Catalog: A Practical Guide about the Positioning, Design and Deployment of an
Actionable Catalog of IT Services (1st Edition, Ed.). US: Van Haren Publishing.
[12]University of Birmingham, 2014. IT Services - University of Birmingham. [Online]
Available at: <http://www.birmingham.ac.uk/university/professional/it/index.aspx>
[Accessed 18 Mar. 2014].
[13] University of California, 2012. ITS Service Management: Key Elements. [online]
Available at: <http://its.ucsc.edu/itsm/servicemgmt.html> [Accessed 18 Mar. 2014].
This paper may be cited as:
Zhou, M., Ruvinga, C.,Musungwini, S. and Zhou, G., T., 2014. A Model for
Implementation of IT Service Management in Zimbabwean State
Universities. International Journal of Computer Science and Business
Informatics, Vol. 14, No. 1, pp. 58-65.](https://image.slidesharecdn.com/vol14no1-july2014-171208072343/85/Vol-14-No-1-July-2014-67-320.jpg)
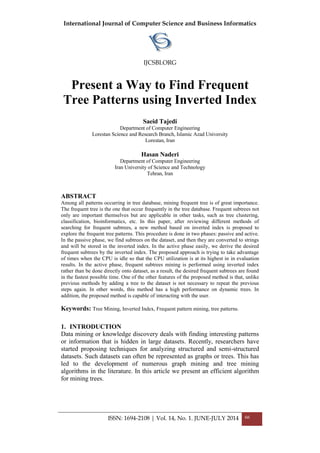
![International Journal of Computer Science and Business Informatics
IJCSBI.ORG
ISSN: 1694-2108 | Vol. 14, No. 1. JUNE-JULY 2014 67
Data mining has evolved from association rule mining, sequence mining, to
tree mining and graph mining. Association rule mining and sequence mining
are one-dimensional structure mining, and tree mining and graph mining are
two-dimensional or higher structure mining. The applications of tree mining
arise from Web usage mining, mining semi-structured data, and
bioinformatics, etc.
Basic and fundamental ideas of tree mining, roughly since the early '90s
were seriously discussed and during this decade were completed. These can
be stated that the origin and beginning of these ideas is their application
especially on the web. First, some essential and basic concepts are
described, and then describe the proposed method and finally the results will
be evaluated.
2. Related Works
2.1 Pre Order Tree Traversal
There are several ways to navigate through the ordered trees; pre order
traversal is one of the most important and most widely used of them. In this
way, we are acting like Depth First Search algorithm. This means that on the
tree like T starting from the root, then the left child and finally the right
child is navigating; this method is done recursively on all nodes of the tree.
2.2 Post Order Tree Traversal
It is also among the most important and widely used methods of ordered
trees traversal. In this method, we first on the tree like T starting from the
left child, then right child and finally the root is navigating, the operation is
performed recursively on all nodes of the tree.
Using either method, the above display, we can assign a number to each of
the nodes that in fact, it is represents a time to meet each node. If we use the
Post Order Traversal, that number is called PON.
2.3 RMP, LMP
LMP is the acronym Left Most Path represents a path from the root to the
leftmost leaf and the RMP is the acronym Right Most Path represents a path
from the root to the rightmost leaf.
2.4 Prüfer Sequence [23]
This algorithm was introduced in 1918 and used to convert the tree to string.
The algorithm works as follows in the tree like T, in every step the node
with the smallest label has been removed and label the parent node of this
tree is added to the Prüfer Sequence. This process is repeated n-2 times to 2
nodes remain.](https://image.slidesharecdn.com/vol14no1-july2014-171208072343/85/Vol-14-No-1-July-2014-69-320.jpg)
![International Journal of Computer Science and Business Informatics
IJCSBI.ORG
ISSN: 1694-2108 | Vol. 14, No. 1. JUNE-JULY 2014 68
2.5 Label Sequence
The next concept is Label Sequence. This sequence is produced according to
the Post Order Traversal. In other words, in the Post Order Traversal, label
of each node that will be scanned, add to the sequence.
2.6 Support
Simply this implies that the S pattern has been repeated several times in the
tree T.
(1)
Where S is a tree pattern and D is a database of trees. This concept for
determining the number of occurrences of each subtree in a set of trees is
being used.
2.7 Inverted Index [24]
Inverted Index is a structure that used to indexing frequent string elements
in set of documents and is consists of two main parts: Dictionary and
Posting List. Frequent string elements uniquely stored in Dictionary and the
number of occurrences of each of these elements in total documents is
determined. Informations about the frequent elements such as the document
name, number of occurrences in each document are determined in Posting
List.
3. An overview of research history
In recent years, much research about the frequent subtrees mining has been
done. Yongqiao Xiao et al in 2003 used the Path Join Algorithm and a
compact data structure, called FST-Forest to find frequent subtrees [25]. In
this way, we first find frequent root path in all directions and then with
integrate these paths, frequent subtrees are reached. Shirish Tatikonda et al
published an article in 2006 on the basis of the pattern growth[26]; In this
way that all trees in the database tree are converted to strings, that is done
with the two different methods: Prüfer Sequence and DFS algorithms; then
scroll all strings in which there is a subtree or pattern such as S, we are
seeking a new edge can be added to S. Then, concurrently with the previous
step, as production of the candidate subtrees, the threshold values are
evaluated for be frequent. In 2009, Federico Del Razo Lopez et al presented
an idea to make flexible the tightly constrained tree mining In non-
fuzzy[27]. This paper used the principle of Partial Inclusion; that to say that
there is a pattern S in a tree T, it is no need to exist all the pattern nodes in
the tree. The proposed algorithm uses Apriori property for pruning
undesirable patterns.](https://image.slidesharecdn.com/vol14no1-july2014-171208072343/85/Vol-14-No-1-July-2014-70-320.jpg)

![International Journal of Computer Science and Business Informatics
IJCSBI.ORG
ISSN: 1694-2108 | Vol. 14, No. 1. JUNE-JULY 2014 70
The next thing that we need to ensure that in each tree can produce all
subtrees and each subtree is created only once, for this purpose, we use the
LMP to generate the subtree. This means that if we show the T tree using
Prüfer sequence and n is the subtree, A node such as v that is to be added to
the n should be included in the LMP of the T tree and since the PON is built
on the Prüfer sequence, just the v node should be after the last node of the n
and attached to that in the Prüfer sequence of the T tree. So is guaranteed to
be generated only once for each subtree and if it is done for all the nodes,
entire subtree of each tree will produce.
Now we will introduce the algorithm. The proposed algorithms for
generating subtrees and convert them into a string can be seen in Figure 2.
Insert CPS(T) in Array A
For i=n downto 1 do
{
Subtree=A[n]
Insert CPS(A[n]) in Treestringi
Sub(subtree,i,A, stack1,stack2)
}
Sub(subtree,index,A[],stack1,stack2)
c=0
t=0
For j= 1 to index-1 do
If index in A[j] then
{
stack3=stack1
stack4=stack2
subtree2=subree
while stack3 not empty
{
t++
Pop x from stack1
Pull y from stack2
Subtree2=subtree2+x
if t>0 then
{
Insert CPS(subtree2) in treestringi
Sub(subtree2,y, A[],stack3,stack4)
}
}
If c>0 then
{
Temptree push in stack1
TempIndex push in stack2
}
Temptree= a[j]
TempIndex=j
c++
Subtree=subtree+a[j]](https://image.slidesharecdn.com/vol14no1-july2014-171208072343/85/Vol-14-No-1-July-2014-72-320.jpg)
![International Journal of Computer Science and Business Informatics
IJCSBI.ORG
ISSN: 1694-2108 | Vol. 14, No. 1. JUNE-JULY 2014 71
Insert CPS(subtree) in treestringi
Sub(subtree,j,A[],stack1,stack2)
while stack1 not empty
{
c--
Pull x from stack1
Pull y from stack2
Insert CPS(subtree+x) in treestringi
Sub(subtree+x,y, A[],stack1,stack2)
}
}
Figure 2. The algorithm of the subtrees generation and convert them to a string
In the following we examined the algorithm works with an example. In the
beginning starting from the first tree and CPS (T) are stored in the array A.
As a result, the array will be completed for T1 according to Figure 3.
Figure 3. Production of the array using CPS (T)
In this step we identify all existing subtrees and store them in a string. To do
this, we start from the root node of T1, therefore the last element of the
array namely A0 and respectively, the branching subtrees from this node
should be stored in the string. As a result, at first A0 is stored in the string
according to the algorithm, next we run sub function. Considering that the
index of previous node is equal to 9 to find the subtrees with two nodes,
respectively start from the first element of the array and review to the
element with the pre Index of the previous node namely 8, If the value
contains the index of the previous node namely 9, It has added to the
previous tree namely A and CPS of the found subtree can be inserted in the
string of this tree that here A0C2 and A0E2 are stored in the string and
recursively repeat the same steps for new generated subtrees. Given that
both produced subtrees branched from a node, adding node with smaller
index from Stack1 and its index from stack2 are extracted and added to the
subtree with a larger index and its CPS is stored in the string,therefore in
this step is also added A0E3C3 and also this is repeated for the whole
produced subtrees with larger index in the next step. Similarly, the work
continues recursively until all subtrees branching from the first node of the
array to be stored in string. Then do the same procedure for the next
elements of the array, until complete the string of the subtrees of the tree
and then we proceed next trees until for each tree, the string is created for all
subtrees of the tree.](https://image.slidesharecdn.com/vol14no1-july2014-171208072343/85/Vol-14-No-1-July-2014-73-320.jpg)
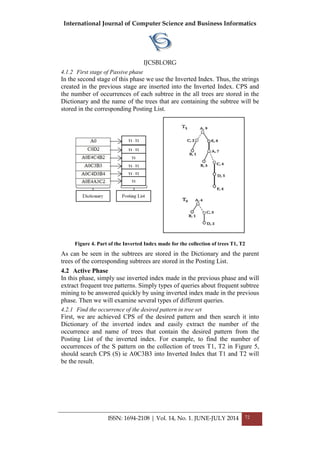
![International Journal of Computer Science and Business Informatics
IJCSBI.ORG
ISSN: 1694-2108 | Vol. 14, No. 1. JUNE-JULY 2014 73
Figure 5. Part of the Inverted Index made for the collection of trees T1, T2
4.2.2 Find frequent subtrees in considering the Support
If we want to find some subtrees that them Support are greater than a
threshold, must find the subtrees with their occurrence compared to the total
trees is greater than the Support. So we can search in the inverted index and
easily find subtrees that the length of them Posting List compared to the
total trees is at least equal to Support.
4.2.3 Find frequent subtrees in considering the Support and minimum nodes
In this case, in addition to Support, the number of nodes is also the criterion,
so easily search in Inverted Index and only show the subtrees with the
following conditions. First, in Dictionary Length the subtree is greater than
the minimum number of nodes and Second, length of corresponding Posting
List compared to the total trees is at least equal to Support.
5. Evaluation
In this section, the proposed method will be evaluated from various aspects.
We present the experimental evaluation of the proposed approach on
synthetic datasets. In the following discussion, dataset sizes are expressed in
terms of number of trees. In the graphs is used from symbolizes Algorithm
to display proposed method. Name and details of synthetic datasets are
shown in Table 1.
Table 1. Name and details of synthetic datasets
Name Description
DS1 -T 10 -V 100
DS2 -T 10 -V 50
As shown in Table 1, the synthetic datasets DS1 and DS2 are generated
using the PAFI[28] toolkit developed by Kuramochi and Karypis (PafiGen).
Since PafiGen can create only graphs we have extracted spanning trees from
these graphs and used in our analysis. We also used minsup to analyze the
various factors. This means if the number of replicated subtree is less than
minsup value, the tree won't be indexed in Inverted Index. Minsup value is
from 1 to infinity, which is the default value is equal to 1 in the proposed
algorithm. In addition, we also use from maxnode in evaluations. Maxnode
is the symbol to specify the maximum number of nodes in each subtree in
Inverted Index. This means if the number of subtree nodes reach maxnode
amount in the proposed algorithm, production of its subtree will halt.](https://image.slidesharecdn.com/vol14no1-july2014-171208072343/85/Vol-14-No-1-July-2014-75-320.jpg)
![International Journal of Computer Science and Business Informatics
IJCSBI.ORG
ISSN: 1694-2108 | Vol. 14, No. 1. JUNE-JULY 2014 75
5.3 Evaluating effect of maxnode on usage memory
We examine the effect the maximum number of nodes in the indexed
subtrees on usage memory in passive phase. This experiment has been done
on synthetic datasets DS1 and DS2 generated by Pafi and with size 50K. In
this experiment the minsup is the default value ie 1. As can be seen, the
usage memory of the algorithm is increasing by increasing the number of
indexed nodes in each subtree.
Diagram 3: Effect of maxnode on the usage memory
5.4 Evaluation of CPU utilization compared with the Tree Miner
In diagram 4, the comparison is performed between the proposed algorithm
with Tree Miner that was introduced by Zaki and is one of the best
algorithms for tree mining[29]. This experiment has been done on synthetic
dataset DS1 generated by Pafi and with size 50K. Given that in passive
phase the proposed algorithm is searching for subtrees and adding them to
inverted index, consequently, as can be seen in the diagram, CPU utilization
is close to 100 percent in most situations while the average CPU utilization
on TreeMining algorithm is approximately 90%.
Diagram 4: Comparison CPU utilization between TreeMiner and the algorithm
0
1000
2000
3000
4000
5000
6000
7000
8000
9000
1 5 25 50 250 500 2,500
VirtualMemory(MB)
Maximum # of node in Subtrees
DS1
DS2
0
10
20
30
40
50
60
70
80
90
100
10K 20K 30K 40K 50K
Cpuutilization(%)
# of trees
TreeMiner
Algorithm](https://image.slidesharecdn.com/vol14no1-july2014-171208072343/85/Vol-14-No-1-July-2014-77-320.jpg)
![International Journal of Computer Science and Business Informatics
IJCSBI.ORG
ISSN: 1694-2108 | Vol. 14, No. 1. JUNE-JULY 2014 76
6. Conclusions and Recommendations
In this paper, a new method based on the Inverted Index in order to frequent
pattern mining was introduced to overcome many of the disadvantages of
previous methods. One problem with existing approaches is that mainly act
as a static on the set of trees and if a new tree is added to the set of trees, all
mining operations must be done from scratch again. This problem has been
overcome by the Inverted Index in the proposed approach. This means that
all the trees are indexing in the Passive phase and if a new tree is added to
the treeset at any stage, just the tree is indexed and there is no need to repeat
the previous operations. This algorithm will result in a high performance on
a collection of dynamic trees. Another advantage of this method compared
to other methods is that it is scalable. As listed in Section 5.1, the
performance of this algorithm is not slowed by increasing the treeset. As
listed in Section 5.4, one of the most striking features of this algorithm is
efficient use of CPU. In this method, the user interaction is also present.
As Listed in Section 5.2, the number of indexed patterns increases
exponentially by decreasing minsup, while the generally patterns with low
occurrences doesn't matter to us. As a result, we can speed up indexing in
passive phase with determining the appropriate amount of the minsup. As
Listed in Section 5.3, the usage memory increases by increasing the
maximum number of nodes in the indexed subtrees, while the usually
subtrees with very large number of nodes doesn't matter to us. As a result,
we can manage the usage memory with determining the appropriate amount
of the maxnode.
REFERENCES
[1] B. Vo, F. Coenen, and B. Le, "A new method for mining Frequent Weighted Itemsets
based on WIT-trees," International Journal of Advanced Computer Research, p. 9,
2013.
[2] L. A. Deshpande and R. S. Prasad, "Efficient Frequent Pattern Mining Techniques of
Semi Structured data: a Survey," International Journal of Advanced Computer
Research, p. 5, 2013.
[3] A. M. Kibriya and J. Ramon, "Nearly exact mining of frequent trees in large
networks," Data Mining and Knowledge Discovery (DMKD), p. 27, 2013.
[4] G. Pyun, U. Yun, and K. H. Ryu, "Efficient frequent pattern mining based on Linear
Prefix tree," International Journal of Advanced Computer Research, p. 15, 2014.
[5] C. K.-S. Leung and S. K. Tanbeer, "PUF-Tree: A Compact Tree Structure for
Frequent Pattern Mining of Uncertain Data," Advances in Knowledge Discovery and
Data Mining, p. 13, 2013.
[6] A. Fariha, C. F. Ahmed, C. K.-S. Leung, S. M. Abdullah, and L. Cao, "Mining
Frequent Patterns from Human Interactions in Meetings Using Directed Acyclic
Graphs," Advances in Knowledge Discovery and Data Mining, p. 12, 2013.](https://image.slidesharecdn.com/vol14no1-july2014-171208072343/85/Vol-14-No-1-July-2014-78-320.jpg)
![International Journal of Computer Science and Business Informatics
IJCSBI.ORG
ISSN: 1694-2108 | Vol. 14, No. 1. JUNE-JULY 2014 77
[7] J. J. Cameron, A. Cuzzocrea, F. Jiang, and C. K. Leung, "Mining Frequent Itemsets
from Sparse Data," Web-Age Information Management, p. 7, 2013.
[8] G. Lee, U. Yun, and K. H. Ryu, "Sliding window based weighted maximal frequent
pattern mining over data streams," Advances in Knowledge Discovery and Data
Mining, p. 15, 2014.
[9] H. He, Z. Yu, B. Guo, X. Lu, and J. Tian, "Tree-Based Mining for Discovering
Patterns of Reposting Behavior in Microblog," Advanced Data Mining and
Applications, p. 13, 2013.
[10] U. Yun, G. Lee, and K. H. Ryu, "Mining maximal frequent patterns by considering
weight conditions over data streams", Advances in Knowledge Discovery and Data
Mining, 2014.
[11] B. Kimelfeld and P. G. Kolaitis ," The complexity of mining maximal frequent
subgraphs," Proceedings of the 32nd symposium on Principles of database systems, p.
12, 2013.
[12] B. Vo, F. Coenen, and B. Le, "A new method for mining Frequent Weighted Itemsets
based on WIT-trees," International Journal of Advanced Computer Research, p. 9,
2013.
[13] L. A. Deshpande and R. S. Prasad, "Efficient Frequent Pattern Mining Techniques of
Semi Structured data: a Survey," International Journal of Advanced Computer
Research, p. 5, 2013.
[14] A. M. Kibriya and J. Ramon, "Nearly exact mining of frequent trees in large
networks," Data Mining and Knowledge Discovery (DMKD), p. 27, 2013.
[15] G. Pyun, U. Yun, and K. H. Ryu, "Efficient frequent pattern mining based on Linear
Prefix tree" International Journal of Advanced Computer Research, p. 15, 2014.
[16] C. K.-S. Leung and S. K. Tanbeer, "PUF-Tree: A Compact Tree Structure for
Frequent Pattern Mining of Uncertain Data," Advances in Knowledge Discovery and
Data Mining, p. 13, 2013.
[17] A. Fariha, C. F. Ahmed, C. K.-S. Leung, S. M. Abdullah, and L. Cao, "Mining
Frequent Patterns from Human Interactions in Meetings Using Directed Acyclic
Graphs," Advances in Knowledge Discovery and Data Mining, p. 12, 2013.
[18] J. J. Cameron, A. Cuzzocrea, F. Jiang, and C. K. Leung, "Mining Frequent Itemsets
from Sparse Data," Web-Age Information Management, p. 7, 2013.
[19] G. Lee, U. Yun, and K. H. Ryu, "Sliding window based weighted maximal frequent
pattern mining over data streams," International Journal of Advanced Computer
Research, p. 15, 2014.
[20] H. He, Z. Yu, B. Guo, X. Lu, and J. Tian, "Tree-Based Mining for Discovering
Patterns of Reposting Behavior in Microblog," Advanced Data Mining and
Applications, p. 13, 2013.
[21] U. Yun, G. Lee, and K. H. Ryu, "Mining maximal frequent patterns by considering
weight conditions over data streams," International Journal of Advanced Computer
Research, 2014.
[22] B. Kimelfeld, and P. G. Kolaitis, "The complexity of mining maximal frequent
subgraphs," Proceedings of the 32nd symposium on Principles of database systems,
p. 12, 2013.
[23] H. Prüfer. Prüfer sequence. Available:
http://en.wikipedia.org/wiki/Pr%C3%BCfer_sequence
[24] C. D. Manning, P. Raghavan, and H. Schütze, An Introduction to Information
Retrieval. Cambridge, England: Cambridge University Press, 2008.](https://image.slidesharecdn.com/vol14no1-july2014-171208072343/85/Vol-14-No-1-July-2014-79-320.jpg)
![International Journal of Computer Science and Business Informatics
IJCSBI.ORG
ISSN: 1694-2108 | Vol. 14, No. 1. JUNE-JULY 2014 78
[25] Y. Xiao, J.-F. Yao, Z. Li, and M. H. Dunham, "Efficient data mining for maximal
frequent subtrees," Proceedings of 3rd IEEE International Conference on Data
Mining, p. 8, 2003.
[26] S. Tatikonda, S. Parthasarathy, and T. Kurc, "TRIPS and TIDES: New Algorithms for
Tree Mining," Proceedings of 15th ACM International Conference on Information
and Knowledge Management (CIKM), p. 12, 2006.
[27] F. D. R. Lopez, A.Laurent, P.Poncelet, and M.Teisseire, "FTMnodes: Fuzzy tree
mining based on partial inclusion," Advanced Data Mining and Applications, pp.
2224–2240, 2009.
[28] Kuramochi and Karypis. Available: http://glaros.dtc.umn.edu/gkhome/pafi/overview/
[29] M. J. Zaki, "Efficiently Mining Frequent Trees in a Forest," Proceedings of the 8th
ACM SIGKDD International Conference on Knowledge Discovery and Data Mining
(SIGKDD), Edmonton, Canada, p. 10, 2002.
This paper may be cited as:
Tajedi, S. and Naderi, H., 2014. Present a Way to Find Frequent Tree Patterns
using Inverted Index. International Journal of Computer Science and Business
Informatics, Vol. 14, No. 1, pp. 66-78.](https://image.slidesharecdn.com/vol14no1-july2014-171208072343/85/Vol-14-No-1-July-2014-80-320.jpg)
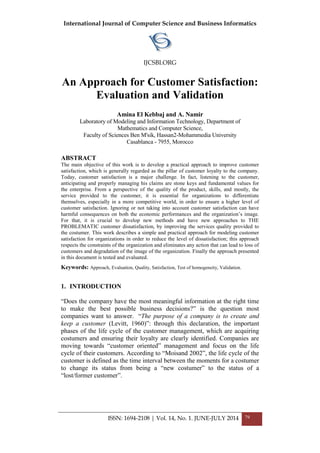
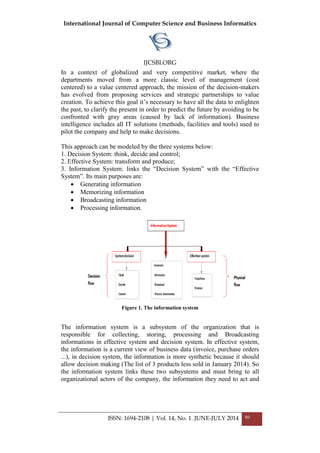


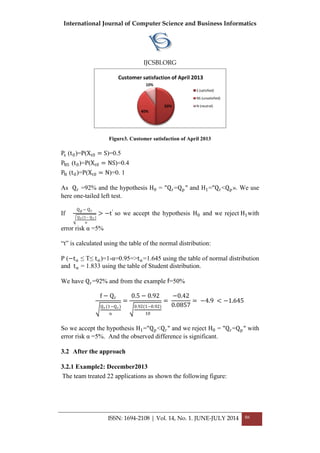


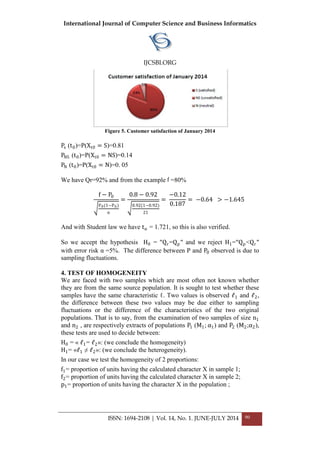
![International Journal of Computer Science and Business Informatics
IJCSBI.ORG
ISSN: 1694-2108 | Vol. 14, No. 1. JUNE-JULY 2014 91
p2= proportion of units having the character X in the population .
H0= «P1 =P2=P » and H1= « P1≠P2 »
P is replaced by the estimator f =
n1f1+n2f2
n1+n2
=
22∗0.72+21∗0.81
22+21
= 0.764
x =
0.81−0.72
0.764∗0.24(
1
22
+
1
21
)
=0.02 > -1.645
So we conclude the homogeneity of the proposed solution. The proposed
population is homogeneous and the difference observed is more significant
and is due to sampling fluctuations.
4. CONCLUSIONS
The work done is to develop a practical and pragmatic approach to maximize
customer satisfaction in an organization for a given period. Therefore, an
approach has been proposed, evaluation and validation of the latter are
described above. This work opens the way to our sense towards diverse
perspectives of research which are situated on two plans: a plan of deepening of
the realized research and a plan of extension of the domain of research. In terms
of deepening of the proposed work, it would be interesting at first to use the
Markov chain to model statistically the proposed model and to propose or
develop practical tools for implementation of the proposed approach. As for
extension of the domain of the research, it would be interesting to connect this
approach to governance of information systems and to drive decision-making
system which consist to investigate the options and compare them to choose an
action that help in making decision.
REFERENCES
[1] BUFFA, Elwood. Operations Management, 3rd
Ed., NY, John Wiley & Sons, 1972.
[2] FRITZSIMMONS, James A. et Mona J. FRITZSIMMONS. Service management:
Operations, Strategy and Information Technology, 3rd
Ed., NY, Irwin/McGraw-Hill, 2001.
[3] Z. Adhiri, S. Arezki, A. Namir : What is Application LifeCycle Management?,
International Journal of Research and Reviews in Applicable Mathematics and Computer-
Science, ISSN: 2249 – 8931, December 2011
[4] http://hal.archives-ouvertes.fr/docs/00/71/95/35/PDF/2010CLF10335.pdf
[5] STEVENSON, William J. Introduction to Management Science, 2e edition, Burr Ridge,
IL., Richard D. Irwin, 1992.
[6] HILLIER, Frederick S., Mark S. HILLIER and Gerald J. LIEBERMAN. Introduction to
Management Science : A Modeling and Case Studies Approach with Spreadsheets, New
York, Irwin/McGraw-Hill, 2000.
[7] A. EL KEBBAJ et A. NAMIR. Modeling customer's satisfaction. Day of Science
Engineers, Faculty of Science Ben M’Sik, Casablanca july 29, 2013
[8] http://www.projectsmart.co.uk/docs/chaos-report.pdf
[9] http://info.informatique.entreprise.over-blog.com/article-approche-du-systeme-d-
information-dans-l-entreprise-69885381.html](https://image.slidesharecdn.com/vol14no1-july2014-171208072343/85/Vol-14-No-1-July-2014-93-320.jpg)
![International Journal of Computer Science and Business Informatics
IJCSBI.ORG
ISSN: 1694-2108 | Vol. 14, No. 1. JUNE-JULY 2014 92
[10] http://www.hamadiche.com/Cours/Stat/Cours5.pdf
[11] S. ARIZKI : ITGovA : proposed a new approach to the governance of information
systems. PhD in Computer Science, defended at the Faculty of Sciences of Ben M'Sik
Casablanca 24/02/2013
This paper may be cited as:
Kebbaj, A., E. and Namir A., 2014. An Approach for Customer Satisfaction:
Evaluation and Validation. International Journal of Computer Science and
Business Informatics, Vol. 14, No. 1, pp. 79-91.](https://image.slidesharecdn.com/vol14no1-july2014-171208072343/85/Vol-14-No-1-July-2014-94-320.jpg)
![International Journal of Computer Science and Business Informatics
IJCSBI.ORG
ISSN: 1694-2108 | Vol. 14, No. 1. JUNE-JULY 2014 92
Spam Detection in Twitter - A
Review
C. Divya Gowri and Professor V. Mohanraj
Sona College of Technology, Salem
ABSTRACT
Social Networking sites have become popular in recent years, among these sites Twitter is
one of the fastest growing site. It plays a dual role of Online Social Networking (OSN) and
Micro Blogging. Spammers invade twitter trending topics (popular topics discussed by
Twitter user) to pollute the useful content. Social spamming is more successful compared to
email spamming by using social relationship between the users. Spam detection is
important because Twitter is mainly used for commercial advertisement and spammers
invade the privacy information of the user and also the reputation of the user is damaged.
Spammers can be detected using content and user based attributes. Traditional classifiers
are required for spam detection. This paper focuses on study of detecting spam in twitter.
Keywords: Social Network Security, Spam Detection, Classification, Content based
Detection.
1. INTRODUCTION
Web-based social networking services connect people to share interests and
activities across political, economic, and geographic borders. Online Social
Networking sites like Twitter, Facebook, and MySpace have become
popular in recent years. It allows users to meet new people, stay in touch
with friends, and discuss about everything including jokes, politics, news,
etc., Using Social networking sites marketers can directly reach customers
this is not only benefit for the marketers but it also benefits the users as they
get more information about the organization and the product. Twitter [1] is
one among these social networking sites. Twitter provides a micro blogging
(Exchange small elements of content such as short sentences, individual
images, or video links) service to users where users can post their messages
called tweets. Tweet can be limited to 140 characters only HTTP links and
text are allowed. Twitter user is identified by their user name optionally by
their real name. The user „A‟ starts following other users and their tweets
will appear on A‟s page. User A can be followed back if other user desires.
Trending topics in Twitter can be identified with hash tags („#‟). When a
user likes a tweet he/she can „retweet‟ that message. Tweets are visible
publically by default, but senders can deliver message only to their](https://image.slidesharecdn.com/vol14no1-july2014-171208072343/85/Vol-14-No-1-July-2014-95-320.jpg)
![International Journal of Computer Science and Business Informatics
IJCSBI.ORG
ISSN: 1694-2108 | Vol. 14, No. 1. JUNE-JULY 2014 93
followers. The „@‟ sign followed by username is a reply to other user. The
most common type of spamming in Twitter is through Tweets. Sometimes it
is via posting suspicious links.
Spam [14] can arrive in the form of direct tweets to your Twitter inbox.
Unfortunately spammers use twitter as a tool to post malicious link, send
spam messages to legitimate users. Also they spread viruses, or simply
compromise the system reputation. Twitter is mainly used for commercial
advertisement, and spammers invade the privacy information of the user and
also the reputation of the user is damaged. The attackers advertise on the
Twitter for selling products by offering huge discount and free products.
When users try to purchase these products, they are asked to provide
account information which is retrieved by attackers and they misuse the
information. Therefore spam detection in any social networking sites are
important.
2. RELATED WORKS
McCord et al., [1] has proposed user based and content based features to
facilitate spam detection.
User Based Features
The user based features considered are number of friends, number of
followers, user behaviors e.g. the time periods and the frequencies when a
user tweets and the reputation (Based on the followers and friends) of the
user. Reputation of a user is given by the equation,
𝑅 𝑗 = 𝑛𝑖(𝑗) (𝑛𝑖 𝑗 + 𝑛0 𝑗 ) (2.1)
Where 𝑛𝑖(𝑗) represents the number of followers of user „j‟ and 𝑛0 𝑗
represents the number of friends the user „j‟ has. According to Twitter Spam
and Abuse Policy „if the users have small number of followers compared to
the amount of people the user following then it may be considered as a spam
account‟. Spammers tend to be most active during the early morning hours
while regular users will tweet much less.
Content Based Features
The content based features [11] considered in this approach are number of
Uniform Resource Locator‟s (URL), replies/mentions, keywords/word
weight, retweet, hash tags. Retweet is a reposting someone‟s post, it is like a
normal post with author‟s name. It helps to share the entire tweet with all
the followers. The „#‟ containing tweets are the popular topics being
discussed by the users.](https://image.slidesharecdn.com/vol14no1-july2014-171208072343/85/Vol-14-No-1-July-2014-96-320.jpg)
![International Journal of Computer Science and Business Informatics
IJCSBI.ORG
ISSN: 1694-2108 | Vol. 14, No. 1. JUNE-JULY 2014 94
Secondly, they compare four traditional classifiers namely Random forest,
Support Vector Machine (SVM), Naïve Bayesian and K-nearest neighbor
classifiers which are used to detect Spammers. Among these classifiers
Random Forest is found to be effective but this classifier can deal with only
imbalanced data set (data set with more regular users than spammers). Alex
HaiWang [2] considered 'Follower – Friend‟ relationship in his paper. A
„Direct Social Graph‟ is modeled. The author considers content based and
graph based features to facilitate spam detection.
Graph Based Features
A social graph is modeled as a direct graph G= (V, A) where set of V nodes
representing user accounts and set A that connect the nodes. An arc a = (i, j)
represents user i is following user j. Follower is considered as the Incoming
links or in links of a node i.e.., People following you not necessary that you
should follow back. A Friend is an Outgoing links or out links. i.e.., People
you are following. A Mutual Friend is a Follower and Friend at the same
time. When there is no connection between two users then they are
considered to be strangers.
Fig 2.1 A Simple Twitter Graph
In the above figure user A is following user B, user B and user C are
following each other. i.e., User B and user C are mutual friends, and User A
and User C are strangers. The graph based features considered are number
of followers, number of friends, and the reputation of a user.
The classifier used in this paper to detect spam is Naïve Bayesian classifier
[10]. It is based on Bayes theorem which is given by the equation,
𝑃 𝑌 𝑋 = ((𝑃 𝑋 𝑌 𝑃 𝑌 ) 𝑃(𝑋) (2.2)
The twitter account is considered as vector X and each account is assigned
with two classes Y spam and non-spam, the assumption is that the features
are considered to be conditionally independent. This classifier is easy to
implement, it requires small amount of training data set. But, conditionally
independence may lead to loss of accuracy. This classifier cannot model
independency.](https://image.slidesharecdn.com/vol14no1-july2014-171208072343/85/Vol-14-No-1-July-2014-97-320.jpg)
![International Journal of Computer Science and Business Informatics
IJCSBI.ORG
ISSN: 1694-2108 | Vol. 14, No. 1. JUNE-JULY 2014 95
Twitter Account Features:
Zi Chu et al., [13] review some of the classification features to detect
spammers. These include tweet level features and account level features.
The tweet level features include Spam Content Proposition i.e. tweet text
checked with spam word list and the final landing URL is checked. The
account level features include account Profile which is the self description
of short description text and homepage URL and check whether the
description contains spam words.
Fabricio Benevento et al., [3] have considered the problem of detecting
spammers. In this paper approximately 96% legitimate users and 70%
spammers were correctly classified. Like [1] user based and content
attributes are considered. To detect spammers with accuracy, confusion
matrix is introduced
Fig 2.2 An Example of Confusion Matrix
In the above matrix, „a‟ is the number of spam correctly classified, „b‟ is the
number of spam wrongly classified as non-spam, „c‟ is the number of non-
spam wrongly classified as spam and „d‟ is the number of non-spam
correctly classified. For effective classification some of evaluation metrics
are considered. They are Precision, Recall, F-measure (Micro-F1, Macro-
F1).
Evaluation Metrics:
Precision: It is defined as the ratio of the number of users classified
correctly to the total predicted users and is given by the
equation,
𝑃𝑟𝑒𝑐𝑖𝑠𝑖𝑜𝑛, 𝑝 = 𝑎 (𝑎 + 𝑐) (2.3)
Recall: It is defined the ratio of number of users correctly classified to the
number of users and is given by the equation,
𝑅𝑒𝑐𝑎𝑙𝑙, 𝑟 = 𝑎 (𝑎 + 𝑏) (2.4)
F-measure: It is the harmonic mean between precision and recall and it is
given by the equation,
𝐹_𝑚𝑒𝑎𝑠𝑢𝑟𝑒 = 2𝑝𝑟 (𝑝 + 𝑟) (2.5)](https://image.slidesharecdn.com/vol14no1-july2014-171208072343/85/Vol-14-No-1-July-2014-98-320.jpg)
![International Journal of Computer Science and Business Informatics
IJCSBI.ORG
ISSN: 1694-2108 | Vol. 14, No. 1. JUNE-JULY 2014 96
The classifier used to detect spam is SVM. It is a state of the art method in
classification and in this approach they use non-linear SVM with the Radial
Basic Function kernel that allow SVM to perform with complex boundaries.
The biggest limitation of the support vector approach lies in choice of the
kernel and high algorithmic complexity. This approach mainly focuses on
detecting spam instead of spammers so that it can be useful in filtering
spam. Once a spammer is detected it is easy to suspend that account and
block the IP address but spammers continue their work from other new
account.
Puneeta Sharma and Sampat Biswas [4] proposed two key components (1)
identifying timestamp gap between two successive tweets and (2)
identifying tweet content similarity. They found two common techniques
used by spammers (1) Posting duplicate content by modifying small content
of the tweet; (2) Post spam within short intervals. Spam Identification
approach included BOT Activity Detection and Tweet Similarity Index.
Twitter data can be filtered in various ways by user id, by keyword, many
spammers post spam messages using BOT (computer program), reducing
the frequency between consecutive tweets. To calculate timestamp between
tweets, they first cluster tweets based on user id and sort by increasing
timestamp.
Fig 2.3 BOT activity detection
Cluster Tweets
Identify
Timestamp Gap
Gap < 10s
Spam Non
Spam
Cluster tweets
based on user id
Calculate time
difference
YES NO](https://image.slidesharecdn.com/vol14no1-july2014-171208072343/85/Vol-14-No-1-July-2014-99-320.jpg)
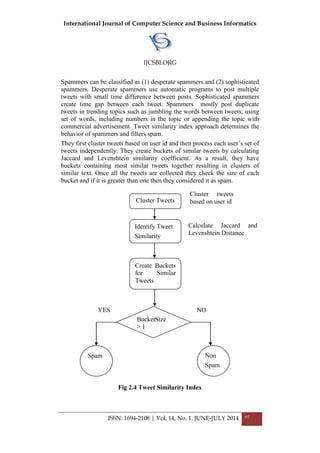
![International Journal of Computer Science and Business Informatics
IJCSBI.ORG
ISSN: 1694-2108 | Vol. 14, No. 1. JUNE-JULY 2014 98
Levenshtein distance
It is a string metric measurement for calculating the difference
between two sequences or text. Informally, the Levenshtein distance
between two words is the minimum number of single-character edits
required to change one word into the other including insertion, deletion, and
substitution. The edit distance phrase is often used to refer Levenshtein
distance. The distance is zero if the strings are equal. For example, the
Levenshtein distance between "sitter" and "sitting" is 3
Sitter → sittin (substitution of "i" for "e")
Sitter → sittin (substitution of "r" for "n")
Sittin → sitting (insertion of "g" in the end).
This Levenshtein distance is used to find out the duplicate tweets i.e. if the
tweets are duplicates then the distance is zero.
Jaccard Index
It is also called Jaccard similarity coefficient. It is used for comparing
diversity and similarity of sample sets.
J (A, B) =
|𝐴∩𝐵|
|𝐴∪𝐵|
(2.6)
Jaccard Distance measures dissimilarity between sample sets which is
obtained by subtracting the jaccard coefficient from 1.
𝑑𝑗 𝐴, 𝐵 = 1 − 𝐽(𝐴, 𝐵) (2.7)
Dolvara Gunatilaka [9] discusses about two privacy issues. First is user‟s
identity or user‟s anonymity. The second issue is about user profile or
personal information leakage.
User anonymity
It is that in many social networking sites users use their real name to
represent their account. There are two methods to expose user‟s anonymity:
(1) de-anonymization attack and (2) neighborhood attack [15]. In the first
one, the user‟s anonymity can be revealed by history stealing and group
membership information while in the second one, the attacker finds the
neighbors of the victim node. Based on user‟s profile and personal
information, attackers are attracted by user‟s personal information like their
name, date of birth, contact information, relationship status, current work
and education background.
There can be leakage of information because of poor privacy settings. Many
profiles are made public to others i.e. anyone can view their profile. Next is](https://image.slidesharecdn.com/vol14no1-july2014-171208072343/85/Vol-14-No-1-July-2014-101-320.jpg)
![International Journal of Computer Science and Business Informatics
IJCSBI.ORG
ISSN: 1694-2108 | Vol. 14, No. 1. JUNE-JULY 2014 99
leakage of information through third party application. Social networking
sites provide an Application Programming Interface (API) for third party
developers to create applications. Once users access these applications the
third party can access their information automatically.
Social Worms
It discuss about some of the social worms. Among those worms Twitter
worm is one of the popular worms.
Twitter worm: It is a term to describe worms that are spreading through
twitter. There are many versions and two worms that are discussed in this
paper are:
Profile Spy worm: This worm spreads by posting a link that downloads a
third party application called “Profile Spy” (a fake application). When users
try to download the application they need to fill some personal information
which allows attacker to obtain user‟s information. Once account is infected,
it will continuously tweet malicious messages to their followers. Next
twitter worm is Google worm which uses shortened Google URL that tricks
the users to click the link. The fake link will redirect users to a fake anti-
virus website. The website will provide a warning saying that computer got
affected and allows user to download the fake antivirus which is actually a
malicious code.
Sender Receiver Relationship
Jonghyuk Song et al., [7] propose a spam filtering techniques based on
sender receiver relationship. This paper addresses two problems in detecting
spam. First is account features can be fabricated by spammers. Second is
account features cannot be collected until number of malicious messages are
reported in that account. The spam filtering does not consider account
features rather than it uses relational features i.e. the connectivity and the
distance between the sender and receiver. Relational features are difficult to
manipulate by spammers. Since twitter limits the tweet to 140 characters
spammers cannot put enough information in that. For this reason spammers
go for posting URL containing spam. They classify the messages as spam
based on the sender. Content filtering is not effective in twitter because it
contains small amount of text.
Restrictions in Twitter
Some of the restrictions considered in twitter [9] are: The user must not
follow large number of users in a short time.
a. Unfollowing and following someone repeatedly.
b. Small number of followers when compared to the amount
of following.](https://image.slidesharecdn.com/vol14no1-july2014-171208072343/85/Vol-14-No-1-July-2014-102-320.jpg)
![International Journal of Computer Science and Business Informatics
IJCSBI.ORG
ISSN: 1694-2108 | Vol. 14, No. 1. JUNE-JULY 2014 100
c. Duplicate tweets or updates.
d. Update consisting of only links.
The distance between two users is calculated as follows [5][6] when two
users are directly connected by an edge, the distance is one. This means that
the two users are friends. When the distance is greater than one, they have
common friends but not friends themselves. Next the connectivity
represents the strength of the relationship. The way to measure connectivity
is counting the number of paths. Hence, the connectivity between a
spammer and a legitimate user is weaker. The problem of this system is that
it identifies messages as normal if it comes from infected friends.
Sometimes attackers may send spam messages from legitimate accounts by
stealing passwords.
D. Karthika Renuka and T. Hamsapriya [8] an unsolicited email is also
called spam and it is one of the fastest growing problems associated with
Internet. Among many proposed techniques Bayesian filtering is considered
as an effective one against spam. It works based on probability of words
occurring in spam and legitimate mails. But keywords are used to detect
spam mails in many spam detection system.
In that case misspellings may arise and hence it needs to be constantly
updated. But it is difficult to constantly update the blacklist. For this
purpose Word Stemming or Hashing Technique is proposed. This improves
the efficiency of content based filter. These types of filters are useless if
they don‟t understand the meaning of the meaning of the words. They have
employed two techniques to find out the spam content
Content based spam filter [10] This filter works on words and phrases of
the email content i.e. associates the word with a numeric value. If this value
crosses certain threshold it is considered as spam. This can detect only valid
words with correct spellings. This filter uses bayes theorem for detecting the
spam content.
Word stemming or word hashing technique this filter [12] extracts the
stem of the modified word so that efficiency of detecting spam content can
be improved. Rule-based word stemming algorithm is used for spam
detection. Stemming is an algorithm that converts a word into related form.
One such transformation is conversion of plurals into singular, removing
suffixes.](https://image.slidesharecdn.com/vol14no1-july2014-171208072343/85/Vol-14-No-1-July-2014-103-320.jpg)
![International Journal of Computer Science and Business Informatics
IJCSBI.ORG
ISSN: 1694-2108 | Vol. 14, No. 1. JUNE-JULY 2014 101
3. CONCLUSIONS
Spammers are the major problem in any online social networking sites.
Once a spammer is detected it is easy to suspend his/her account or block
their IP address. But they try to spread the spam from other account or IP
address. Hence it is recommended to check for spam content in a tweet in
the server. If any content matches the spam words present in the data set it is
prevented from being displayed. Accuracy is being evaluated in classifying
the spam content. Many traditional classifiers are present in classifying
spammers from legitimate users but many classifiers wrongly classify non-
spammers as spammers. Hence it is efficient to check for spam content in
tweets.
REFERENCES
[1] M. McCord, M. Chuah, “Spam Detection on Twitter Using Traditional Classifiers”.
Lecture Notes in Computer Science, Volume 6906, pp. 175-186, September 2011.
[2] A. H. Wang, “Don‟t Follow me Spam Detection in Twitter”, Security and
Cryptography (SECRYPT). Proceedings of 5th
International Conference on Security
and Cryptography, July, 2010.
[3] Fabricio Benevenuto, Gabriel Magno, Tiago Rodrigues, and Virgilio Almeida,
”Detecting Spammers on Twitter”. CEAS 2010 Seventh annual Collaboration,
Electronic messaging, Anti Abuse and Spam Conference, July 2010.
[4] Puneeta Sharma and Sampat Biswas,”Identifying Spam in Twitter Trending Topics”.
American Association for Artificial Intelligence, 2011.
[5] “Levenshtein_distance”, http//en.wikipedia.org/wiki/Levenshtein_distance.
[6] ”Jaccard_Index”, http//en.wikipedia.org/wiki/Jaccard_index.
[7] Jonghyuk Song, Sangho Lee and Jong Kim, “Spam Filtering in Twitter using Sender-
Receiver Relationship”. Recent Advances in Intrusion Detection, Lecture Notes in
Computer Science, Volume 6961, pp 301-317, 2011
[8] D. Karthika Renuka, T. Hamsapriya, “Email classification for Spam Detection using
Word Stemming”. International Journal of Computer Applications 1(5), pg.45–47,
February 2010.
[9] ”Twitter_Spam_Rules”, http//support.twitter.com/articles/64986-reporting-spam-on-
twitter.
[10] S. L. Ting, W. H. Ip, Albert H. C. Tsang - “Is Naïve Bayes a Good Classifier for
Document Classification?”. International Journal of Software Engineering and Its
Applications, Vol. 5, No. 3, July 2011.
[11] R. Malarvizhi, K. Saraswathi. "Content - Based Spam Filtering and Detection
Algorithms - An Efficient Analysis & Comparison". International Journal of
Engineering Trends and Technology (IJETT), Volume 4, Issue 9, Sep 2013.
[12] N.S. Kumar, D. P. Rana, R. G. Mehta, “Detecting E-mail Spam Using Spam Word
Associations”, International Journal of Emerging Technology and Advanced
Engineering , Volume 2, Issue 4, April 2012.](https://image.slidesharecdn.com/vol14no1-july2014-171208072343/85/Vol-14-No-1-July-2014-104-320.jpg)
![International Journal of Computer Science and Business Informatics
IJCSBI.ORG
ISSN: 1694-2108 | Vol. 14, No. 1. JUNE-JULY 2014 102
[13] Zi Chu, Indra Widjaja, Haining Wang, “Detecting Social Spam Campaigns on
Twitter”. Lecture Notes in Computer Science, Volume 7341, pp. 455-472, 2012.
[14] Chris Grier, Kurt Thomas, Vern Paxson, Michael Zhang, “@spam: The Underground
on 140 Characters or Less”. Proceedings of the 17th
ACM conference on Computer and
Communications Security, ACM New York, NY, USA, 2010.
[15]Bin Zhou and Jian Pei, “Preserving Privacy in Social Networks Against Neighborhood
Attacks,”. Data Engineering, IEEE 24th
International Conference, April 2008.
This paper may be cited as:
Gowri, C. D. and Mohanraj, V., 2014. Spam Detection in Twitter - A
Review. International Journal of Computer Science and Business
Informatics, Vol. 14, No. 1, pp. 92-102.](https://image.slidesharecdn.com/vol14no1-july2014-171208072343/85/Vol-14-No-1-July-2014-105-320.jpg)