This document presents a case study on optimizing production costs at a t-shirt manufacturing plant in Sri Lanka using linear programming and the LINGO solver. It develops a mathematical model aimed at minimizing production costs while meeting operational constraints, analyzes the current inefficiencies, and proposes a sustainable solution. The findings and methodology demonstrate a structured approach to improving operational efficiency through resource optimization.


![International Journal of Computer Science and Business Informatics
IJCSBI.ORG
ISSN: 1694-2108 | Vol. 14, No. 2. AUGUST/SEPTEMBER 2014 2
Objective function is to be maximized or minimized subject to the
constraints which form a convex feasible region. An LPP can be solved
using an iterative algorithm known as the Simplex Algorithm which was
developed by Dantzig in 1950‟s. This is the most the widely used and
accepted algorithm to solve LPPs because of its simplicity. The optimal
solution of the objective function may be bounded or unbounded whereas
optimal solution to the decision variables may or may not be unique.
Linear Programming has a broader area of applications in the fields of
productions, telecommunications, transportations, scheduling etc. The main
focus of linear programming is to optimize the available resources in the
best possible manner while achieving the objective.
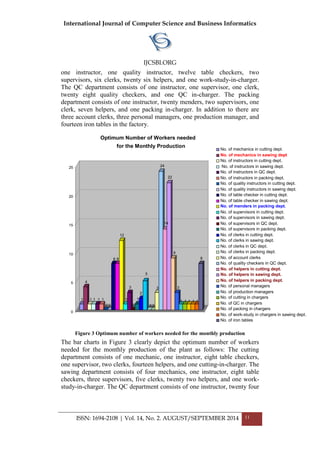
This research paper is focusing on optimizing production cost of a t-shirts
production plant which is located in Sri Lanka. Although the plant‟s
monthly target is 30,000 t-shirts, the records show that the target level has
not been reached in a regular basis. Also, it can be observed that the plant‟s
operational costs are mainly due to workers monthly payments which are
more than what is needed. Due to low productivity and unnecessary
expenditures, at present the plant is facing major financial difficulties and
several other problems in designing the production process. Therefore, the
management is interested in implementing a cost effective system to reduce
the production cost while improving the production efficiency of t-shirts. In
fact, in this research paper, a large scale linear programming model is
developed to achieve these objectives. Then LINGO SOLVER is used to
solve the developed large scale model.
The remainder of this paper is organized as follows: Related literature
review is given in section 2. Section 3 deals with the Methods and Materials
of the LPP. In section 4 the solution to the large scale LPP is summarized.
Finally, the conclusion given in section 5 highlights the limitations and
future research scope on the topic.
2. LITERATURE REVIEW
Linear Programming problem and its solution have been studied by many
authors. Few of them are James and Tom [5], Brain [1], Dantzig [2] and
Taha [13]. A number of computer software is available in obtaining the
solutions to LPP. Some are based on the simplex method and its variants,
e.g. CPLEX, LINDO, TORA, MATLAB, EXCEL SOLVER, AMPL and
LINGO, and some are based on the interior point algorithms, e.g. MOSEX.
See Fourer [3]. Though the software based on simplex method and its
variants have been used widely in solving linear programming problems,
they solve LPP in exponential time. An algorithm that solves LPP in](https://image.slidesharecdn.com/vol14no2-september2014-171208072404/85/Vol-14-No-2-September-2014-5-320.jpg)
![International Journal of Computer Science and Business Informatics
IJCSBI.ORG
ISSN: 1694-2108 | Vol. 14, No. 2. AUGUST/SEPTEMBER 2014 3
polynomial time is considered to be efficient. A first attempt of solving LPP
in polynomial time was the development of interior point algorithm by
Karmarkar [8]. How to solve a large scale LPP by interior point method
under MATLAB environment was proposed by Zhang [15]. The existing
interior point algorithms have some drawbacks such as extensive calculation
requirements, large number of iterations and large computer space
requirements. See Terlaky and Boggs [14].In addition, Hitchcock [4] was
first to develop the transportation model. After that, the transportation
problem, a special class of linear programming problem has been studied by
many researchers. Sharma and Sharma [12] presented the transportation
problem in a slightly different form in getting a dual problem which has a
special structure. Then they proposed a new solution procedure to solve the
dual of the incapacitated transportation problem. Sharma and Prasad [11]
presented a heuristic that provides a very good initial solution to the
transportation problem in polynomial time. Schrenk et al. [10] analyzed
degeneracy characterizations for two classical problems: the transportation
paradox in linear transportation problems and the pure constant fixed charge
(there is no variable cost and the fixed charge is the same on all routes)
transportation problems. A new result on complexity of the pure constant
fixed charge transportation problem has been proved. Liu [9] investigated
the transportation problem when the demands and supplies were varying
within their respective ranges. Following these variations the minimal total
cost were also varied within an interval. So, he built a pair of mathematical
programs where at least one of the supply or the demand was varying, to
compute the lower and the upper bounds of the total transportation cost.
Then the Lingo solver was used to solve the both mathematical programs to
attain the lower and the upper bounds of the minimal total transportation
costs. Juman and Hoque [7] demonstrated the deficiency of Liu‟s [9]
method in getting an upper bound of the minimal total costs of
transportation. Then they extended this Liu‟s model to include the inventory
costs of the product during transportation and at destinations, as they are
interrelated factors. In addition, they developed two new efficient heuristic
solution techniques - Algorithms 1 & 2 to find the upper and the lower
minimal total cost bounds respectively. By comparative studies of the
solution techniques on the solutions of small size numerical problems, it is
observed that our proposed heuristic technique (Algorithm1) performs the
same or significantly better in finding the upper bound of the minimal total
cost as compared with Liu‟s [9] approach. Algorithm 2 provided the same
lower bound of the minimal total costs to each of the numerical problems
studied as the one found by Liu‟s [9] approach. Moreover, numerical studies
demonstrated that the inclusion of inventory costs during transportation and
at destinations with the transportation costs changes the lower and the upper
minimal total cost bounds reasonably. Juman, Hoque and Bhuhari [6]](https://image.slidesharecdn.com/vol14no2-september2014-171208072404/85/Vol-14-No-2-September-2014-6-320.jpg)

![International Journal of Computer Science and Business Informatics
IJCSBI.ORG
ISSN: 1694-2108 | Vol. 14, No. 2. AUGUST/SEPTEMBER 2014 14
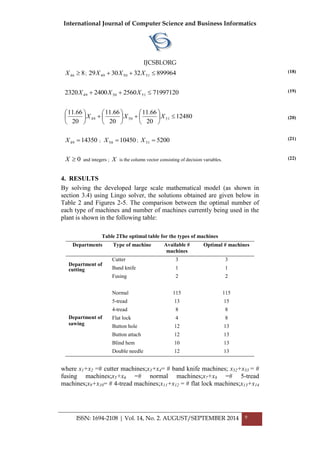
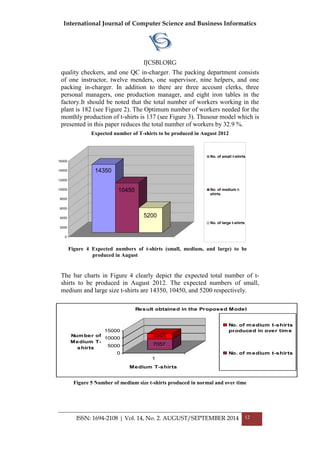
the t-shirts production within the specified period of time (one month). After
performing a sensitivity analysis, it was revealed that the production plant
needs at least 22760 meters of raw material to meet the given target.
In this research only the production cost is considered while assuming that
the monthly demand is a fixed quantity. But, in practice, for the manufacture
(production plant), there are setup costs and inventory costs of raw-material,
work-in-process and finished goods as well. In addition, buyers incur
transportation costs, ordering costs and inventory costs during transportation
and at the destination (buyer/retailer). Thus, future research might be carried
out by taking these costs of setup, inventory, ordering and transportation
into account. Also, demand can be considered as stochastic. Hence, an
integrated single-manufacture-multi-buyer model with stochastic demand
can be obtained. How to develop a streamline method to tackle this large
scale LPP after considering these costs is challenging and potential future
research.
ACKNOWLEDGMENTS
The authors acknowledge that this research is supported by the research
grant of University of Peradeniya, Sri Lanka. Also, they are grateful to the
referees for their valuable, constructive commentsand suggestions.
REFERENCES
[1] Brain, D.B. Basic Linear Programming. London, Spottiswoode Ballantyne Ltd,1984.
[2] Dantzig, G.B. Linear Programming and extensions. Princeton, NJ: Princeton
University press, 1963.
[3] Fourer, R. Survey of linear programming software. OR/MS today, (2001), pp. 58-68.
[4] Hitchcock, F.L. The distribution of a product from several sources to numerous
locations. Journal of mathematical physics, 20, (1941), pp. 224-230.
[5] James, P.I. and Tom, M.C. Linear Programming. Prentice, Hall, Inc, 1994.
[6] Juman, Z.A.M.S., Hoque, M.A. and Buhari, M.I.A sensitivity analysis and an
implementation of the well-known Vogel‟s approximation method for solving
unbalanced transportation problems. Malaysian Journal of Science, 32,1(2013), pp. 66-
72.
[7] Juman, Z.A.M.S., Hoque, M.A. A heuristic solution technique to attain the minimal
total cost bounds of transporting a homogeneous product with varying demands and
supplies. European Journal of Operational Research, 239, (2014)pp. 146-156.
[8] Karmarkar, N. A new polynomial time algorithm for linear programming.
Combinatorial, 4, (1984), pp. 373-395.
[9] Liu, S.T. The total cost bounds of the transportation problem with varying demand and
supply.Omega, 31,(2003), pp.247-251.](https://image.slidesharecdn.com/vol14no2-september2014-171208072404/85/Vol-14-No-2-September-2014-17-320.jpg)
![International Journal of Computer Science and Business Informatics
IJCSBI.ORG
ISSN: 1694-2108 | Vol. 14, No. 2. AUGUST/SEPTEMBER 2014 15
[10]Schrenk, S., Finke, G and Cung, V.D. Two classical transportation problems revisited:
Pure constant fixed charges and the paradox. Mathematical and Computer Modeling,
54,(2011), pp. 2306-2315.
[11]Sharma, R.R.K. and Prasad, S. Obtaining a good primal solution to the uncapacitated
transportation problem. European Journal of Operational Research, 144, (2003) , pp.
560-564.
[12]Sharma, R.R.K and Sharma, K.D. A new dual based procedure for the transportation
problem. European Journal of Operational Research, 122, 3 (2000),pp. 611-624.
[13]Taha H. A. Operation Research: An introduction. Prentice-Hall of India, 8th
edition,
2006.
[14]Terlaky, T. and Boggs, P.T. Interior point method. Faculty of information technology,
Delft. Netherlands, 2005.
[15]Zhang, Y. Solving large scale linear programming by interior point method under
MATLAB environment. Technical report, Mathematics Department, University of
Maryland, Baltimore Country, 1996.
This paper may be cited as:
Juman, Z. A. M. S. and Daundasekara, W. B., 2014. An Optimal Solution to
the Linear Programming Problem using Lingo Solver: A Case Study of an
Apparel Production Plant of Sri Lanka. International Journal of Computer
Science and Business Informatics, Vol. 14, No. 2, pp. 1-15.](https://image.slidesharecdn.com/vol14no2-september2014-171208072404/85/Vol-14-No-2-September-2014-18-320.jpg)
![International Journal of Computer Science and Business Informatics
IJCSBI.ORG
ISSN: 1694-2108 | Vol. 14, No. 2. AUGUST/SEPTEMBER 2014 17
Latest mobile devices provide most of the functionalities of traditional
computers.Moreover, various wireless communication functionalities such
as GSM, UMTS, EDGE, and GPRS are also provided. Various networking
functionalities such as Infrared, Bluetooth, Wireless LAN IEEE 802. have
improved usability of smart phones. GPS is added advantage to
communication & network functionalities. SMS, MMS, and calling are the
basic facilities of mobile phones. All these basic and additional features
have increased the danger of malware which was originally targeting
computers only. The malware targeting mobile phones is popularly known
as mobile malware. It has become very hazardous threat to mobile phones.
According to recent Kaspersky researches it is stated as ‘Serious business’.
It is no longer fun and games. The damage made by mobile malwares is too
severe to overlook, which includes stealing of one’s private data from
device, snooping of ongoing conversations, charging excess money by
sending SMS to premium rate numbers, and sometimes even a location
tracing of user. So, here comes the time to be exceptionally cautious about
mobile malware &understanding various ways of mobile malware
propagation, detect the mobile malware, and control its propagation. SMS &
Bluetooth are the two major communication channels used by mobile
malware for propagation mechanism. Cloud based detection is one of the
efficient way to detect mobile malware. After a malware is detected,
updated security patch is used to restrain the mobile malware propagation.
2. RELATED WORKS
Many researchers have implemented different mobile networks to study
mobile malware propagation. Chao Gao and Jiming Liu (2013)[2], [3] have
implemented a two layer generalized social network model which consists
of two layers viz. Geographical layer and logical contact layer. BT based
malware propagates in geographical layer whereas SMS based malware
propagates in logical contact layer. They also demonstrate the effect of
mobility & operational behavior of mobiles [4], [5], [6], [8], [9]. Shin-Ming
Cheng et al. (2011)[1] have implemented the approach where malware
propagation is studied on generalized social network model. It has two
layers as personal social network & spatial social network. It shows the
propagation of hybrid malware that can propagate by either end-to-end
messaging service or by short-range wireless communication [6], [9].
Guanhua Yan and Stephan Eidenbenz (2009) [9] have specifically modeled
propagation of Bluetooth worms. A comprehensive model showing
propagation dynamics of Bluetooth worms is proposed. This model can also
predict the spreading curves of Bluetooth worm. Due to discrete-event
simulation the computational cost incurred is quite less.](https://image.slidesharecdn.com/vol14no2-september2014-171208072404/85/Vol-14-No-2-September-2014-20-320.jpg)
![International Journal of Computer Science and Business Informatics
IJCSBI.ORG
ISSN: 1694-2108 | Vol. 14, No. 2. AUGUST/SEPTEMBER 2014 18
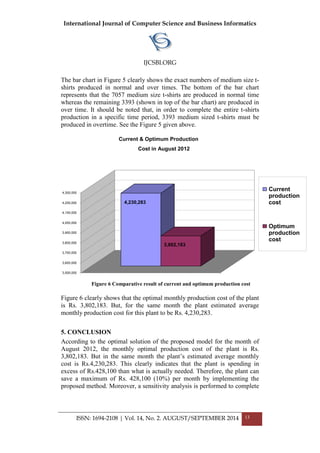
3. METHODOLOGY
First of all, a mobile network is implemented which is further used to study
propagation of mobile malware [2], [3], [7]. Mobile network is also known
as generalized social network. It is formed from cell towers, gateways &
mobile nodes. Tower acts as a head node for particular cluster & serves the
mobile nodes working under it. Each tower has givena specific range value
which determines the service area of specific tower. Gateways are used for
the data transfer from one cluster to another cluster [7]. Mobile nodes are
the mobile devices working under cell towers. These mobile nodes keep
moving in the network. It has properties such as identification number,
location data associated with it & buffer memory to store a data. SMS &
Bluetooth based mobile malware propagation is shown on the network.
Once the malware is propagated, next obvious step is to detect it. Signatures
are used to detect the mobile malware. Signature matching is performed on
externally implemented server which is separated from the mobile network.
This malware detection technique comes under cloud based mobile malware
detection where malware is detected on some external server & not on the
mobile device itself. When a message is sent from one device to another
device, suspicious activity logs are sent to this external server. When some
predefined numbers of logs come from a specific device & signature
matches, then that device is declared as malicious or attacker device.
Malicious devices’ details are sent back to mobile network in the form of
patch. When such infected node tries to send data to any other nodes, the
patch restrains other nodes from accepting the data. In this way the mobile
malware propagation is controlled.
Figure 1. System Architecture](https://image.slidesharecdn.com/vol14no2-september2014-171208072404/85/Vol-14-No-2-September-2014-21-320.jpg)
![International Journal of Computer Science and Business Informatics
IJCSBI.ORG
ISSN: 1694-2108 | Vol. 14, No. 2. AUGUST/SEPTEMBER 2014 19
3.1 Mobile Malware Propagation Techniques
Based on communication media, mobile malware has 2 types: BT based
malware & SMS based malware.
3.1.1 SMS based malware
SMS based mobile malware propagation does not have a geographical
boundary restrictions. A SMS based malware can propagate from one
device to other devices which are millions of kilometers farther. So this may
create havoc. Operational behavior of users plays an important role in
malware propagation. The pclick parameter associated with each device
determines the message clicking probability of user. Low the message
clicking probability, high the security awareness & less the infection of
malware. The following algorithm is implemented to study SMS based
mobile malware propagation [2], [3], [7], [8].
Algorithm 1: SMS based mobile malware propagation
I/P: G[N][N], T[Nt], P[Np]
O/P: SMSMCount[Step][K] stores the number of infected phones in the
K’th time
// Phase I: Initializing the smart phones
1. Propagation_SMS_InitPhone( );
// Phase II: SMS-based virus propagation
2. For K=1 to Runtime // run 10 times
3. While (Step<Endsimul) // 500 steps
4. For I=1 to Np
5. Check _Power_On(Vi.On-Off);
6. If Vi.Ton>0 && Vi.On-Off==true
7. Probability← The message clicking probability based on
Vi.Pclick
8. Send copies of virus to all users in its contact book;
9. SumI++; // Infected phones total
10. EndIf
11. EndFor
12. SMSMCount[Step][K]=SumI;
13. Step++;
14. EndWhile
15. EndFor](https://image.slidesharecdn.com/vol14no2-september2014-171208072404/85/Vol-14-No-2-September-2014-22-320.jpg)
![International Journal of Computer Science and Business Informatics
IJCSBI.ORG
ISSN: 1694-2108 | Vol. 14, No. 2. AUGUST/SEPTEMBER 2014 20
3.1.2 Bluetooth based malware
A BT-based malware is able to infect its geographical neighbors with same
Operating System. When a phone is infected with Bluetooth based malware,
it automatically turns on the Bluetooth service of itself. Then, the infected
phone arbitrarily picks out a susceptible phone as its target. Susceptible
phones are the mobile devices in the vicinity of infected mobile phone
having its Bluetooth on. Now the infected phone sends out the mobile
malware to such susceptible phones present in its Bluetooth range. The
following algorithm is implemented to study Bluetooth based mobile
malware propagation [2], [3], [7], [8].
Algorithm 2: BT based mobile malware propagation
I/P: G[N][N], P[Np], GridData
O/P: BTMCount[step][k] infected phone count in the k’th simulation
// Phase I: Initializing the state of cell towers and phones
1. Propagation_BT_init( );
// Phase II: BT-based malware propagation
2. For k=1 to Runtime // 10 run to obtain an average value
3. While(step<Endsimul) // 500 steps at each time, i.e.,Endsimul=500
4. For i=1 to Nt;
5. If Ti.ntp>0 && Ti.infectedBT phone!=0 then
6. vit=vit+BT_SIR(Ti); // SIR model in each cell tower
7. EndIf
8. EndFor
9. BTMCount[step][k]=vit;
10. Human_Mobility(step); // Simulating users’ mobility
11. step++;
12. EndWhile
13. EndFor
3.2 Mobile Malware Detection
Mobile phones have limited computational capabilities & power. So it is not
economical as well as feasible to run a full-fledged and well developed
security mechanism on mobile phone itself. Cloud-based mobile malware
detection is the best option for mobile phones in which security analysis &
computations are moved to the remote server known as cloud [7]. Signature
based mobile malware detection is implemented here. In this a client sends
suspicious pattern through log to the cloud. This is known as signatures.
When enough numbers of such logs are found in the cloud and if a signature
is same in all the cases, the node is declared as malicious and further activity
by that node is blocked.](https://image.slidesharecdn.com/vol14no2-september2014-171208072404/85/Vol-14-No-2-September-2014-23-320.jpg)
![International Journal of Computer Science and Business Informatics
IJCSBI.ORG
ISSN: 1694-2108 | Vol. 14, No. 2. AUGUST/SEPTEMBER 2014 21
3.3 Mobile Malware Control
Till now we have studied mobile malware propagation & detection. Along
with detecting mobile malware, there is a need to control its propagation.
Basically, there are two types of malware control strategies, viz. proactive &
reactive control. Proactive control strategy is used before actual malware is
detected. Whereas reactive malware strategy is implemented after certain
malware is detected. We have used reactive control strategy here means
when a malware is detected then the control strategy is implemented. So
when any new malware is found, antivirus updates for that malware are
implemented and forwarded to mobile network & from there to mobile
phones. This process is known as patch dissemination [2], [3], [4], [5], [7].
4. IMPLEMENTATION
This system is implemented in total 4 modules. Mobile network & cloud
server are the two basic modules. Mobile network consists of simulated cell
towers, gateway nodes, & mobile devices. It is formed from the initial
number of nodes count given by user [7]. Suppose a user says he wants to
form a network of 100 nodes then a mobile network of 100 nodes consisting
of cell towers, gateways, &mobile devices is formed. SMS & Bluetooth
based mobile malware propagation is studied on this network. Figure 2
shows cell towers & gateways in Red & Yellow color nodes respectively.
Mobile nodes are in various colors except Red & Yellow. Cloud server, the
second module, detects mobile malware, sends updated security patched to
mobile network & thus helps in control of mobile malware propagation.
Both these modules are implemented in J2SE. RMI plays a major role in
message passing between various objects.
The novelty of the system lies in third & fourth modules. Third module
synchronizes a real-time Android device with one of the simulated random
mobile nodes from mobile network. Fourth module is a web service that
does the job of communication between simulated mobile node & real-time
Android device. Synchronization is nothing but the activities happened on
the simulator nodes are replicated on real-time Android device & vice versa.
The activities consist of data packets received on simulated mobile node &
location change of Real-time Android device. Third module is implemented
as an App for Android device. The App accesses GPS co-ordinates of
Android device so the location is synchronized. Fourth module is a web
service implemented using J2EE, SOAP, HTML, and XML. SOAP is used
for communication between Android device & web service. HTML & XML
is also used for data transfer & data encoding respectively.](https://image.slidesharecdn.com/vol14no2-september2014-171208072404/85/Vol-14-No-2-September-2014-24-320.jpg)

![International Journal of Computer Science and Business Informatics
IJCSBI.ORG
ISSN: 1694-2108 | Vol. 14, No. 2. AUGUST/SEPTEMBER 2014 24
spreading patterns & severity of mobile malware. This paper concludes that
the attention is needed over mobile malware propagation especially SMS
based mobile malware & preventive measures to control the malware
propagation.
REFERENCES
[1] Cheng, S., Ao, W. C., Chen, P., Chen, K., 2011. On Modeling Malware Propagation in
Generalized Social Network, IEEE Comm. Letters, Vol. 15, No. 1, pp. 25-27.
[2] Gao, C., and Liu, J., 2013. Modeling and Restraining Mobile Virus Propagation, IEEE
transactions on mobile computing, Vol. 12, No. 3, pp. 529-541.
[3] Gao, C., and Liu, J., 2013. Modeling and Restraining Mobile Virus Propagation.
(Supplementary File), IEEE Trans. Mobile Computing.
[4] Gao, C., Liu, J., and Zhong, N., 2011. Network Immunization and Virus Propagation in
Email Networks: Experimental Evaluation and Analysis, Knowledge and Information
Systems, Vol. 27, No. 2, pp. 253-279.
[5] Gao, C., Liu, J., and Zhong, N., 2011. Network Immunization with Distributed
Autonomy-Oriented Entities, IEEE Trans. Parallel and Distributed Systems, Vol. 22, No. 7,
pp. 1222-1229.
[6] Meng, X., Zerfos, P., Samanta, V., Wong, S.H., and Lu, S., 2007. Analysis of the
Reliability of a Nationwide Short Message Service, Proc. IEEE INFOCOM, pp. 1811-1819.
[7] Mohite, S., and Sonar, R.S., 2014. Proliferation, Detection, and Suppression of Mobile
Malware, Cyber Times International Journal of Technology and Management, ISSN: 2278-
7518, Vol. 7, Issue 1, pp. 129-134.
[8] Wang, P., Gonzalez, M.C., Hidalgo, C.A., and Barabasi, A.L., 2009. Understanding the
Spreading Patterns of Mobile Phone Viruses, Science, Vol. 324, No. 5930, pp. 1071-1076.
[9] Yan, G., and Eidenbenz, S., 2009. Modeling Propagation Dynamics of Bluetooth
Worms (extended version), IEEE transactions on Mobile Computing, Vol. 8, No. 3, pp.
353-368.
This paper may be cited as:
Sonar, R. S. and Sonal, M., 2014. Analysis of BT and SMS based Mobile
Malware Propagation. International Journal of Computer Science and
Business Informatics, Vol. 14, No. 2, pp. 16-24.](https://image.slidesharecdn.com/vol14no2-september2014-171208072404/85/Vol-14-No-2-September-2014-27-320.jpg)
![International Journal of Computer Science and Business Informatics
IJCSBI.ORG
ISSN: 1694-2108 | Vol. 14, No. 2. AUGUST/SEPTEMBER 2014 25
Behavioral Pattern of Internet Use
among University Students of Pakistan
Amir Manzoor
PhD Scholar
Management Sciences Department
Bahria University, Karachi, Pakistan
ABSTRACT
This study uses a survey to analyze the behavioral pattern of Internet usage of university
students. The results show that most students used Internet as a support tool for their
academic and research work. The students accessed Internet mostly from their personal
computers and had multiple years of experience using Internet. Ease of work and time
saving were the most cited reasons for Internet use. The findings of the study provide
significant implications for the academicians, practitioners, and government policy makers.
Keywords
Internet, Students, User studies, Pakistan
1. INTRODUCTION
The rapidly increasing use of Internet in our daily lives is producing direct
impact on people behavior. Internet has affected almost every area of our
daily lives including system of higher education. The advances in internet
related technologies have given rise to new and innovative teaching
strategies using technology integration in the process of learning. Internet
use has become an integral element of the daily lives of higher education
students across the globe. For these students, internet is great functional tool
that has significantly altered the way they interact with their peers and
information in academia. Internet technologies, such as news groups bulletin
boards, social networking sites etc., are now commonly used by students to
stay in touch with their peers, prepare assignments, make notes, term
projects and exchange of emails [1] [2][3][4]. According to [5] there exists
various reasons for such widespread use of internet among higher education
institutions some of the reasons include ease of idea sharing with others
enhanced information sharing ability to perform multidisciplinary research
and less time required to produce & utilize knowledge.
In Pakistan, first Internet connection and first broadband connection were
given in 1995 and 2002 respectively. According to Pakistan
Telecommunication Authority (PTA), the broadband subscribers in Pakistan
were projected to surpass 0.64 million by 2009. Pakistan](https://image.slidesharecdn.com/vol14no2-september2014-171208072404/85/Vol-14-No-2-September-2014-28-320.jpg)
![International Journal of Computer Science and Business Informatics
IJCSBI.ORG
ISSN: 1694-2108 | Vol. 14, No. 2. AUGUST/SEPTEMBER 2014 26
Telecommunication Authority, since its inception, followed various
deregulation policies. PTA issued broadband licenses to many private
companies in 2004. In the after math of this deregulation policy, two types
of players dominated the broadband Internet market in Pakistan. The first
type consisted of players that competed on same access technology. The
second type consisted of players that dominated in a particular type of
access technology. Fixed line penetration remained a significant issue in
Pakistan. The fixed line penetration was expected to drop from 3.5% in
2009 to 2.8% in 2011. The Pakistan telecom industry, especially the mobile
telecom sector, saw sustained growth in the last years. By 2007, mobile
phone subscribers in Pakistan reached 77 million. The broadband Internet
market also witnessed great technological and strategic transformation and
competition intensified. Many new players entered into the market such as
Qubee (a wireless broadband Internet service provider). PTA further opted
for issuing soft licenses and relaxed terms of conditions for service
providers. This approach, aimed at facilitating access to a wide range of
broadband, was successful and many service providers introduced latest
technologies such as DSL, WiMAX, FTTH, EvDO, HFC, VDSL2 in the
broadband Internet market [6].
In Pakistani Universities, access to the internet is generally provided at
various access points in the Universities such as Cafeteria and Campus
Library Members of the University community can access internet either
using there access points or from their departments, with increased
availability of Internet access, significant increase in demand of internet
access has been witnessed. Many Universities have laid down their own
fiber optic cable network and significantly increased the number of modern
computers available for student community use. Internet bandwidths have
been significantly enhanced with recent achievement of four Mbps
bandwidth for every broadband user of PTCL.
2. LITERATURE REVIEW
Many studies on Internet use have found internet use most prevalent among
young highly educated people [7] [8] [9]. Investigating the internet use
among students in an ethnic context [10] reported that availability of
computer at home accelerated the use of internet. In another study of
internet use among university students [11] reported that 40.2% respondents
accessed internet daily while 38% accessed it weekly only 10% respondents
seldom or never accessed internet 83% students and faculty accessed the
internet to search academic information. Investigating internet use among
Australian students [12] reported that 88% students accessed internet to
search course related information A significant majority of students
accessed the Internet either from their homes or university computer labs](https://image.slidesharecdn.com/vol14no2-september2014-171208072404/85/Vol-14-No-2-September-2014-29-320.jpg)
![International Journal of Computer Science and Business Informatics
IJCSBI.ORG
ISSN: 1694-2108 | Vol. 14, No. 2. AUGUST/SEPTEMBER 2014 27
most students learnt to use the internet themselves ore through their families
and friends in an study of internet UK among male & female students of a
large US Universities [13] reported that while the gender gap in internet use
was minimal there existed differences in the ways male and female students
used internet. According to [14], students wed internet for general or
recreational purposes and did not realize the potential support provided by
internet for their academic activities. According to [15] internet played an
important role in their education and significantly affected their college
lives. [16] supported this finding by reporting that most student used
internet at home for information search and regards internet as a credible
easy to understand beneficial source of information [1]. [17] found that a
significant majority of students had positive attitude about internet &
regarded the internet as a universal fast gateway to knowledge that provides
ease in life. [18] and [19] found that most students used internet for
academic purposes and perceived it as sources of latest knowledge.
There exist very few studies on internet use by Pakistani students. Existing
studies include [20] [21] [22]. Analyzing Internet use among Pakistani teens
and adults [21] found that majority of users used Internet for academic
purposes. Users perceived Internet as a source of information for public.
Studying the impact of excessive Internet use on undergraduate students,
[16] found that a majority of students experienced positive impacts of
Internet use and they used Internet to enhance their academic
skills.[22]found that most students used Internet for course related activities
and research. Ease of work and time saving were the most cited reasons for
using Internet.
3. METHODOLOGY
The aim of this study was to analyze behavioral pattern of Internet use by
Pakistani university students. To achieve this goal, a survey questionnaire
was developed. The survey questions were adopted and modified from [23]
[24] [25]. The study population consisted of a convenience sample of 300
undergraduates from various universities of Pakistan. The survey responses
were analyzed using SPSS Version 20 software. Reliability of the
instrument was estimated using Cronbach’s coefficient (alpha). The
value of Cronbach’s coefficient was 0.85 that shows internal consistency of
the research instrument used in this study.
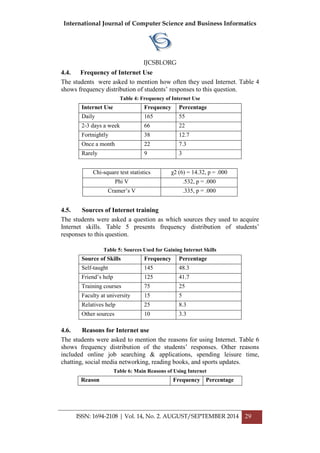
4. ANALYSISOFDATA
4.1. General Information about Respondents
Table 1 shows the frequency distribution of respondents’ profile
information.
Table 1: Respondents Profile
Age 18-25 Years (92 %), 26-30 Years (8%)](https://image.slidesharecdn.com/vol14no2-september2014-171208072404/85/Vol-14-No-2-September-2014-30-320.jpg)
![International Journal of Computer Science and Business Informatics
IJCSBI.ORG
ISSN: 1694-2108 | Vol. 14, No. 2. AUGUST/SEPTEMBER 2014 32
Chi-square test statistics χ2 (6) = .619, p = .996.
Phi V .052, p = .996
Cramer’s V .037, p = .996
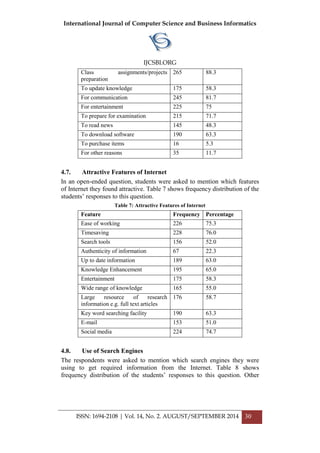
5. DISCUSSION
The results of this study provide mixed findings compared with previous
studies done on Internet use in other countries. Consistent with the findings
of other studies [26] [27] [28], the use of Internet in Pakistan has become
part of daily lives of a large number of students. Most university started
using the Internet since last five years or more. A significant majority of
students have Internet access via their personal computers. It is interesting
to note that these students do not utilize the Internet facility available at their
universities. These findings show increased ability of students to access and
use Internet and related technologies. Similar to the students of developed
world, a significant majority of students in Pakistan are found to use Internet
daily. It appears that the issue of unavailability and unfamiliarity of the
Internet among Pakistani students [22] has now been resolved.
Consistent with the trend found by [22], a very significant majority of
students still learn to use the Internet tools by themselves, or relying on
assistance from friends. The second significant source of learning was
training courses while a very small proportion of students sought assistance
from university faculty or relatives to learn Internet use.
Findings indicate a significant use of Internet by students as an academic
studies and research support tool. Communication, entertainment, and
software downloading were also mentioned as important uses of Internet by
students. This finding is consistent with the finding of [29] [30] [31] [32]
[33]. Very few students used Internet to purchase items. One possible
explanation is that these students do not have enough financial resources at
their own to make purchases online.
Consistent with the findings of [22], Pakistani students still regard Internet
as a tool that provide ease of work and time savings. One other significant
trend emerged from the results is the increased perceived importance of
social media as one of the attractive features of the Internet. This finding is
consistent with the finding of [26] that found use of Social Networking Sites
(SNS) has become part of daily lives students around the globe.
The results about the popularity of the search engines are consistent with the
global rating of search engines by [34] that ranked Google as the top search
provider followed by Yahoo. The results about the popularity of the free
web-based email service are consistent with the global rating of free email](https://image.slidesharecdn.com/vol14no2-september2014-171208072404/85/Vol-14-No-2-September-2014-35-320.jpg)
![International Journal of Computer Science and Business Informatics
IJCSBI.ORG
ISSN: 1694-2108 | Vol. 14, No. 2. AUGUST/SEPTEMBER 2014 33
services by [35] that ranked Gmail as the top free email provider followed
by Yahoo and Microsoft Outlook.
Supporting the findings of [22], this study found that more than two third
majority of the students used the digital library facility provided by HEC.
Statistics shows that no statistically significant association (i.e. insignificant
χ2 statistic) exists between household employment status and Internet
access. Statistics show that no significant statistical association (i.e.
insignificant χ2 statistic) exists between students’ use of HEC digital library
and Internet access. However, statistically significant association (i.e.
insignificant χ2 statistic) exists among students’ Internet access and their
use of e-mail services, frequency of Internet use, and students experience
with Internet.
6. CONCLUSION
It can be concluded that Pakistani students are less likely to go and seek help
from the faculty/staff at university to learn using the Internet. However, they
are likely to attend the training courses on Internet use. The increased
reliance on Internet as an academic studies and support research tool is also
a significant trend that needs to be watched and monitored carefully by the
academicians, practitioners, and policy makers.
7. IMPLICATIONS OF THE STUDY
This study has significant implications for the academicians, practitioners,
and government policy makers. The trends found are significant and there is
a need continue monitoring students’ usage and attitudes toward the
Internet. It is also important that current non-Internet users should be
investigated to find out the reasons of non-use in spite of efforts made by the
university authorities and government. Students’ use of the training courses
to learn Internet implies need of further strengthening the curriculum of the
training courses better meeting the diverse needs of the students. Training
providers can play an important role in this regard.
8. LIMITATIONS AND FUTURE RESEARCH AREAS
Limitations of current study include a relatively small sample of students
limited to one country. The results may not be generalizable to students at
other universities or other countries. Future research may investigate the
reasons for use and non-use of Internet in cross-cultural settings and
heterogeneous samples of users with different age groups and settings.](https://image.slidesharecdn.com/vol14no2-september2014-171208072404/85/Vol-14-No-2-September-2014-36-320.jpg)
![International Journal of Computer Science and Business Informatics
IJCSBI.ORG
ISSN: 1694-2108 | Vol. 14, No. 2. AUGUST/SEPTEMBER 2014 34
REFERENCES
[1] Asan, A., &Koca, N. (2006). An analysis of students’ attitudes towards
[2] Ilomäki, L., Rantanen, P., 2007.Intensive use of ICT in school: Developing differences in
students’ ICT expertise. Computers & Education 48, 119–136.
doi:10.1016/j.compedu.2005.01.003
[3] Hakkarainen, K., Ilomäki, L., Lipponen, L., Muukkonen, H., Rahikainen, M., Tuominen,
T., Lakkala, M., Lehtinen, E., 2000.Students’ skills and practices of using ICT: results of a
national assessment in Finland. Computers & Education 34, 103–117. doi:10.1016/S0360-
1315(00)00007-5
[4] Gomez, R.G., 2012.Adherence to the Use of ICT for Classroom Instruction: Its Impact on
students’ Learning. IAMURE: International Journal of Education 2.
[5] Usun, S. (2003). Undergraduate students attitudes towards educational uses of Internet.
Interactive Educational Multimedia, 7, 46-62.
[6] Manzoor, A. (2012). Broadband Internet Development and Economic Growth: A
Comparative Study of Two Asian Countries. IOSR Journal of Business and Management
(IOSRJBM), 1(6), 01-14.
[7] Hoffman, D.L., Novak, T.P., Schlosser, A., 2000. The Evolution of the Digital Divide:
How Gaps in Internet Access May Impact Electronic Commerce. Journal of Computer-
Mediated Communication 5, 0–0. doi:10.1111/j.1083-6101.2000.tb00341.x
[8] Mythily, S., Qiu, S., Winslow, M., 2008.Prevalence and correlates of excessive Internet use
among youth in Singapore. Ann. Acad. Med. Singap. 37, 9–14.
[9] Ybarra, M.L., Mitchell, K.J., 2004.Youth engaging in online harassment: associations with
caregiver–child relationships, Internet use, and personal characteristics. Journal of
Adolescence 27, 319–336. doi:10.1016/j.adolescence.2004.03.007
Internet. Fourth International Conference on Multimedia and Information and
Communication Technologies in Education, Seville, Spain.
[10] Korgen, Kathleen, Patricia Odell, and Phyllis Schumacher. "Internet use among college
students: Are there differences by race/ethnicity." Electronic Journal of Sociology 5, no. 3
(2001).
[11] Bao, X.-M., 1998. Challenges and Opportunities: A Report of the 1998 Library Survey of
Internet Users at Seton Hall University. Coll. res. libr.59, 534–542.
[12] Foster, S., 2000.Australian undergraduate Internet usage: self-taught, self-directed, and self-
limiting? Education and Information Technologies 5, 165–175.
doi:10.1023/A:1009602617991
[13] Odell, P.M., Korgen, K.O., Schumacher, P., Delucchi, M., 2000. Internet Use Among
Female and Male College Students. Cyber Psychology& Behavior 3, 855–862.
doi:10.1089/10949310050191836](https://image.slidesharecdn.com/vol14no2-september2014-171208072404/85/Vol-14-No-2-September-2014-37-320.jpg)
![International Journal of Computer Science and Business Informatics
IJCSBI.ORG
ISSN: 1694-2108 | Vol. 14, No. 2. AUGUST/SEPTEMBER 2014 35
[14] Tadasad P., G., Maheswarappa B S, Allur, S.A., 2003. Use of Internet by Undergraduate
Students of PDA College of Engineering, Gulbarga. Annals of Library and Information
Stuides 50, 31–42.
[15] Jones, Steve, and Mary Madden. The Internet goes to college: How students are living in
the future with today’s technology. Washington, DC: Pew Internet and American Life
Project.Vol. 71.Report, 2002.
[16] Rhoades, E.B., Irani, T., Telg, R., Myers, B.E., Rhoades, E.B., Irani, T., Telg, R., Myers,
B.E., 2008. Internet as an Information Source: Attitudes and Usage of Students Enrolled in
a College of Agriculture Course. Journal of Agricultural Education 49, 108–117.
[17] Hong, Kian-Sam, Abang Ahmad Ridzuan, and Ming-Koon Kuek. "Students' attitudes
toward the use of the Internet for learning: A study at a university in Malaysia."
Educational Technology & Society 6, no. 2 (2003): 45-49.
[18] Anunobi, C.V., 2006.Dynamics of internet usage: A case of students of the Federal
University of Technology Owerri (FUTO) Nigeria. ERR 1, 192–195.
[19] Sharma, R., Verma, U., Sawhney, V., Arora, S., & Kapoor, V. (2006).Trend of Internet use
among medical students. JK Science: Journal of Medical Science & Research, 8 (2), 101-
102.
[20] Rajani, M. K., & Chandio, M. S. (2004). Use of Internet and its effects on our Society.In
Proceedings of the National Conference on Emerging Technologies (NCET), December 18-
19, 2004, Karachi, Pakistan (pp. 157-161).
[21] Suhail, K., Bargees, Z., 2006.Effects of Excessive Internet Use on Undergraduate Students
in Pakistan.CyberPsychology& Behavior 9, 297–307. doi:10.1089/cpb.2006.9.297
[22] Sakina, B., Khalid, M., Farzana, S., 2008. Internet Use Among University Students: A
Survey in University of the Punjab, Lahore [WWW Document]. Pakistan journal of library
& information science. URL http://eprints.rclis.org/19027/ (accessed 6.30.14).
[23] Gross, E.F., 2004. Adolescent Internet use: What we expect, what teens report. Journal of
Applied Developmental Psychology, Developing Children, Developing Media - Research
from Television to the Internet from the Children’s Digital Media Center: A Special Issue
Dedicated to the Memory of Rodney R. Cocking 25, 633–649.
doi:10.1016/j.appdev.2004.09.005
[24] Gross, E.F., Juvonen, J., Gable, S.L., 2002. Internet Use and Well-Being in Adolescence.
Journal of Social Issues 58, 75–90. doi:10.1111/1540-4560.00249
[25] Wang, R., Bianchi, S.M., Raley, S.B., 2005. Teenagers’ Internet Use and Family Rules: A
Research Note. Journal of Marriage and Family 67, 1249–1258. doi:10.1111/j.1741-
3737.2005.00214.x
[26] Pempek, T.A., Yermolayeva, Y.A., Calvert, S.L., 2009. College students’ social networking
experiences on Facebook. Journal of Applied Developmental Psychology 30, 227–238.
doi:10.1016/j.appdev.2008.12.010](https://image.slidesharecdn.com/vol14no2-september2014-171208072404/85/Vol-14-No-2-September-2014-38-320.jpg)
![International Journal of Computer Science and Business Informatics
IJCSBI.ORG
ISSN: 1694-2108 | Vol. 14, No. 2. AUGUST/SEPTEMBER 2014 36
[27] Pai, P., Arnott, D.C., 2013. User adoption of social networking sites: Eliciting uses and
gratifications through a means–end approach. Computers in Human Behavior 29, 1039–
1053. doi:10.1016/j.chb.2012.06.025
[28] Kross, E., Verduyn, P., Demiralp, E., Park, J., Lee, D.S., Lin, N., Shablack, H., Jonides, J.,
Ybarra, O., 2013. Facebook Use Predicts Declines in Subjective Well-Being in Young
Adults. PLoS ONE 8, e69841. doi:10.1371/journal.pone.0069841
[29] Baker, R.K., White, K.M., 2010. In Their Own Words: Why Teenagers Don’t Use Social
Networking Sites. Cyberpsychology, Behavior, and Social Networking 14, 395–398.
doi:10.1089/cyber.2010.0016
[30] Cheung, C.M.K., Chiu, P.-Y., Lee, M.K.O., 2011. Online social networks: Why do students
use facebook? Computers in Human Behavior, Social and Humanistic Computing for the
Knowledge Society 27, 1337–1343. doi:10.1016/j.chb.2010.07.028
[31] Roblyer, M.D., McDaniel, M., Webb, M., Herman, J., Witty, J.V., 2010.Findings on
Facebook in higher education: A comparison of college faculty and student uses and
perceptions of social networking sites. The Internet and Higher Education 13, 134–140.
doi:10.1016/j.iheduc.2010.03.002
[32] Bosch, T.E., 2009. Using online social networking for teaching and learning: Facebook use
at the University of Cape Town. Communicatio 35, 185–200.
doi:10.1080/02500160903250648
[33] Richardson, K., Hessey, S., 2009.Archiving the self?Facebook as biography of social and
relational memory. J of Inf, Com & Eth in Society 7, 25–38.
doi:10.1108/14779960910938070
[34] eBizMBA, 2014. Top 15 Most Popular Search Engines | June 2014 [WWW Document].
URL http://www.ebizmba.com/articles/search-engines (accessed 6.30.14).
[35] PCAdvisor, 2014.What’s the best free email service? We compare the top 6 providers - PC
Advisor [WWW Document]. URL
http://www.pcadvisor.co.uk/features/internet/3448241/whats-the-best-free-email-service/
(accessed 6.30.14).
This paper may be cited as:
Manzoor, A. 2014. Behavioral Pattern of Internet Use among University
Students of Pakistan. International Journal of Computer Science and
Business Informatics, Vol. 14, No. 2, pp. 25-36.](https://image.slidesharecdn.com/vol14no2-september2014-171208072404/85/Vol-14-No-2-September-2014-39-320.jpg)
![International Journal of Computer Science and Business Informatics
IJCSBI.ORG
ISSN: 1694-2108 | Vol. 14, No. 2. AUGUST/SEPTEMBER 2014 37
BER Analysis of BPSK and QAM
Modulation Schemes using RS Encoding
over Rayleigh Fading Channel
Faisal Rasheed Lone
Department of Computer Science & Engineering
University of Kashmir
Srinagar J&K
Sanjay Sharma
Department of Computer Science & Engineering
Shri Mata Vaishno Devi University
Katra J & K
ABSTRACT
Everybody has to communicate with each other so do computers, it is a necessary
phenomenon for exchange of information. Data is one of the most important entities in
today's world, thus data reliability is of utmost importance. The data exchanged between
computers is sent over various communication channels, which can induce noise in the data
thus rendering data unreliable and inconsistent. The number of errors introduced in the data
depends on the encoding scheme, the communication channel being used and also the
modulation scheme. Various encoding schemes, communication channels and modulation
schemes are used for data transmission, each of these schemes have their advantages and
disadvantages depending on the scenario. In this paper performance BPSK and QAM
modulation is compared using RS encoding scheme over Rayleigh fading channel and the
result so produced is presented in terms of BER.
Keywords
BPSK Modulation, QAM, Rayleigh fading channel.
1. INTRODUCTION
Whenever communication takes place, data needs to be transmitted, be it
human beings or computers [15]. Data is of utmost importance for an
effective communication to take place, so the transmission of data should
be such that the receiver of the data should receive the data in the same
condition as it was sent by the sender [15]. If the data is prone to any
disturbance, then the data received by the receiver will not be the same as it](https://image.slidesharecdn.com/vol14no2-september2014-171208072404/85/Vol-14-No-2-September-2014-40-320.jpg)
![International Journal of Computer Science and Business Informatics
IJCSBI.ORG
ISSN: 1694-2108 | Vol. 14, No. 2. AUGUST/SEPTEMBER 2014 38
was meant and thus it will convey different information than what it was
meant to convey. Thus the goal of data transmission is to transmit the data
over a communication channel without any errors .Various techniques have
been developed over the past few years to secure and make the data
transmission reliable. One of such techniques is Information Coding Theory.
Coding theory the study of codes, including error detecting and error
correcting codes, has been studied extensively for the past forty years. It has
become increasingly important with the development of new technologies
for data communications and data storage [15]. Coding theory makes use of
various codes to encode the data for transmission over a channel and then
the data is decoded at the receivers end to get the required data bits. Along
with the encoding scheme the modulation scheme being used for data
transmission also determines the extent to which the errors are introduced in
the data being transmitted. The performance of modulation schemes vary
depending on the encoding scheme used as well as channel. This paper
discusses the performance comparison of BPSK and QAM modulation over
Rayleigh fading channel using RS encoding scheme.
2. RELATED WORKS
During the past few years, researchers have started showing some interest in
analyzing the performance of various forward error detecting and correcting
codes. The reason being importance of data in present scenario. The
performance of forward error correction techniques are taken into
consideration by using these codes for transmitting data over various
communication channels. In [2] authors have compared and analyzed the
performance of different forward error correction techniques in case of
wireless communication systems. In [9] authors have analyzed the
suitability of Reed Solomon codes for low power communications and
found out that Reed Solomon codes reduce the battery consumption but
debated the overall suitability due to the extra overhead required to encode
the information to be sent. In [10] authors made a comparative study of
Reed Solomon code and BCH code over AWGN channel and concluded
that BCH code performs better than RS code in a binary environment.
3. REED SOLOMON CODE
Reed Solomon code was developed in 1960 by Irving S. Reed and Gustave
Solomon for reliable data transmission. This code was developed keeping in
mind the importance of reliability of data transmission over various
communication channels. This code is a type of block code in which n bit
codeword is formed by adding redundant bits of information to the k bits of
information bits where (n>k). The block so formed is used for actual
transmission over a communication channel. 2k
codeword's can be formed
from the k information bits which can be used for data transmission. Digital](https://image.slidesharecdn.com/vol14no2-september2014-171208072404/85/Vol-14-No-2-September-2014-41-320.jpg)

![International Journal of Computer Science and Business Informatics
IJCSBI.ORG
ISSN: 1694-2108 | Vol. 14, No. 2. AUGUST/SEPTEMBER 2014 40
(n-k) = 2t (10)
where t is the number of errors corrected by RS code.
The distance of RS code can be calculated as follows:
dmin=n-k+1 (11)
Reed-Solomon code is based on Galoi’s field.
3. MODULATION
The process of changing one or more properties of a periodic waveform,
called the carrier signal with a modulating signal that typically contains
information to be transmitted is called Modulation. By the use of
modulation a message signal, can be conveyed inside another signal which
can be physically transmitted.
3.1 Binary Phase Shift Keying
The simplest PSK is Binary PSK in which we have only two signal
elements, one with a phase of 00
and other with a phase of 1800
.BPSK is as
simple as PSK but it is much less susceptible to noise compared to PSK In
Ask the criterion for bit detection is amplitude but is PSK it is phase. Noise
can change amplitude easier than it can change phase of the signal. PSK is
superior to ASK because we don't need two carrier signals [14].
Figure 1. Binary phase shift keying.[14]
3.2 Quadrature Amplitude Modulation
There is a limitation to the PSK scheme and that is the inability of the
equipment to distinguish small differences in phase, which limits its](https://image.slidesharecdn.com/vol14no2-september2014-171208072404/85/Vol-14-No-2-September-2014-43-320.jpg)
![International Journal of Computer Science and Business Informatics
IJCSBI.ORG
ISSN: 1694-2108 | Vol. 14, No. 2. AUGUST/SEPTEMBER 2014 41
potential bit rate. The concept behind Quadrature amplitude modulation is to
use two carriers, one in phase and other quadrature, with different amplitude
levels for each carrier.[14]
4-QAM using Unipolar NRZ signal 4-QAM using polar NRZ
QAM using 2 positive levels to modulate 2 carriers 16-QAM with 8 levels
Figure 2. QAM Modulation[14]
4. COMMUNICATION CHANNEL
A physical medium or a logical connection over which data can be
transferred is known as a communication channel. The importance of a
communication channel is to send information from one or multiple senders
to one or multiple receivers. Limited amount of information can be
transferred over a channel depending on the data rate or the bandwidth of
the communication channel. Simulation of wireless channels accurately is
very important for the design and performance evaluation of wireless
communication systems and components.
4.1 Rayleigh fading channel
Rayleigh fading is considered when there are many objects in the
environment that scatter the radio signal before it arrives at the receiver.
According to central limit theorem, if there is a lot of scatter, the channel
impulse response will be well-modeled based on Gaussian process
irrespective of how the individual components are distributed. In case a
significant component to scatter is not present, then the process will have
zero mean and its phase will be distributes between 0 and 2p radians. The
response of the channel will be said to follow Rayleigh model. Complex
numbers usually represent the gain and phase of the channels distortion. In
such a situation it is assumed that Rayleigh is exhibited such that the real
and imaginary parts of the response are modeled by independent and
identically distributed zero-mean Gaussian processes so that the amplitude
of the response is the sum of two such processes.
5. METHODOLOGY
SIMULINK in MATLAB was used for simulating BPSK and QAM
modulation scheme in Rayleigh channel. The process is described as
follows:](https://image.slidesharecdn.com/vol14no2-september2014-171208072404/85/Vol-14-No-2-September-2014-44-320.jpg)

![International Journal of Computer Science and Business Informatics
IJCSBI.ORG
ISSN: 1694-2108 | Vol. 14, No. 2. AUGUST/SEPTEMBER 2014 44
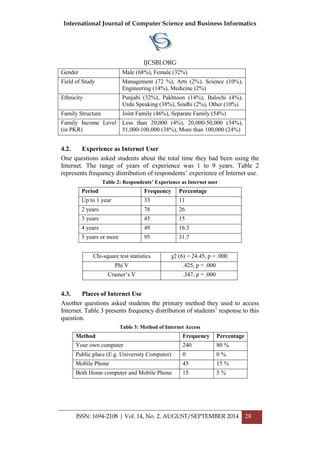
From the above graph it was found that QAM modulation
produced better results using RS encoding scheme in presence of Rayleigh
channel under binary environment.
7. CONCLUSIONS
In this paper performance of BPSK and QAM modulation was simulated in
the presence of Rayleigh fading channel using RS encoding scheme. Several
iterations were performed to find out that BPSK modulation outperforms
QAM using RS encoding in presence of Rayleigh fading channel. Eb/No
ratio was varied from 1 to 10 and it was noticed that at every value of
Eb/No QAM modulation performed better than BPSK modulation. The
graph plotted between BPSK and QAM modulation shows the performance
gain of QAM modulation over BPSK modulation in Rayleigh fading
channel using RS encoding.
8. ACKNOWLEDGMENTS
First and foremost, I would like to thank Mr. Sanjay Sharma. (Asstt.
Professor, SCSE, SMVDU, Katra) for their consistent guidance and support
throughout. He exposed me to the excitement of academic research and
provided me with opportunities to sharpen my skills. I have been deeply
impressed by their inspiring advice and timely feedback. Also, I would like
to thank my friends and colleagues for all the assistance.
I would like to thank my family for understanding and supporting me in
pursuing my academic goal. Their unconditional love and encouragement
have always been the source of my strength and I shall be grateful forever.
REFERENCES
[1] Wallace, H., 2001. Error detecting and correcting using BCH codes.
[2] Kumar, S. and Gupta, R., Performance Comparison of Different Forward Error
Correction Coding Techniques for Wireless Communication Systems.
International Journal of Computer science and technology, Vol. 2, issue3,
September 2011.
[3] Shannon , C.E., July and October 1948 . A Mathematical Theory of communication.
bell system journal, vol.24,.
[4] Reed, I.S., and Solomon, G., 1960. polynomial codes over certain finite fields.
Journal of the society for industrial and applied Mathematics, Vol. 8, No. 2, 300-304.
[5] Saraswat, H., Sharma, G., Kumar, S.M. and Vishwajeet., 2012. Performance
Evaluation and Comparative Analysis of Various Concatenated Error Correcting
Codes Using BPSK Modulation .for AWGN Channel. International Journal of
Electronics and Communication Engineering, ISSN 0974-2166 Volume 5, Number
3, pp. 235-244.
[6] Mahajan, S. and Singh, G., May 2011. Reed-Solomon Code Performance for M-ary
Modulation over AWGN Channel. International Journal of Engineering Science and
Technology (IJEST), Vol. 3 No. 5.](https://image.slidesharecdn.com/vol14no2-september2014-171208072404/85/Vol-14-No-2-September-2014-47-320.jpg)
![International Journal of Computer Science and Business Informatics
IJCSBI.ORG
ISSN: 1694-2108 | Vol. 14, No. 2. AUGUST/SEPTEMBER 2014 45
[7] Sodhi, G.K. and Sharma, K.K., 2011. SER performance of Reed Solomon Codes
With AWGN & Rayleigh Channel using 16 QAM. International Journal of
Information and Telecommunication Technology, Vol. 3, No. 2.
[8] Bose, R.C., and Chaudhuri, D.K., 1960. On A Class of Error Correcting Binary
Group Codes. Information and Control 3, 68-79.
[9] Biard, L. and Noguet, D., April 2008. Reed-Solomon Codes for Low Power
Communications. Journal of communications, vol. 3, no. 2.
[10]Puri, A. and Kumar, S., 2013. Comparative Analysis of Reed Solomon Codes and
BCH Codes in the Presence of AWGN Channel. International Journal of
Information and Computing Technology, vol.3 no.3.
[11]Luo, Z. and Zhang, W., February 2013. The Simulation Models for Rayleigh Fading
Channels. IEEE Transactions on Communications, Vol. 61, No. 2.
[12]Yang, S.M. and Vaishampayan , V.M., Low-Delay Communication for Rayleigh
Fading Channels: An Application of the Multiple Description Quantizer.
[13]Grolleau, J., Labarr, D., Grivel, E. and.Najim. M., The stochastic sinusoidal model
for Rayleigh fading channel simulation.
[14]Forouzan, B.A., Data communications and Networking.
[15]Lone, F.R., Puri, A. and Kumar, S., June 2013. Performance Comparison of Reed
Solomon Code and BCH Code over Rayleigh Fading Channel. International Journal of
Computer Applications (0975 – 8887) Volume 71– No.20.
This paper may be cited as:
Lone, F.R. and Sharma, S., 2014. BER Analysis of BPSK and QAM
Modulation Schemes using RS Encoding over Rayleigh Fading Channel.
International Journal of Computer Science and Business Informatics, Vol.
14, No. 2, pp. 37-45.](https://image.slidesharecdn.com/vol14no2-september2014-171208072404/85/Vol-14-No-2-September-2014-48-320.jpg)


![International Journal of Computer Science and Business Informatics
IJCSBI.ORG
ISSN: 1694-2108 | Vol. 14, No. 2. AUGUST/SEPTEMBER 2014 58
Design and Evaluation of a
Comprehensive e-Learning System
using the Tools on Web 2.0
Maria Dominic and Anthony Philomenraj
Department of Computer Science,
Sacred Heart College, India
Sagayaraj Francis
Department of Computer Science and Engineering,
Pondicherry Engineering College, India
ABSTRACT
e-Learning on web 2.0 encourages the users to collaborate and build the knowledge rather than
being a mere consumer of the knowledge. Web 2.0 provides various tools to perform
collaborative learning, that is to interact, have individual accountability, team work and
personalized guidance. This research article presents an assessment of 23 e-learning systems, a
survey to have the look and feel of 81 tools and sites in web 2.0 which will augment e-learning
2.0, features of an experimental web solution, data collection on the user preferences on it and the
analysis of those attributes.
Keywords
e-Learning 2.0, Web 2.0, Learning Styles, Social Networking, Cloud Computing
I. INTRODUCTION
An individual’s way of processing information is said to be cognitive styles (CS)
[1]. Humans have the cognitive ability to acquire and recognize information, map
them to representations and then to knowledge and then use them. Some of the
CS are Cognitive Trait Model and Inductive Reasoning Ability [2]. Learning
Styles are the different ways in which learners perceive and process information
[3]. Several learning styles have been in [4] towards designing e-learning
materials based on multi-learner style [5]. Felder-Silverman's synthesis of these
theories is designed to easily translate them into strategies for a higher education
sector (Table I) [6]. Mostly the authors classify the learners into groups and
propose corresponding inventories and methods. One such model is Sarasin [7].
According to him, the learners are classified into three groups based on their
learning styles namely visual learners, auditory learners and kinesthetic learners.
Visual learners gain knowledge through visual inputs, auditory learners learn
through listening and kinesthetic learners learn through experiments and](https://image.slidesharecdn.com/vol14no2-september2014-171208072404/85/Vol-14-No-2-September-2014-61-320.jpg)
![International Journal of Computer Science and Business Informatics
IJCSBI.ORG
ISSN: 1694-2108 | Vol. 14, No. 2. AUGUST/SEPTEMBER 2014 59
exploration [8]. This paper is structured as follows. Section II describes about e-
Learning and lists some of the popular e-learning systems used around the world
and provides a comparison table of these systems with Felder-Silverman model.
Section III identifies various ways of utilizing web 2.0 to augment e-Learning.
Section IV and Section V lists the various tools that are available in web 2.0 and
tabulates them. Section V shows the proposed comprehensive e–LMS and
discusses its features. Section VI presents the analysis of the attributes on the user
preferences on the designed system. Finally a brief conclusion is described in
Section VII.
II. E-LEARNING
Teaching and learning process has undergone a vast change after the advent of
Internet. As Internet and World Wide Web expanded rapidly e-Learning has
become a major form of education where time and geographical constraints have
been overcome. As pointed out in [9] e-Learning is a learning that involves
acquisition, generation and transfer of knowledge using ICT. This enables
universal learning, overcoming the barriers of time and distance. E-learning
is based on learning objects [10] like audio, video, presentations, documents, etc.,
which are stored in a learning repository from where they are accessed and
processed by the learner. The learning management systems like Black Board,
WebCT, MOODLE etc., support various kinds of teaching learning activities but,
they do not suit all kinds of learners who have different levels of intelligence and
maintains “one size fits all” approach. Hence, the adaptive and intelligent web
based educational systems [11], which cater to different types of styles of
learning according to the requirements of the learner and their situations.
NetCoach and SIETTE are comparable with modern day LMS. Most of the e-
Learning systems, adaptive or non adaptive, do not relate or collaborate with
external systems and mostly they are stand alone. A search was made for some of
the popular e-learning management systems along with their URL (Table II).
TABLE I. LEARNING STYLES
Author Characteristic's
David
Kolb’s
Accommodatin
g
Diverging Converging Assimilating
Peter
Honey
and Alan
Mumford
Activists Reflectors Theorists Pragmatists](https://image.slidesharecdn.com/vol14no2-september2014-171208072404/85/Vol-14-No-2-September-2014-62-320.jpg)
![International Journal of Computer Science and Business Informatics
IJCSBI.ORG
ISSN: 1694-2108 | Vol. 14, No. 2. AUGUST/SEPTEMBER 2014 60
Dunn and
Dunn
Environmental
Emotiona
l
Sociologica
l
Physiologica
l
Psychologica
l
Felder-
Silverma
n
Active /
Reflective
Visual / Verbal
Sensing /
Intuitive
Sequential /
Global
Sarasin
VAK
Visual Auditory Kinesthetic
This motivated the researchers to make a comparison between the popular e-
LMS's and the Felder-Silverman model. So, a comparative study was done on the
systems mentioned in Table II for the various characteristics of the selected
model to know how far they exhibit them. Table III provides these statistics. The
serial number in Table III corresponds to the LMS listed in Table II.
III.E-LEARNING IN WEB 2.0
Web 2.0 is a collection of inter operable web applications that facilitate user
interaction and collaboration with each other as creators of content rather than
passive viewers as in web 1.0. Examples of Web 2.0 are social networking sites,
blog, wikis, mashups, etc. [12]. These tools can be used by the learning
community to interact, share knowledge and augment problem based learning.
This has started a culture of contribution and not mere consumer of knowledge
among the learning community. Web 1.0 was useful for connecting people to the
contents thus useful for finding information and performing basic transactions.
The meeting point of users and resources are called a course [13]. E-learning is
primarily focused on groups. A group is a collection of individuals who are
engaged in a joint work. One such place is a social networking site, which are
very popular among people to stay connected. “Social” is often referred to as
communication, construction and collaboration [13]. Currently 300 million
people use social software [14] and it is still growing. In social networking, each
individual has a page and profile that one develops and shares with others in the
network. These social networking sites act as pedagogical agent for problem
based learning since it is a combination of personalization and socialization.
These social software provide platform to enable users to build applications for e-
learning and enables them to learn from each others’ work [14].To broaden and
generalize the data transfer between different social networking sites, Google
brought out an open social development platform in 2007. This platform defines
common API, which can be used to develop sites to provide services to multiple
sites and easily exchange data between different social sites. MySpace,
Friendster, LinkedIn uses open social API. Using REST API, personalized](https://image.slidesharecdn.com/vol14no2-september2014-171208072404/85/Vol-14-No-2-September-2014-63-320.jpg)
![International Journal of Computer Science and Business Informatics
IJCSBI.ORG
ISSN: 1694-2108 | Vol. 14, No. 2. AUGUST/SEPTEMBER 2014 61
materials and queries can be provided to users. The dimensions of a high quality
education experience are structure, content, service and delivery [15]. Structure is
the foundation of quality content, service and delivery. Content should be
comprehensive, authentic and researched. Services are resources, administration
and technical support for the action done. Delivery is the usability, interactivity
levels of the action performed [16]. All these desirable dimensions could be
easily achieved through web 2.0. It is also very easy to monitor the students’
learning process and levels through social media since they are open and
transparent and allow the learners to construct their own learning. The critical
challenge of web 2.0 is identifying the right co learners, content, service, and user
interfaces to facilitate interaction, communication and collaboration. Scaling is
another problem and expensive to implement. Here, Cloud computing comes to
the rescue by providing storage and other services, freeing the users to focus on
applications [17]. Applications like Google docs, presentation, etc., provide
teachers and learners with free and low cost alternative. Browser based
applications are easily accessible even on mobile platforms making learning
possible where Internet is accessible.
IV.TOOLS OTHER THAN SOCIAL NETWORKING
Web 2.0 offers a wide variety of tools that can be used for e-learning. Social
networking sites can be used for e-learning. According to Felder-Silverman
Learning Style Model, the learning style can be sensory, intuitive, visual, verbal,
inductive, deductive, active, reflective, sequential and global. There are a number
of tools in web 2.0, which according to the researchers, could be mapped to
Felder Silverman learning styles. Tools such as WebCasting and PodCasting can
be used to broadcast audio/video/slide/recordings, which can complement
classroom environment. Similarly, Wikis for group assignments; wikiversity.org
to collaborate and create contents freely; SuTree.com and Slide.net offers a
variety of resources to learners and teachers; eduSlide allows teachers to group
their content and present them to the learners; Footnote allows the users to access
documents and other resources and prepare online reports;
TABLE II. LIST OF POPULAR E-LEARNING SYSTEMS
S.No Title URL
1 Apex Learning www.apexlearning.com/
2 ATutor www.atutor.ca/credits.php
3 Blackboard www.blackboard.com/
4 Brainshark www.brainshark.com/
5 Chamilo www.chamilo.org/](https://image.slidesharecdn.com/vol14no2-september2014-171208072404/85/Vol-14-No-2-September-2014-64-320.jpg)


![International Journal of Computer Science and Business Informatics
IJCSBI.ORG
ISSN: 1694-2108 | Vol. 14, No. 2. AUGUST/SEPTEMBER 2014 67
languages; make use of open and free educational resources; and provide free
storage and more.
VI. COMPREHENSIVE E-LMS
Using the knowledge acquired from the survey listed in Table V, a web based e-
learning system specific for learning Object Oriented Programming Using C++
was developed. It is a minimal working prototype which gives the look and feel
of all the learning components [17] that utilizes various social tools, interactive
environments of Web 2.0, various web based services and cloud. The proposed
system is available at [18]. Some of the key features of the system are as follows:
1. Cloud is used as a repository for learning objects like presentations,
documents, etc. The cloud service used for this purpose is [19]. The service
provider provides 500 GB of free storage, freeing the server from the
respective overload and enables the researchers to focus on the application.
2. All the video lessons are uploaded to YouTube.com and played here. This is
implemented using the open APIs provided by YouTube.com.
3. Google Gadgets, like Google Calendar are used to publish the Schedule /
Course plan.
4. Links to different sites for non human resources like animations, references,
books, journals, articles and other forms of media are incorporated. Online
quizzes produce the result of the quiz and mail it to the stakeholders about the
learners’ performance. This was done using Question writer [20]. A
dictionary of all the key words in the C++ language, a custom built software
is also provided.
5. REST API and other API provided by FaceBook are used to build discussion
forum and chat room features for those attending the course.
6. The learners can also test their programs using [21], which provides a
platform for program compilation and execution facility for many
programming languages.
7. A question bank is a repository of questions to support the learning process.
This web solution also holds a sample question bank for learning C++.
8. Using [22] mind map is generated to represent and structure ideas and
concepts of C++ graphically.](https://image.slidesharecdn.com/vol14no2-september2014-171208072404/85/Vol-14-No-2-September-2014-70-320.jpg)
![International Journal of Computer Science and Business Informatics
IJCSBI.ORG
ISSN: 1694-2108 | Vol. 14, No. 2. AUGUST/SEPTEMBER 2014 68
Some of the other features included in the system are deriving class diagrams
from source code [23], learning by playing cross word puzzle [24], analyzing the
code’s efficiency using static analyzer [25] and sample C++ programs [26].
VII. ANALYSIS OF THE ATTRIBUTES
Attributes identify the way user preferences in the using the tools available in
web 2.0. The comprehensive e-learning system developed was allowed to be used
by students for around six months and their learning behavior was captured and
analyzed. A total of 1397 students explored and used the system, out which only
1074 had the complete profile and 323 students’ data could not be used because
of incomplete profile. The frequency statistics are tabulated from Table V to
Table XII.
TABLE V. GENDER OF THE RESPONDENTS
Frequency Percent
Male 750 69.8
Female 324 30.2
Total 1074 100
TABLE VI. EDUCATIONAL QUALIFICATION OF THE RESPONDENTS
Qualification Frequency Percent
MCA 252 23.5
MBA 222 20.7
M.Sc. CS 120 11.2
B.Sc CS 174 16.2
BBA 180 16.8
BCA 99 9.2
Ph.D 27 2.5
Total 1074 100
TABLE VII. DOMICILE TYPE OF THE RESPONDENTS
Domicile Frequency Percent
Urban 865 80.5
Rural 209 19.5
Total 1074 100](https://image.slidesharecdn.com/vol14no2-september2014-171208072404/85/Vol-14-No-2-September-2014-71-320.jpg)


![International Journal of Computer Science and Business Informatics
IJCSBI.ORG
ISSN: 1694-2108 | Vol. 14, No. 2. AUGUST/SEPTEMBER 2014 72
The findings from the analysis of the attributes are as follows,
1. From Table VIII, the top five usage of the system are video lessons, search
other related components on web, lecture presentations, mind map and
question bank respectively.
2. From Figure 1 which provides the statistics on gender wise usage of the
system, the top three usage by male respondents are simulation, lexicon and
e-materials. The top three usage by female respondents are discussion forum,
mind map and video lessons.
3. From Figure 2 which provides the statistics on the usage based on the
educational qualifications of the respondents is that, post graduate students
top three usages are discussion forum, lexicon and lecture presentations. The
top three usages by under graduate students are online quiz, simulation and
animations.
From Figure 3 which provides the statistics on the usage based on the location
of residency is that, urban respondents top three usages are online quiz, online
compilation and question bank. The top three usages of the rural respondents
are e-materials, discussion forum and tutorials.
These interpretations will be useful to the e-learning system designer to design
and make the system adaptive based on the behavior pattern and the requirements
of the learning community. This could be the future scope of this system. This
can be implemented using the tools available in web 3.0. Another e-LMS for
learning Java Programming is also being designed and is available at [29].
REFERENCES
[1] RIDING, R. & RAYNER, S. (2006) “Recent adaptive e-learning contributions towards a
standard ready architecture”. Innovations in Education and Teaching International. 43. p.
121-135.
[2] SOTIRIOS BOTSIOS & DIMITRIOS GEORGIOU. (2008) “Recent adaptive e-learning
contributions towards a “Standard Ready” Architecture. e-Learning. p. 226-230.
[3] DEKSON, D. & SURESH, E. (2010) “Adaptive e-Learning techniques in the development of
teaching electronics portfolio – A survey”. International Journal of Engineering Science and
Technology. 2(9). p. 4175-4181.
[4] GRAF & RITA VIOLA. (2007) ”In-Depth Analysis of the Felder- Silverman Learning Style
Dimensions”. Journal of Research on Technology in Education. 40(1). p. 400-415.
[5] BUTHINA DEEB & ZAINUDIN BIN HASSAN. (2011) ”Towards Designing e-Learning
Materials based on Multi Learner’s Styles”. International Journal of Computer Applications.
26(3). p. 126-137.
[6] FELDER & SILVERMAN. (1988) ”Learning and Teaching Styles in Engineering Education”.
Engr.Education. 78(7). p. 674-681.
[7] SARASIN, L.C. (1999) “Learning Styles Prespectives: Impact in the Classroom”. Madison.
WI: Atwood Publishing.](https://image.slidesharecdn.com/vol14no2-september2014-171208072404/85/Vol-14-No-2-September-2014-75-320.jpg)
![International Journal of Computer Science and Business Informatics
IJCSBI.ORG
ISSN: 1694-2108 | Vol. 14, No. 2. AUGUST/SEPTEMBER 2014 73
[8] MONTEMAYOR, E. & APLATEN, M. (2009) “Learning Styles of high and low Academic
Achieving Freshman Teacher Education Students: An Application of Dunn and Dunn’s
Learning Style Model”. University of Cordilleras. 1(4). p. 1-14.
[9] SHAFQAT HAMEED & ATTA BADII. (2009) ”Impact of the e-learning package on the
quality of student learning experience”. European and Mediterranean Conference on
Information Systems (EMCIS2009). p. 13-14.
[10]POLSANI, P. R. (2003) ”Modalities of Using Learning Objects for Intelligent Agents in
Learning”. Journal of Digital Information. 3(4).
[11]BRUSILOVSKY, P. (2000) “Adaptive hypermedia: from intelligent tutoring systems to web-
based education”. Intelligent Tutoring Systems. 1839. p. 1-7.
[12]http://en.wikipedia.org/wiki/Web_2.0#cite_note-0
[13]CHRISTIAN DALSGAARD. (2008) ”Social Networking Sites: Transparency in online
education”. EUNIS.
[14]MOHAMMED AL-ZOUBE & SAMIR ABOU EL-SEOUD. (2009) ”Using Social
Networking Sites as a Platform for E-Learning”. ICL.
[15]DEBRA MARSH & RACHEL PANCKHURST. (2007) ”eLEN- eLearning Exchange
Networks: reaching out to bilingual and multicultural University Colloboration”, hal.
[16]JENNY LAGSTEN & MATHIAS HATAKKA. ”The Use of Online Social Networks in
Chinese Colloborative e-Learning Education”. Available from: http://oru.diva-portal.org /
smash / get / diva2:424915/FULLTEXT01.
[17]MARIA DOMINIC & SAGAYARAJ FRANCIS. (2012) “Mapping of e-Learning
Components to Cloud Computing”. International Journal on Engineering Research and
Technology. 1(6). p. 1-5.
[18] http://www.elearn.mcashc.org
[19] www.jumbofiles.com
[20] www.questionwriter.com
[21] www.compilr.com
[22] www.spicynodes.com
[23] http://www.ucancode.net/Visual_C_MFC_Samples/Free-C-CPP-Code-Generate-Tool-UML-
Draw.htm
[24] http://www.sstutor.com/cpp/cword2.htm
[25] http://cppcheck.sourceforge.net/
[26] http://www.syvum.com/squizzes/cpp/
[27]CASQUERO, O. & PORTILLO, J. (2008) ”iGoogle and gadgets as a platform for
integrating institutional and external services”. MUPPLE'08. p. 37-41.
[28] http://vcl.ncsu.edu/
[29] http://elearningshc.hpage.co.in
This paper may be cited as:
Dominic, M. and Philomenraj, A. 2014. Design and Evaluation of a
Comprehensive e-Learning System using the Tools on Web 2.0. International
Journal of Computer Science and Business Informatics, Vol. 14, No. 2, pp. 58-73.](https://image.slidesharecdn.com/vol14no2-september2014-171208072404/85/Vol-14-No-2-September-2014-76-320.jpg)


![International Journal of Computer Science and Business Informatics
IJCSBI.ORG
ISSN: 1694-2108 | Vol. 14, No. 2. AUGUST/SEPTEMBER 2014 86
conduct of SADTU by threatening strike action set to disrupt examinations
in Soweto and further deplore that week`s irresponsible act by hundreds of
Soweto teachers who abandoned lessons to discuss deductions on their
salaries.
Naidu reported in the Star newspaper that the South African Democratic
Teachers' Union (SADTU) say they are ready to challenge the KwaZulu-
Natal Education Department after it issued them with a court order
preventing them from continuing their strike action. This is a clear
indication that social factors have a great bearing on the South African
school personnel.
5. CONCLUSION
To manage well, one needs a strategic plan, which will guide all the actions
of the organization. This strategic plan for implementing a new system
should include a change management plan. Without change-management a
system may be rejected despite its technical superiority because of people‟s
natural inclination to resist change. Management support has proven to be
an important factor for promoting the acceptance of a new innovation. Lack
of visible support from the Limpopo Department of Education has resulted
in the failure of SA-SAM implementation in the provincial schools. The
junior staff members that were given the responsibility to spearhead the
implementation of the SA-SAM employed the trail-and-error strategy,
which has led to the rejection of SA-SAMS by school personnel. The roll
out of the implementation of SA-SAMS was done without a project
management tool or system. The training of school personnel should be
targeted to the needs of the teachers and not general, based on the needs of
officials tasked to implement the system. According to the teachers the
training was supposed to include in-depth training in Windows as well as
application programs such as word processing and spreadsheets. The
teachers felt that they were treated as junior partners and therefore not
respected.
The human factor in the implementation of new systems is sometimes more
important than the technical factors as it has shown in the case of Limpopo
province implementation of SA-SAMS.
REFERENCES
[1] Anderson, E. and Dexter, S., 2005. School Technology Leadership: An empirical
investigation of prevalence and effect. Educational Administration Quarterly, Vol. 41,
No.1, pp.49–82.
[2] Bagozzi, R.P., 2007. The Legacy of the Technology Acceptance Model and a
Proposal for a Paradigm. Shift. Journal of the Association for Information Systems,
Vol. 8, pp.244–254.](https://image.slidesharecdn.com/vol14no2-september2014-171208072404/85/Vol-14-No-2-September-2014-89-320.jpg)
![International Journal of Computer Science and Business Informatics
IJCSBI.ORG
ISSN: 1694-2108 | Vol. 14, No. 2. AUGUST/SEPTEMBER 2014 87
[3] Bialobrzesk, M. and Cohen, S.,2005. Managing ICTS in South African schools: A
guide for School Principals.
[4] Chai, C.S., Hong, H.Y. and Teo, T.,2009.Singaporean and Taiwanese Pre-service
Teachers' beliefs and their attitude towards ICT use: A comparative study. The Asia-
pacific Education Researchers, Vol. 18, No. 1, pp. 117–128.
[5] Davis, F., 1986.Technology Acceptance Model for Empirically Testing new End-User
Information Systems: Theory and Results. PhD thesis, MIT.
[6] Davis, F., 1989. Perceived Usefulness, Perceived Ease of Use, and User Acceptance
of Information Technology. MIS Quarterly, Vol. 13, No. 3, pp. 319–340.
[7] Davis, F. and Venkatesh, V., 1995. Measuring User Acceptance of Emerging
Information Technologies: An Assessment of Possible Method Biases. In Proceedings
of the 28th Annual Hawaii International Conference on System Sciences, pp.727-736.
[8] Demir, K., 2006. School Management Information Systems in Primary Schools. The
Turkish Online Journal of Education Technology, Vol. 5, No. 2, pp.1–13.
[9] Flanagan, L. and Jacobsen, M., 2003.Technology Leadership for the twenty-first
century Principal. Journal of Educational Administration, Vol. 41, No. 2, pp.124–142.
[10] Gxwati, N.I., 2011.The Education Management Information System of the Free State
Department of Education - A Systems Analysis. Master‟s thesis, University of
Stellenbosch.
[11] Heeks, R., 2002. Information systems and developing countries: failure, success, and
local improvisations. The information society, Vol. 18, pp.101–112.
[12] Lee, A., 2004.Technology acceptance model past and future. Communications of the
Association for Information Systems, Vol.12, pp. 752–780.
[13] Mentz E., and Mentz, K., 2003. Managing technology integration into schools a
SouthAfrican perspective. Journal of Educational Administration, Vol. 41, pp.86–200.
[14] Mokwena, S., 2010. Turning technology presence into technology use: the case of
South Africa. In Z. Abas et al. (Eds.), Proceedings of Global Learn Asia Pacific,
pp.495-501. AACE.
[15] Pynoo, B., Devolder, A.,Tondeur, J., Van Braak, J.,Duyck, W. and Duyck,
P.,2010.Predicting secondary school teachers‟ acceptance and use of a digital learning
environment: A cross-sectional study. Computers in Human Behavior, Vol. 27 No.1,
pp.568–575.
[16] Bisaso R., Kereteletswe, O., Selwood A, and Visscher, J.,2008.The Use of
Information Technology for Educational Management in Uganda and Botswana.
International Journal of Educational Development, Vol. 28, No. 6, pp.656–668.
[17] South Africa. 1996. South African Schools Act, no. 84 of 1996. 15 November.
[18] South Africa. 2006. Department of education, user guidelines on how to get started
with SA-SAMS School Administration and management information system.
[19] South Africa.2006. User Guidelines on how to get started with SA-SAMS School
Administration and management information system. Department of Education.
[20] South Africa.2007. Education Management Information System (EMIS); ensuring
quality through education districts.
[21] South Africa.2011. Dinaledi Schools, Thutong portal learning support space.](https://image.slidesharecdn.com/vol14no2-september2014-171208072404/85/Vol-14-No-2-September-2014-90-320.jpg)
![International Journal of Computer Science and Business Informatics
IJCSBI.ORG
ISSN: 1694-2108 | Vol. 14, No. 2. AUGUST/SEPTEMBER 2014 88
[22] South Africa.2011. National Assembly for written reply question 229, 02 September. .
[23] South Africa Department of Education. 2004. Draft white paper on E-education. In
Government Gazette, (General Notice 1869) : 26734:6-35, Aug. 26. Government
Printer Pretoria.
[24] Telem, M.,1996.MIS implementation in schools: A systems socio-technical
framework. Journal of Computers and Education, Vol. 27,No. 2, pp.85–93.
[25] Telem, M., 2001. Computerization of School Administration: Impact on the
Principal‟s role - A Case Study. Journal of Computers and Education, Vol. 37,
pp.345–362.
[26] Telem, M., 2005. The Impact of the Computerization of a High School‟s Pedagogical
Administration on Homeroom Teacher-Parents Interrelations: A Case Study. Journal
of Teaching and Teacher Education, Vol.21, No. 6, pp.661–678.
[27] Van Wyk, C.,2006. The Development of an Education Management Information
System from a Sense making Perspective and the Application of Quantitative Methods
to Analyze Education Data Sets. PhD thesis, University of Stellenbosch.
[28] Venkatesh, V. and Davis, F.,2000.A Theoretical Extension of the Technology
Acceptance Model: Four longitudinal field studies. Management Science, Vol. 46, No.
2, pp.186–204.
[29] Venkatesh, V., and Bala, H., 2008. Technology Acceptance Model 3 and a Research
Agenda on Interventions. Journal of compilation, Decision science institute, Vol.
39,No. 2, pp.273–315.
[30] Visscher, A. J., 1991. School Administrative Computing: A framework for analysis.
Journal of Research on Computing in Education, Vol. 24, No. 1, pp.1–9.
This paper may be cited as:
Mokwena, S., 2014. Critical Success Factors for the Adoption of e-
Administration in South African Schools. International Journal of
Computer Science and Business Informatics, Vol. 14, No. 2, pp. 76-92.](https://image.slidesharecdn.com/vol14no2-september2014-171208072404/85/Vol-14-No-2-September-2014-91-320.jpg)


![International Journal of Computer Science and Business Informatics
IJCSBI.ORG
ISSN: 1694-2108 | Vol. 14, No. 2. AUGUST/SEPTEMBER 2014 93
Efficient and Trust Based Black
Hole Attack Detection and
Prevention in WSN
Ganesh R. Pathak
Associate Professor
Department of IT, SCOE, Pune
Suhas H. Patil
Professor and Head
Bharati Vidyapeeth University College of Engg,Pune
Jyoti S. Tryambake
PG Student
Department of IT, SCOE, Pune
ABSTRACT
In a Wireless Sensor Network (WSN), Security is a key challenge due to its dynamic
topology, open wireless medium, lack of centralized infrastructure, intermittent
connectivity, resource constrained sensor nodes. These weak entities make WSN easily
compromised by an adversary to device abundant attacks resulting in disastrous
consequences. Black Hole can be one of them wherein it exploits a trustworthiness of a
network by promising routing of data packets to the destination knowing that it has a
shortest path but in reality it drops all packets and consequently threatens reliability. In
order to accomplish secure packet transmission, an efficient and trust based secure protocol
is proposed to defend against single and cooperative Black Hole attack. A proposed
protocol incorporates trust metric estimation to determine honesty of nodes during secure
path formation. A proposed system builds a Hierarchical Cluster Topology and is
experimentally evaluated to demonstrate its effectiveness in detecting and preventing
efficiently the Black Hole attacks. Besides, comparison of proposed protocol with one of
the existing approach [9] proves that proposed system is efficiently reduces possibility of
misbehaving nodes being a part of network communication process and achieves better
packet delivery ratio, throughput and less end-to-end delay. The Simulation results signify
that the proposed protocol performs satisfactorily in secure routing and is robust against
both single and cooperative Black Hole attacks in a dynamic environment.
Keywords
Wireless Sensor Network, Security, Black Hole attack, Hierarchical Cluster Topology.
1. INTRODUCTION
Wireless Sensor Network (WSN) finds its applications [1] in multiple areas
like; homeland security, environment and monitoring purposes, military,
agriculture and manufacturing tasks etc. where security is an important](https://image.slidesharecdn.com/vol14no2-september2014-171208072404/85/Vol-14-No-2-September-2014-96-320.jpg)
![International Journal of Computer Science and Business Informatics
IJCSBI.ORG
ISSN: 1694-2108 | Vol. 14, No. 2. AUGUST/SEPTEMBER 2014 94
perspective [4] comes into picture. For an extensive wireless network, it is
not viable to observe and protect each individual node from variety of
attacks. To make entire network system unsteady attackers may perhaps
launch different types of security threats mostly during routing phase.
Attacks on routing ([2], [3]) can be done in two phases; first phase is attack
on routing protocol by jamming the flooding of information to a node. For
example, Hello flood attack, Acknowledgement spoofing etc. and another
phase belongs to attack on packet delivery mechanism by creating a
predefined path in order to direct traffic towards it. Black Hole attack [5] is
one of the examples that falsely advertises a less enough distance route to
the destination and forces entire traffic to go through Black Hole region.
Significant research effort has been spent on designing defense mechanisms
for Black Hole attack studied in [16]; which are complex, energy inefficient
and scarce to protect a network when multiple nodes act cooperatively to
perform malicious activity and may have devastating impact on overall
network. In this paper, an efficient and trust based secure routing protocol to
discover and prevent Single and Cooperative Black Hole attack is presented.
The approach is straightforward and trust based to determine honesty of
nodes in order to accomplish secure packet transmission.
Main contribution of this work is divided into three phases. In first phase,
simulations of solution proposed for Black Hole attack by Mohammad
Wazid et al. [9] is implemented. Second phase enhances the algorithm to
improve accuracy in preventing Black Hole attack. Proposed algorithm does
not give any implementation details of existing algorithm but addresses
several issues of [9] during performance. In third phase, a comparison of
proposed mechanism with the existing solution [9] is performed in terms of
performance parameters [17] such as Packet Delivery Ratio, Throughput,
End-to-end Delay.
Rest of the paper is structured as follows: Section 2 briefly survey existing
security solutions in WSN for Black Hole attack. Section 3 describes
proposed security protocol for single and cooperative Black Hole attack in a
dynamic WSN. In Section 4, performance of the proposed security solution
is evaluated and presented in the form of graphs. Section 5 concludes the
paper.
2. RELATED WORKS
To encounter a single as well as team of Black Hole attacks, Karakehayov
Z. [6] has suggested a REWARD (Receive, Watch, Redirect) method with
the help of two broadcast messages; MISS and SAMBA to identify Black
Hole nodes. This method works well for different levels of security. Tiwari
M. et al. [7] have introduced the concept of watchdogs to watch behavior of
nodes that facilitates further to detect malicious nodes performing
anonymous activity. D S. et al. [8] have proposed a novel approach to](https://image.slidesharecdn.com/vol14no2-september2014-171208072404/85/Vol-14-No-2-September-2014-97-320.jpg)
![International Journal of Computer Science and Business Informatics
IJCSBI.ORG
ISSN: 1694-2108 | Vol. 14, No. 2. AUGUST/SEPTEMBER 2014 95
improve data delivery in the presence of a Black Hole attack that uses
concept of multiple base stations deployed in WSN using mobile agent. The
purpose of multiple base stations is to ensure high packet delivery in the
presence of attack. Atakli I. M., Hu H. et al. [11] have developed a
Weighted Trust Evaluation (WTE) mechanism for hierarchical sensor
network architecture. This mechanism is applied to Cluster Head at every
cycle to detect anonymous activity. Dr. Virmani D. et. al. [12] proposed an
exponential trust based mechanism to detect malicious node. Trust factor
drops exponentially with each consecutive packet dropped which helps in
detecting the malicious node. Janani C et. al. [13] introduced TARF a robust
trust aware routing framework for WSNs mainly protects a WSN against the
replay attacks and also, proved to be powerful against strong attacks such as
wormhole attacks and Sybil attacks. An innovative approach is proposed by
Athmani S. et al. [10] based on periodic control message exchange
mechanism between a sensor node and a base station. This mechanism
requires a bit energy load due to packet exchange scheme.
Wazid M. et al. [9] considered a tree topology in WSN for their work and
invented a detection and prevention mechanism for Black Hole attack. This
tree topology consists of sensor nodes, router nodes and a coordinator node
(CO). Coordinator node supervises all nodes in the network, carries out
authentication phase and thus detects the intruder node if any in the network
with the help of waiting time parameter. The mechanism [9] has come
across several shortcomings such as this algorithm works for static sensor
network and did not consider mobility of nodes. Indeed, a Black Hole node
is removed from particular cluster but in future it may affect another cluster
as a result, there are very less chances for WSN to become completely safe
against Black Hole attack. Besides, this method is not suitable for
cooperative Black Hole attack. This paper simulates proposed system that
improves the existing solution [9] and makes it more efficient and accurate
to prevent Black Hole attacks. At the end, a performance is measured both
for proposed and existing system.
3. PROPOSED SECURITY SOLUTION
Basic idea is to develop robust and reliable solution to detect and prevent
Black Hole attack in dynamic WSN with minimum energy consumption and
less delay. The proposed solution builds hierarchical cluster topology and
identifies single as well as cooperative Black Hole attack in a mobile
environment. Most of the solutions discussed earlier identify malicious node
only after an attack is taken place. To circumvent this situation, the existing
system [9] is improved with introducing trust model to decide a
trustworthiness of nodes going to participate in communication process.
Proposed system tries to eliminate infected and misbehaving node from
being a part of communication process. Initially, proposed security solution](https://image.slidesharecdn.com/vol14no2-september2014-171208072404/85/Vol-14-No-2-September-2014-98-320.jpg)
![International Journal of Computer Science and Business Informatics
IJCSBI.ORG
ISSN: 1694-2108 | Vol. 14, No. 2. AUGUST/SEPTEMBER 2014 96
builds a Hierarchical Cluster Topology to achieve energy efficiency
criterion ([14], [15], [16]). Soon after, a security protocol is applied to the
network to identify any anonymous activity. Following section describes
Cluster formation, Black Hole Attack Scenario and implementation of
efficient and trust based secure protocol is elucidated thereafter.
3.1 Hierarchical Cluster Topology
Proposed system uses Hierarchical Cluster Topology consists of four levels
in WSN comprising a Sensor Node (SN), Cluster Head (CH), Coordinator
Node (CO), Base Station (BS) as shown in Figure 1.
Figure 1. Hierarchical Cluster Topology
The whole network is divided into number of clusters and each cluster
consists of one or more than one CH, a CO and that controls numerous SNs.
The CHs of different clusters communicate with each other to switch over
aggregated data. CHs forward aggregated data to the CO and finally to the
Base-Station. Four different levels of WSNs are described as below:
Level-1: Sensor nodes sense the medium, gather raw data and forward it to
the second level that is to CH.
Level-2: These are special-purpose sensor nodes called as Cluster Heads
(CHs). In each cluster, there exists more than one cluster head, which collect
raw data from several SNs from a cluster. Each CH of the network has
unique ID. CHs come across several events using SNs of its own cluster and
prepare final report using data aggregation techniques, and forwards
collective data to the third level that is to CO.
Level-3: These are Coordinator nodes (CO) forward raw fused and
aggregated data to next level Cluster or Base Station. CO in each cluster is
elected by sensor nodes in that cluster. Election of a cluster coordinator
requires two things to be considered.
Equality: Any node can turn into a CO that means the probability of
every node being a cluster coordinator should be equal.
CH4
SN5
SN7 SN8 SN9
SN10
SN11
CO2
CO3
CO1
BS
CH1
CH2
CH3
CH5
CH6
CH7
SN1
SN2
SN3
SN4 SN6
SN13
SN14
SN15
SN16
SN17
SN18
SN19
SN20
SN21](https://image.slidesharecdn.com/vol14no2-september2014-171208072404/85/Vol-14-No-2-September-2014-99-320.jpg)
![International Journal of Computer Science and Business Informatics
IJCSBI.ORG
ISSN: 1694-2108 | Vol. 14, No. 2. AUGUST/SEPTEMBER 2014 98
Looping. Looping is term where node transmits and receives same packets
from neighboring nodes. Looping is evaluated because it highly affects data
packet delivery, throughput, may cause more delay and mainly cause
devastating impact on nodes energy.
3.3.1 Trust Model
Proposed Trust metric is an additional piece of action carried out in
waiting_time based Black Hole attack detection mechanism [9]. As soon as
a network is established and nodes initiate neighbor discovery procedure, a
Trust for every node is evaluated before actual Black Hole attack detection
process begins. A Trust Model is distributed in two phases; First phase is
associated with Nodes Discovery and Trust Initialization and Secondly,
Nodes Selection and Revocation are described further.
3.3.1.1 Nodes Discovery and Trust Initialization
After a specific interval nodes discovery process is carried out by sending
hello packets. A node broadcasts hello packets to discover its neighbors. On
reception of hello packets, neighboring nodes would decide trustworthiness
of a node from which they are receiving hello packets. Suppose node i
discovers its neighbors by sending hello packets. On reception of hello
packet, a node j would decide a trustworthiness of node i depending upon its
prior performance in the form of packet transmission. An initial trust metric
for a neighbor node i is initialized by calculating its packet delivery ratio.
In next case, node j has to look up the presence of node i in the loop list, if
node i is present in the loop_list then its trust value decreased by some
constant factor denoted as “down”. If node i is not present in the loop_list,
then increase its trust value by some constant factor say “up”. Add neighbor
into neighboring list and consequently updates corresponding trust value for
node i and store it into trust table.
If a node is present in the loop_list then
new_trust_ = down * trust_ ; // down = const value
Otherwise
new_trust_ = up * trust_ ; // up =const value
Update trust value for neighboring nodes
3.3.1.2 Nodes Selection and Revocation
In this phase a trustworthy node would be selected for communication and
untrustworthy node will be blacklisted. By the time, neighboring node j
receiving a route request packet from node say i, its trustworthiness would
be evaluated. To estimate this, firstly, a packet delivery ratio of a neighbor
node is calculated. At the same time, an old trust value is obtained for node
i. If the Delivery_ratio for node i is found less than old trust value of node i
then decrease the trust value for node i by some constant factor denoted as
“down”, and do not accept route request from node i. If trust value is found](https://image.slidesharecdn.com/vol14no2-september2014-171208072404/85/Vol-14-No-2-September-2014-101-320.jpg)
![International Journal of Computer Science and Business Informatics
IJCSBI.ORG
ISSN: 1694-2108 | Vol. 14, No. 2. AUGUST/SEPTEMBER 2014 99
greater than its delivery ratio then increase its trust value by some constant
factor say “up”. Lastly update corresponding trust value for node i.
(i) A node receiving route request packet from neighboring nodes,
Obtain the Delivery_Ratio (DR_i) and trust_i values for
neighboring nodes
If (DR_i < trust_i) then
new_trust_ = down * trust_i + DR_i ;// down = const value
remove a neighboring node from a list
Otherwise
new_trust_ = up * trust_i + DR_i ; // up =const value
Update trust value for neighboring nodes
In addition, obtain the energy value for a neighbor node and verify
how much energy it has consumed till it process further.
Verification should be done for both trust and energy values.
(ii) If trust and energy values are reached beyond predetermined
trust_threshold and energy_threshold then discard a packet.
Proposed protocol runs a periodic service as similar to many routing
protocols. After a precise interval, nodes discovery process initiated which
creates neighboring nodes list. Nodes illustrate trust of their neighbors by
examining their packet delivery ratio and occurrence into loop list. Initially,
Trust metric is estimated in nodes discovery procedure that looks up for a
node in Looping. If a corresponding node is under influence of looping,
trust factor associated with it get decreased otherwise it may further be
incremented. Similar case is evaluated under route request circumstance
where Route request procedure determines energy consumption for
requested node. In this case a trust value evaluation for a node is solely
depends upon its delivery ratio. This trust metric reduces chances of a
failure or infected node to become a part of a communication process in the
network. And thus, node crossing trust threshold and consuming more
energy would be kept aside from a path generating process and so, secure
path can be formed to the destination node. Later on, Cluster Coordinator
node takes a responsibility to identify a malicious and failure node inside
the network with the help of waiting_time procedure [9].
4. SIMULATION
4.1 Simulation Environment
Proposed work is simulated using network simulator tool NS2. A network
of square surface of 10001000m2
is constructed for simulation purpose.
Initially, proposed experimental model is built on 50 nodes distributed
randomly and move arbitrarily on a simulation area. Later on, it is evaluated
for rising number of nodes such as for 75,100 and 125. All nodes have same
power level and same maximal transmission range of 100m. A CBR](https://image.slidesharecdn.com/vol14no2-september2014-171208072404/85/Vol-14-No-2-September-2014-102-320.jpg)
![International Journal of Computer Science and Business Informatics
IJCSBI.ORG
ISSN: 1694-2108 | Vol. 14, No. 2. AUGUST/SEPTEMBER 2014 100
(Constant Bit Rate) application is attached that generates constant packets
through UDP connection. CBR packet size is preferred to be 512 bytes long.
A node initiates packet transmission from a random location and when
destination is reached a transmission process repeats after 25m/s pause.
Simulation takes place for 200 seconds. Simulation parameters are
summarized below in Table 1.
Table 1. Simulation Parameters
Parameters Values Parameters Values
Environment Area 1000 * 1000 Packet Size 512
Topology Hierarchical Cluster Energy model 100 J
No. of Nodes 50, 75, 100, 125 Pause time 25 m/s
Simulation time 200 Sec. Traffic source CBR
Transmission Range 100m Channel Type Wireless
4.2 Simulation Results
The performance of proposed protocol is analyzed against Black Hole attack
in terms of amount of data packets delivered to the Base Station and delay
caused during this transmission. For this purpose, two Black Holes are
assumed randomly deployed in a network and act individually as well as
cooperatively. With the presence of Black Holes, performance is measured
in terms of Packet Delivery Ratio (PDR), Throughput, End-to-end Delay at
several intervals for existing system [9] say Solution 1 and also for proposed
system say Solution 2 shown in following graphs.
(a) Interval Vs Packet Delivery Ratio (b) Interval Vs Throughput
(c) Interval Vs End-to-end Delay
Figure 3. Comparison Graphs](https://image.slidesharecdn.com/vol14no2-september2014-171208072404/85/Vol-14-No-2-September-2014-103-320.jpg)
![International Journal of Computer Science and Business Informatics
IJCSBI.ORG
ISSN: 1694-2108 | Vol. 14, No. 2. AUGUST/SEPTEMBER 2014 101
Figure 3 shows comparison of solution proposed by [9] and proposed
solution, by which several observations such as the Solution 1 [9] heavily
suffers from Black Hole attack. Figure 3(a) depicts that Solution 2 raises
PDR by 30 to 40% whereas in Figure 3 (b), Solution 2 achieves better
throughput almost twice the throughput obtained in Solution 1. However
Figure 3 (c) demonstrates impact of attack on end-to-end delay. Solution 2
accomplishes less end-to-end delay than Solution 1 since it takes less time
to find a secure route by exempting misbehaving nodes at initial stage.
In Solution 1, a node responding to route request can be selected to form a
secure path and further, a Coordinator node is responsible to detect any
anonymous activity by waiting for incoming packets over a period of time.
This procedure may introduce more delay and also affects throughput.
Whereas, Solution 2 prefers a node with its trust assessment that presents its
prior performance. If a node is observed performing well then that would be
selected to form a secure path. Consequently, it can be stated that trust based
solution mitigate significantly Black Hole attack. Evaluation of
trustworthiness of nodes gives better results as compared to waiting_time
based Black Hole attack detection procedure. Trust Metric estimation
achieves improved Packet Delivery Ratio (PDR), Throughput and obtains
less end-to-end delay. Proposed solution is additionally tested for increasing
number of nodes to examine its scalability and adaptability for real-time
scenarios. For this purpose, PDR, Throughput and Delay are investigated for
varying number of nodes and with the presence of Black Hole attack.
Following Figure 4 shows results of performance parameters for varying
number of nodes.
(a) No. of Nodes Vs Packet Delivery Ratio (b) No. of Nodes Vs Throughput
(c) Number of Nodes Vs End-to-end Delay
Figure 4. Graphs for Varying Number of Nodes](https://image.slidesharecdn.com/vol14no2-september2014-171208072404/85/Vol-14-No-2-September-2014-104-320.jpg)
![International Journal of Computer Science and Business Informatics
IJCSBI.ORG
ISSN: 1694-2108 | Vol. 14, No. 2. AUGUST/SEPTEMBER 2014 102
Figure 4 (a), Figure 4 (b) and Figure 4 (c) signify that proposed solution
works satisfactorily for increasing number of nodes. There is no significant
difference achieved in PDR, Throughput and Delay for increasing number
of nodes. It is observed that trust based solution detects Black Hole nodes
despite rising number of nodes and proficiently scalable to real time
environment. Most importantly, to optimize effective utilization of proposed
system under real time scenarios and greater number of nodes additional
resources need to be provided.
5. CONCLUSION
Introduction of proposed efficient and secure routing protocol to identify
single and cooperative Black Hole attack chains in a self-motivated
environment and thereby generates a secure routing path from source node
to the destination node. Proposed protocol encloses a feasible trust based
solution that examines trustworthiness of neighboring nodes. This approach
keeps misbehaving nodes aside from being a part of a network
communication process before actual Black Hole detection procedure is
initiated. Proposed protocol has formed a Hierarchical Cluster Topology and
simulated at several intervals. A proposed solution as well as solution
proposed by [9] is simulated using Network Simulator Tool NS2 and
performance is analyzed in terms of Packet Delivery Ratio, Throughput and
End-to-end Delay. Simulation results depict that proposed system has been
highly effective and adaptable under dynamic environment circumstances
and accomplishes significant improvement than existing solution [9].
Additionally, a trust based solution is experimentally observed to be
scalable to medium-scale test bed environment for different simulated
conditions. A trust based system is packet traffic efficient and time efficient
as it facilitates significant improvement in data delivery for dynamic
topology with minimum delay.
REFERENCES
[1] Akyildiz I.F., Su W., Sankarasubramaniam Y., Cayirci E., Wireless sensor networks:
a survey, Elsevier Science B.V., Computer Networks 38 (2002), 393–422, 2002.
[2] Goyal P., Parmar V., Rishi R., MANET: Vulnerabilities, Challenges, Attacks,
Application, IJCEM International Journal of Computational Engineering &
Management, Vol. 11, January 2011.
[3] Razak S. A., Furnell S. M., Brooke P. J., Attack against Mobile Ad Hoc Networks
Routing Protocols, University of Plymouth.
[4] T. Kavitha, D. Sridharan, Security Vulnerabilities in Wireless Sensor Networks: A
Survey, Journal of Information Assurance and Security, Vol. 5, pp. 031-044, 2010.
[5] Sen J., Koilakonda S., Ukil A., A Mechanism for Detection of Cooperative Black
Hole Attack in Mobile Ad Hoc Networks, Tata Consultancy Services Ltd.
[6] Karakehayov Z., Using REWARD to detect team black-hole attacks in wireless sensor
networks, In ACM Workshop on Real-World Wireless Sensor Networks, 2005.](https://image.slidesharecdn.com/vol14no2-september2014-171208072404/85/Vol-14-No-2-September-2014-105-320.jpg)
![International Journal of Computer Science and Business Informatics
IJCSBI.ORG
ISSN: 1694-2108 | Vol. 14, No. 2. AUGUST/SEPTEMBER 2014 103
[7] Tiwari M., Arya K. V., Choudhari R., Choudhary K. S., Designing Intrusion
Detection to Detect Black Hole and Selective Forwarding Attack in WSN based on
local Information, Fourth International Conference on Computer Sciences and
Convergence Information Technology, IEEE, 2009.
[8] Sheela.D, Srividhya.V.R, Begam A, Anjali and Chidanand G.M., Detecting Black
Hole Attacks in Wireless Sensor Networks using Mobile Agent, International
Conference on Artificial Intelligence and Embedded Systems (ICAIES'2012) , July 15-
16, 2012.
[9] Wazid M., Katal A., Singh R., Sachan, Goudar R. H., Singh D. P., Detection and
Prevention Mechanism for Blackhole Attack in Wireless Sensor Network,
International conference on Communication and Signal Processing, IEEE, April 3-5,
2013.
[10] Athmani S., Boubiche D. E., Bilami A., Hierarchical Energy Efficient Intrusion
Detection System for Black Hole Attacks in WSNs, IEEE, 2013.
[11] Atakli I. M., Hongbing H., Yu Chen, Wei-Shinn Ku, Zhou Su, Malicious Node
Detection in Wireless Sensor Networks using Weighted Trust Evaluation, SpringSim,
2008.
[12] Dr. Virmani D., Hermrajani M., Chandel S., Exponential Trust Based Mechanism to
Detect Black Hole attack in Wireless Sensor Network.
[13] Janani C., Chitra P., Trust Evaluation Based Security in Wireless Sensor Network,
International Journal of Latest Trends in Engineering and Technology (IJLTET), Vol.
2 Issue 1, January 2013.
[14] Wei C., Yang J., Gao Y., Zhang Z., Cluster-based Routing Protocols in Wireless
Sensor Networks: A Survey, International Conference on Computer Science and
Network Technology, IEEE, 2011.
[15] Singh S., Singh M. P., Singh D. K., A Survey of Energy-Efficient Hierarchical
Cluster-Based Routing in Wireless Sensor Networks, International Journal of
Advanced Networking and Applications, Vol. 02, Issue 02, pp. 570-580, 2010.
[16] Tryambake J. S., Pathak G. R., Patil S. H., A Survey on Black Hole Attack Detection
and Prevention Methods in MANET and WSN, 3rd
International Conference on
Recent Trends in Engineering and Technology (ICRTET’2014), Elsevier Publication,
Vol. 1, 28-30 March, 2014.
[17] Ebenezar jebarani M.R. and Jayanthy T., An Analysis of Various Parameters in
Wireless Sensor Networks Using Adaptive Fec Technique, International Journal of
Ad hoc, Sensor & Ubiquitous Computing (IJASUC), Vol.1, No.3, September 2010.
This paper may be cited as:
Pathak, G. R.., Patil, S. H., Tryambake, J. S., 2014. Efficient and Trust
Based Black Hole Attack Detection and Prevention in WSN. International
Journal of Computer Science and Business Informatics, Vol. 14, No. 2, pp.
93-103.](https://image.slidesharecdn.com/vol14no2-september2014-171208072404/85/Vol-14-No-2-September-2014-106-320.jpg)

![International Journal of Computer Science and Business Informatics
IJCSBI.ORG
ISSN: 1694-2108 | Vol. 14, No. 2. AUGUST/SEPTEMBER 2014 105
are persistent but are inadequate of processing with dynamic data that
constantly changes [6].
Real-time Database System (RTDBS) derived from traditional database
systems and provide the same capabilities, but they are defined by timing
constraints associated with the transactions of the data. Since the data is
associated with a period of time for which the data is valid and can be
considered to represent the true state of the system at a given time [2].
Moreover, real-time database system is processing system that is designed
to manage workloads whose state is constantly changing and to stop trying
reliable responses [6]. RTDBS must process transactions and guarantee
database consistency [2].
There are two kinds of transactions in database management system.
They are read-only transactions (ROTs) and update transactions (UTs).
These transactions can have four ACID properties. These properties are
Atomicity, Consistency (Concurrency), Isolation (Independence) and
Durability (or Permanency) [1]. An update transaction (UT) is a transaction
which can perform both read and write operations on database. An ROT is a
transaction that contains only read operations which do not modify data. If
an ROT conflicts with a UT, the processing of ROT is delayed till the
corresponding UT terminates. Also, if a UT conflicts with an ROT, the
processing of UT is delayed till ROT gets the access to the objects. Also, if
a UT conflicts with another UT, the processing of UT is delayed till another
UT gets the access to the objects. As a result, the throughput performance
(number of transactions processed per second) deteriorates as data
contention increases [1].
Real-time Database System (RTDBS) used in Mobile Environment
provide information to Mobile Host (Mobile User). In mobile environment,
Mobile Users (Mobile Host) can initiate transactions and that transactions
may be executed at Mobile User (MU) or Fixed Host (FH). Most of the
transactions used in mobile environment are flat transactions. In modern
world, most applications are complex and long-running and flat transactions
could not work properly in these applications. Moreover, flat transactions
can perform only commit or rollback and cannot save intermediate results. If
transactions were rollback, the whole transaction will be restarted. To solve
this problem, proposed method (Concurrency Control Mechanism Using
Modified SCC-2S Algorithm) based on closed-nested transactions model
because nested transactions are suited for complex application and can save
intermediate result. Nowadays, Airline Businesses are very popular and
most of the users want to access this information from mobile environment.
To reach the desire destination, most of the airlines use transit. So, there is
an issue to control concurrent access in Airline Reservation System.](https://image.slidesharecdn.com/vol14no2-september2014-171208072404/85/Vol-14-No-2-September-2014-108-320.jpg)

![International Journal of Computer Science and Business Informatics
IJCSBI.ORG
ISSN: 1694-2108 | Vol. 14, No. 2. AUGUST/SEPTEMBER 2014 107
retrieval) in spite of the difference of the principal and philosophical design.
The purpose of O/R mapping is to solve the Object-Relational impedance
mismatch issue and provides the seamless conversion between them
reducing the typical and complicated work from developers. It can be used
in matching with Struts, Spring, and Hibernate JEE (Java Enterprise
Edition) framework. The work of the Synchronizer is to synchronize
between threads. Transactions from mobile host enter the system as a
thread. In JEE, synchronize method can be used to control the work of
threads.
There are many kinds of lock used in database management system. They
are database level, table level, page level, row level or field (attribute) level
[4]. Proposed method performs concurrency control in row level. So,
proposed system use row level lock. So, proposed method not need to lock
database, table and page level. So, many transactions can perform database
operation concurrently. In proposed method, transaction with late times
block if conflict occurs between transactions. It cannot require creating save
point and log files. Database server can perform this work automatically and
can save intermediate result. If commit transaction release lock, it resumes
its execution form the point that conflict occurs.
Illustration of SCC-2S works is , shown in “Fig. 1”, Two mobile hosts
MH1 and MH2 access the same data item x. MH1 execute Transaction T1 to
write data item x. MH2 execute Transaction T2 to read data item x. Both
transactions T1 and T2 start with one primary shadow, namely T1
0
and T2
0
respectively. When T2
0
try to read object x, a potential conflict is
discovered. At that time, a standby shadow, T2
1
, is created (means the
transaction T2
0
is blocked when transaction T1
0
release its lock). If T1
0
successfully validates and commits on behalf of transaction T1, the standby
shadow T2
1
resumes its execution [5].
T1
0
T2
0
T2
1
s
s
Rx
Wx
Rx
V/C
V/C
S: Begin Transaction
WX: Write on object x
V/C:Valid and Commit
A
A:Abort
Blocked
RX: Read on object x
T2
Deadline](https://image.slidesharecdn.com/vol14no2-september2014-171208072404/85/Vol-14-No-2-September-2014-110-320.jpg)


![International Journal of Computer Science and Business Informatics
IJCSBI.ORG
ISSN: 1694-2108 | Vol. 14, No. 2. AUGUST/SEPTEMBER 2014 112
3. GENERAL RULES FOR PROPOSED METHOD
(CONCURRENCY CONTROL MECHANISM USING MODIFIED
SCC-2S ALGORITHM)
Proposed method is applied in AirLine Reservation System and use two
database for propose method. Proposed method use fId for flightId, rId for
routeId, date for reservation_date, r for reach time and n for no of transit
count.
Begin
Income write lock request transaction Twt
Add Twt into object array named list
for (int i=0;i<list.length-1;i++){
for (int j=i+1;j<list.length;j++){
If(list[i].fId&&rId&&date ≠ list[j]. fId&&rId&&date)
Transactions run concurrently.
Elseif (list[i].fId&&rId&&date==list[j]. fId&&rId&&date)
If (list[i]. fId&&rId.r < list[j]. fId&&rId.r)
wait list[j]
Else if (list[i]. fId&&rId.r == list[j]. fId&&rId.r)
Check data can get only one database or not
If (list[i] access only one database and list[j] access more than
one database)
wait list[j]
Else if (list[i] and list[j] access only one database)
Check n
If(n of list[i]> n of list[j])
wait List[i]
Else
wait List[j]
Elseif(list[i] and list[j] access more than one database)
Check n
If(n of list[i]> n of list[j])
wait list[i]
Else
wait list[j]
Else
wait list[i]
Else
wait list[i]
End if
}
}
End](https://image.slidesharecdn.com/vol14no2-september2014-171208072404/85/Vol-14-No-2-September-2014-115-320.jpg)

![International Journal of Computer Science and Business Informatics
IJCSBI.ORG
ISSN: 1694-2108 | Vol. 14, No. 2. AUGUST/SEPTEMBER 2014 114
•Whenever it is decided to commit transaction Ts, then release all of it’s
acquire lock and transfer it locks to the transactions in the WaitFor list.
4. ANALYSIS OF CONCURRENCY CONTROL USING PROPOSED
METHOD AND OTHER CONCURRENCY CONTROL
ALGORITHMS
Real-time database management system is a combination of conventional
database management system and real-time system. Like other database
system, real-time database system can process transactions and guarantee
database consistency. Furthermore, this database system can operate in real-
time that satisfy time constraints on each transaction.
Existing concurrency control algorithms for conventional database
systems attempt to maximize concurrency, but ignore timing constraints.
Deadline scheduling algorithms for conventional real-time systems do
consider timing constraint, but ignore data consistency problems. Since
concurrency control algorithms may introduce unpredictable delay due to
transaction restarts and blocking, there is clearly a real need for a
concurrency control model that combines the timeliness of deadline
scheduling algorithms and the data consistency provided by conventional
concurrency control algorithms [6].
Various concurrency control algorithms differ from the time when
conflicts are detected, and the way they are resolved. Most of concurrency
control method based on Pessimistic Concurrency Control (PCC) and
Optimistic Concurrency Control (OCC). But in mobile environment, most
of the method based on OCC. In OCC, each transaction perform database
operation using three distinct phases- read phase, validation phase and write
phase. Moreover, OCC can only detect conflicts at transaction commit time
and resolve these conflicts by restarting conflict transactions. Moreover,
most of the concurrency control method used in mobile environment lead to
Mobile Ad-hoc Network. In this network MHs perform database operation.
It is good for controlling central bottleneck. But it requires a lot of other
things to increase performance and reduce system performance. So,
proposed system performs database operation at fixed host. To use OCC,
MHs have Database System Module to perform database operations. After
finishing database operation, MHs send result back to FH to check conflicts
or not. If conflicts occur between transactions, only one MH write request is
performed and other MHs must perform database operations again.
Pessimistic Concurrency Control (PCC) is based on two phase locking
protocol. In this method, concurrent users access a row and only one user](https://image.slidesharecdn.com/vol14no2-september2014-171208072404/85/Vol-14-No-2-September-2014-117-320.jpg)
![International Journal of Computer Science and Business Informatics
IJCSBI.ORG
ISSN: 1694-2108 | Vol. 14, No. 2. AUGUST/SEPTEMBER 2014 115
can get this row. That row is unavailable to other users until the acquired
user release that row . So, if conflicts occur between transactions, conflicted
transactions perform database operation again. PCC can detect conflicts
immediately when they occur and resolve these conflicts using blocking.
PCC algorithm is mostly useful in situations where it is harmful for the
record to change during transaction processing time. But, PCC is not useful
in a disconnected architecture. To use PCC in Mobile Environment,
connections are open only long enough to read or update the data, so this
method requires sustaining locks for long periods. PCC blocking based
conflict resolution policy require a lot of resource. Moreover, this method
can miss the deadlines as a result of unbounded waiting due to blocking.
When the original SCC-2S method is analyzed, it can only handle read-
write conflicts. When compares with read and write conflict, read priority is
lower than write priority. So, in this method, read transaction only executes
as a standby shadow. In real time database system, concurrent users can
encounter Read-Write conflict as well as Write-Write conflict. Therefore,
proposed system manipulates this condition. Moreover, concurrency control
methods use priority theory to increase performance and to reduce deadline.
So, proposed method also added priority theory.
Proposed method Concurrency Control Mechanism using Modified SCC-
2S Algorithm completely eliminates the complicated locking problems and
delay commit. This approach is useful for critical real-time database system.
And also according to the MySQL server nature, it can be manipulated the
concurrent 1400 users [7]. When our proposed method is used in Dynamic
Web Application Architecture, it can manage more than concurrent 1400
users expected. Moreover, it is very compatible methods for not only flat
transactions but also nested transactions.
4.1. Performance Result
“Fig. 7” shows performance metric of memory usage for ten concurrent
users and “Fig.8” shows performance metric of response time for ten
concurrent users.](https://image.slidesharecdn.com/vol14no2-september2014-171208072404/85/Vol-14-No-2-September-2014-118-320.jpg)
![International Journal of Computer Science and Business Informatics
IJCSBI.ORG
ISSN: 1694-2108 | Vol. 14, No. 2. AUGUST/SEPTEMBER 2014 117
REFERENCES
[1] T. Ragunathan, Speculation-Based Protocols for Improving the Performance of Read-
Only Transactions, Center for Data Engineering, International Institute of Information
Technology, Hyderabad, India, December 2010.
[2] S. A. Bukhari, and S. R. Aparicio, A Survey of Current Priority Assignment Policies
(PAP) and Concurrency Control Protocols (CCP) in Real-Time Database Systems
(RTBDS), 2012.
[3] S. A. Moiz, S. N. Pal, J. Kumar, P. Lavanya, D. C. Joshi, and G. Venkataswamy,
Concurrency Control in Mobile Environments: Issues & Challenges, International
Journal of Database Management Systems (IJDMS), vol.3, no.4, November 2011.
[4] P. Rob, and C. Coronelm, Database System: Design, Implementation, and
Management, 8th Edition, Course Technology, Cengage Learning, ISBN- 13: 978-1-
4239-0201-0, ISBN- 10: 1-4239-0201-7, USA, 2009, pp.412-440, pp.494.
[5] A. Bestavros, S. Braoudakis, and E. Panagos, Performance Evaluation of Two-Shadow
Speculative Concurrency Control, Computer Science Department, Boston University,
Boston, MA 02215, February 1993.
[6] V. Swaroop, G. K. Gupta, and U. Shanker, Issues In Mobile Distributed Real Time
Databases: Performance And Review , India, 2011.
[7] A. DIN, Structured Query Language (SQL) A Practical Introduction, University of
Rome La Sapienza, May 1994, http://www.dis.uniroma1.it.
This paper may be cited as:
Nyo. N. Y. and Hninn. A. T., 2014. Design and Analysis of Concurrency
Control Mechanism Using Modified SCC-2S Algorithm in Mobile
Environment. International Journal of Computer Science and Business
Informatics, Vol. 14, No. 2, pp. 104-117.](https://image.slidesharecdn.com/vol14no2-september2014-171208072404/85/Vol-14-No-2-September-2014-120-320.jpg)
![International Journal of Computer Science and Business Informatics
IJCSBI.ORG
ISSN: 1694-2108 | Vol. 14, No. 2. AUGUST/SEPTEMBER 2014 118
Optimized Buffer Control Mechanism
for Wireless LAN Mesh Networks
Lakshmi Rani, Rutuja Shah, Varsha Anandani
and Prof. S. S. Manivannan
School of Information Technology & Engineering,
VIT University
ABSTRACT
In wireless mesh networks, the legacy stations lead to heavy congestions in network due to
buffer overflow. Using buffer control mechanisms this drawback is achieved fairly as it services
the high priority nodes first and lower priority nodes are kept waiting till back-off time period.
In order to address this problem, this paper proposes an optimized congestion scheme for
legacy nodes which will help to reduce the back-off time period of lower priority nodes and
reduce congestion considerably.
Keywords
MHCCA (modified hybrid coordination function controlled channel access), MP(Mesh point),
MPP(Mesh Portal), MAP(Mesh Access point),end-to-end delay.
1. INTRODUCTION:
Wireless Local Area Network (WLAN) mesh networking are easy to use , low
cost and very flexible because of which they have become very popular [9].
A mesh network is generally set up different in location which have limited
infrastructure in order to give connectivity in ubiquitous way. Wireless mesh
networks consist of radio nodes organized in mesh topology. It consists of mesh
clients, gateways and mesh routers. Any WLAN mesh network is consisted of
MPs (Mesh points)to provide multi-hop connectivity using the wireless
network interface so that it can be applied laptop computers and in consumer
electronic devices [8].Cell phones, laptops and few other wireless devices are
nothing but the wireless mesh clients. Mesh routers will forward the packets to
wireless mesh routers which will in turn forward the traffic to gateways. These
gateways may or may not be connected to the internet as shown in figure 1.This
traffic flow is bi-directional. Generally a mesh network is reliable and but offers
redundancy. When any node fails to operate, the rest of the nodes can still
connect with each other, directly or indirectly through one or more intermediate](https://image.slidesharecdn.com/vol14no2-september2014-171208072404/85/Vol-14-No-2-September-2014-121-320.jpg)
![International Journal of Computer Science and Business Informatics
IJCSBI.ORG
ISSN: 1694-2108 | Vol. 14, No. 2. AUGUST/SEPTEMBER 2014 119
nodes. 802.11, 802.15, 802.16, cellular technologies or combinations of more
than one type of wireless technology are been used to implement wireless mesh
networks.
Figure 1 Wireless Mesh Networks
2. LITERATURE SURVEY:
Wireless LAN mesh networks are dynamically self-organized and self-
configured. This paper [4] uses the following terminology as per IEEE standard
802.11.
1) Legacy stations (STAs): legacy stations are those nodes which exist in
network but are not in use for a longer period.
2) Mesh Point (MP): MP is analogues to an access point that directs the
frames on the basis of their MAC header information.
3) Mesh Access Point (MAP): MAP in a MP having wireless LAN
functions for access points jointly with MP functions.
4) Mesh Portal (MPP): MPP is also a MP which is juxtaposed with mesh
portal with a well-equipped gateway function in order to enhance the
functionality of MP.](https://image.slidesharecdn.com/vol14no2-september2014-171208072404/85/Vol-14-No-2-September-2014-122-320.jpg)
![International Journal of Computer Science and Business Informatics
IJCSBI.ORG
ISSN: 1694-2108 | Vol. 14, No. 2. AUGUST/SEPTEMBER 2014 120
5) IEEE 802.11 e Enhanced distributed channel access:
IEEE 802.11 e is a valid standard defined by IEEE that is specifically
used for wireless LAN networks. EDCA protocol is a prolong form of
IEEE 802.11. DCF (distributed co-ordination function) performs an
effective use of CSMA/CA to provide channel access between multiple
stations. EDCA [5] works upon priority levels or access categories.
6) IEEE 802.11 e Hybrid coordination function controlled channel
access(HCCA):
HCCF is the most advance and complex standard that is used for
wireless mesh networks. It enhances the network with advanced traffic
priority. It is well equipped with a hybrid controller (HC) i.e. medium
controller.
7) IEEE 802.11 s:
IEEE 802.11 s is reserved for mesh networks. It defines how actually a
mesh network interconnected using mesh points. It can be used for both
static as well mobile networks.
The IEEE 802.11 MAC layer provides two types access mechanisms:
Distributed Coordination Function (DCF) and Point Coordination Function
(PCF) [10]. PCF is a MAC with centralized working and so not applied in
distributed mesh networks [7].While DCF is the basic access mechanism of the
IEEE802.11 and it is based on Carrier Sense Multiple Access with Collision
Avoidance (CSMA/CA). The MAC protocol of 802.11e which is the Hybrid
Coordination Function (HCF) has supporting feature for both contention-based
and controlled channel access [11].The Enhanced Distributed Channel Access
(EDCA) mechanism implements HCF, which is nothing but an extension of the
DCF mechanism which with the help of multiple access categories (ACs)
enables distributed differentiated [6] access to various the wireless channel.
There is a smaller minimum contention window CWmin (minimum congestion
window) for higher access category stations, hence have a higher probability
than others to access the common channel. Thus, in IEEE 802.11, overall
access time will be divided into Contention period (CP) and Contention free
period (CFP).In EDCA, all stations will compete for accessing the media in
CPby implementing different IFSs (Inter frame Space). But all the time only the
highest priority will have the shortest random back-off window i.e. the shortest
IFS. Hence the station successfully grabs the access media while the other
longer IFS will have to wait for some time. In HCCA, it works in the CFP,
where all stations will send their request to the [2] QAP (QoS Supportive
Adaptive Polling)station who will grant the permission for each station in order](https://image.slidesharecdn.com/vol14no2-september2014-171208072404/85/Vol-14-No-2-September-2014-123-320.jpg)
![International Journal of Computer Science and Business Informatics
IJCSBI.ORG
ISSN: 1694-2108 | Vol. 14, No. 2. AUGUST/SEPTEMBER 2014 121
to use the access media. But then, in HCCA mode, the CP will be used by
implementing CAP (Controlled Access Phase).Because priority is not assigned
amongst the accepted or requested stations.
In the HCCA, irrespective of their importance the QAP will serve all stations
according to their arrivals .That is why, a very important role is played by
admission control for both policies and mechanisms. Also since EDCA is
designed for single-hop networks then using EDCA to multi-hop networks such
as WLAN mesh network may lead to performance degradation. In WLAN
mesh networks, [1] EDCA-compliant relay access points (APs) can lead to
congestion because of the decrease in number of transmission opportunities.
The legacy stations residing in wireless mesh networks sometimes tend to cause
buffer overflow. This may lead to congestion control and degrades the
performance of the network. In order to address this problem, a congestion
control mechanism was adopted. However, few drawbacks were noticed in this
buffer control mechanism. In order to resolve this, an optimized way of
handling congestion control is been introduced in this paper.
3. PROPOSED WORK:
In wireless mesh networks, HCF (hybrid coordination function) controlled
channel access (HCCA) can be used in a modified way alias M-HCCA i.e.
modified HCCA. In this paper, an enhanced way of implementing HCCA in
order to improve its performance is proposed.
In this M-HCCA, during a CAP, the Hybrid Coordinator (HC)—which is also
the AP—controls the access to the medium. Whenever there is need to transmit
packets, a mesh client will send request frame to HC. However, there is slight
change in HCCA functioning. The nodes within the network can set an URG
(urgent) flag if it requires sending the frames urgently to destined nodes. The
HC will check for URG flag first to decide which frames to be send first. If
HC finds such flag with the node’s frame request it will send that frame first as
shown in figure 2. Thus priority is set high due to URG flag. If URG flag is not
assigned to particular node then those nodes will be buffered and will be sent to
destined nodes later. For the buffered nodes, which are waiting to get serviced
will be served according to scheduling mechanism. In order to keep high
throughput, round-robin scheduling techniques for low priority nodes.](https://image.slidesharecdn.com/vol14no2-september2014-171208072404/85/Vol-14-No-2-September-2014-124-320.jpg)
![International Journal of Computer Science and Business Informatics
IJCSBI.ORG
ISSN: 1694-2108 | Vol. 14, No. 2. AUGUST/SEPTEMBER 2014 123
4. SIMULATION RESULTS:
4.1 Simulation Scenario:
The proposed scheme is simulated using Qualnet 4.5.1 [3] with simulation
parameters mentioned in table 1. Table 2 and 3 show the AODV statistics and
application statistics respectively. Table 4 shows CBR client and CBR server
parameters. Figure 4 shows the network scenarios without the use of ROC. The
simulation settings done to implement proposed scheme are shown in figure 5
and figure 6 shows the priority mechanism for the same. After the simulation is
performed with required settings, figure 7 shows the network topology with the
proposed scheme.
Table 1 Experimental parameters
Figure 4 Network topology without ROC
Table 2 AODV statistics
Sr. No. Parameter Values
1 Network protocol Internet Protocol (IP)
2 Application FTP and Telnet
3 Routing protocol AODV(Ad-hoc On Demand
distance Vector routing
protocol)
4 Size of data to be sent
(bytes)
1024
5 Number of packet 512
6 Start time (s) 1
7 End time (s) 150
8 Interval (s) 0.25
9 Simulation time(s) 300
Sr. Parameters Source Destination](https://image.slidesharecdn.com/vol14no2-september2014-171208072404/85/Vol-14-No-2-September-2014-126-320.jpg)
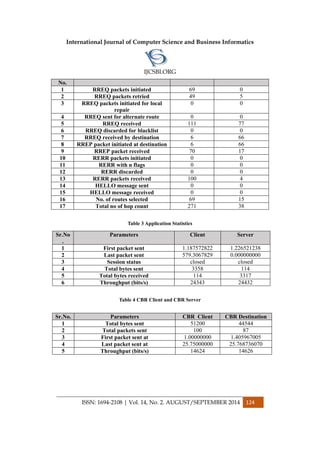
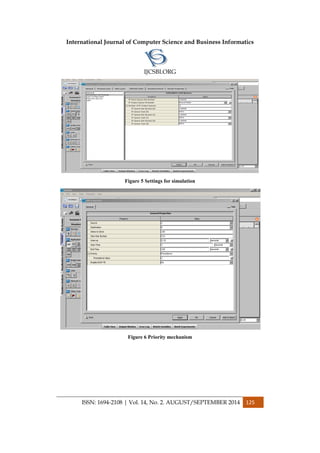
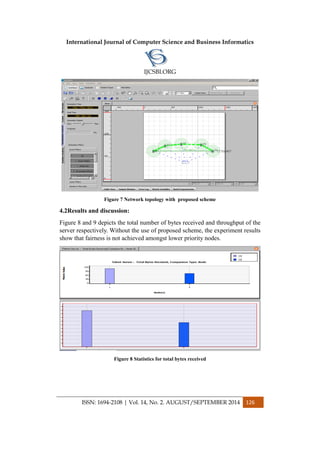
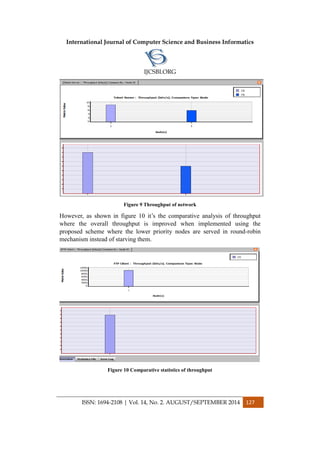
![International Journal of Computer Science and Business Informatics
IJCSBI.ORG
ISSN: 1694-2108 | Vol. 14, No. 2. AUGUST/SEPTEMBER 2014 128
Finally it can be concluded that the proposed scheme of m-HCCA is helpful in
improving throughput and efficiency of the network and thus achieves better
network performance by providing fairness to the lower priority nodes.
6. ADVANTAGES:
1) Higher priority nodes are provided with fairness with the use of URG
pointer.
2) Lower priority nodes are not starved and are served in round-robin
fashion with specific time slice.
3) End-to-end delay is reduced.
4) Throughput and overall performance of network is improved.
7. LIMITATIONS:
1) Buffered nodes can further be served with better priority schemes.
2) Security of nodes with carrying URG pointer should be taken care
against attacks.
8. CONCLUSION:
An effective, simple and modified way of implementing HCCA congestion
control scheme for wireless mesh networks is been put forth n this paper. At
first, the analysis of the reasons behind the inefficiency and unfairness on the
nodes for transmission in wireless mesh networks was done. An experimental
setup was done in order to analyze the results and applicability of this proposed
work. The usage of URG pointer provides fairness to nodes with higher priority
for transmission. Because of this the end-to-end delay and throughput of
network is improved considerably. Thus the performance of network is
enhanced. The upcoming work in this will be studying the behavior of network
in more complex scenarios. Also the effect of variable time slice for lower
priority nodes using round-robin scheduling can be studied and worked upon as
the future scope.
9. REFERENCES:
[1] Jun, K., Shiro, S., Nobuyoshi, K., Shigeo, S. and Tutomu, M., 2013Relay Access Point
Congestion Control Scheme using Buffer Control for Wireless LAN Mesh networks. Wireless
Personal Multimedia Communications (WPMC) 16th International Symposium, pp. 1-5.](https://image.slidesharecdn.com/vol14no2-september2014-171208072404/85/Vol-14-No-2-September-2014-131-320.jpg)
![International Journal of Computer Science and Business Informatics
IJCSBI.ORG
ISSN: 1694-2108 | Vol. 14, No. 2. AUGUST/SEPTEMBER 2014 129
[2] Saranyu, H. and Anan, P. 2010Priority based HCCA for IEEE 802.11e. International
Conference on Communications and Mobile Computing. Vol. 6,pp. 485 – 489.
[3] Qual Net 4.5.1 Installation Guide Version 4.5.1, University of California, Los Angeles
(UCLA), July 2008.
[4]Hidenori, A., Shinji, T. and Akira, Y., 2006 IEEE 802.11s Wireless LAN Mesh Network
Topology , NTT Docomo Technical Journal , Vol 8. No.2
[5] Yamada, A., Atsushi, F., Sadeghi, B., and Yang, L., 2006EDCA Based Congestion Control
for WLAN Mesh Networks. Vehicular Technology Conference, VTC 2006-Spring. IEEE
63rd Vol.3, pp. 1288-1292.
[6] Vasilios, A. and Costas, C. 2006Resource Control for the EDCA and HCCA Mechanisms in
IEEE 802.11e Networks. Modeling and Optimization in Mobile, Ad Hoc and Wireless
Networks, 4th International Symposium , pp. 1-6.
[7] Sadeghi, B., Yang, L. and Yamada, A.,2005 MAC Components in IEEE802.1ls IEEE802.11-
05/0167rl, March.
[8] Conner, W.S. and Agre, J., 2005 IEEE 802.11 TGs Usage Models. IEEE 802.11 Task Group
S, Submission 11-04-0662-16-000s.
[9] Matsumoto, Y., Hagiwara, J., Fujiwara, A., Aoki, H., Yamada, A., Takeda, S. and Yagyu, K.,
2004 A Prospective Mesh Network Based Platform for Universal Mobile Communication
Services. IEICE General Conference.
[10] ANSI/IEEE Std 802.11 2003 Edition.
[11]Gu, D. and Zhang, J., 2003 QoS Enhancements in IEEE 802.11 Wireless Local Area
Networks .IEEE Communication Magazine, pp. 120–124.
This paper may be cited as:
Rani, L., Shah, R., Anandani, V. and Manivannan, S. S. Optimized Buffer
Control Mechanism for Wireless LAN Mesh Networks. International Journal
of Computer Science and Business Informatics, Vol. 14, No. 2, pp. 117-129.](https://image.slidesharecdn.com/vol14no2-september2014-171208072404/85/Vol-14-No-2-September-2014-132-320.jpg)
![International Journal of Computer Science and Business Informatics
IJCSBI.ORG
ISSN: 1694-2108 | Vol. 14, No. 2. AUGUST/SEPTEMBER 2014 130
Presentation of Fuzzy Model to
Compute the Edge Betweenness
Centrality in Social Networks
Noushin Saed
Department of computer engineering, College of engineering, Khouzestan Science and Research
Branch, Islamic Azad University, Ahvaz, Iran
Mehdi Sadeghzadeh and Mohammad Hussein Yektaie
Department of Computer engineering, Islamic Azad University, Khuzestan, Mahshahr,Iran
ABSTRACT
Nowadays, we live in network area. The area through which the formation of various social
network, new communicative and informing methods are introduced to the widespread social
communications. A social network is a social structure which is made out of individuals and
meanwhile, by the pass of time, the analyzing these social network will gain increasing primacy.
In this research, one of the parameters of social network analysis called edge betweenness
centrality is introduced. Edge betweenness is an edge to compute the shortest paths between pair
of no desin the network that passes through it most frequently.In this research, to detect the
communities through edge betweenness centrality algorithm, a method is introduced in such a
way that each edge by receiving one fuzzy membership degree in the interval [1,0] the measure of
its effect on the network will be different. One of the features of this algorithm that makes it
distinguished from others is the application of fuzzy logic to detect the communities of social
network. Then by introducing the density of each cluster the density measure of the communities
graph is computed through considering the fuzzy detected structures. The finding of the
implementation of algorithm indicated that introduced algorithm to compute the density of
samples and to detect the number of mono-nodes while clustering has revealed more accuracy
rather than the related works.
Keywords
Social Networks, Community Detecting, Community Clustering, Membership Degree, Edge
Betweenness.
1. INTRODUCTION
The researches have revealed that mostly there are some common features among
real networks, such as biological systems and cooperating scientific systems.
Among these common features “community structure” has attracted the focus of
attention. The community system is defined to explicate the clustering of social
networks. A community structure of network can be simply divided into different
community [1]. The connection between the different nodes in community is
denser in proportion to the connection of these nodes with other nodes. Although](https://image.slidesharecdn.com/vol14no2-september2014-171208072404/85/Vol-14-No-2-September-2014-133-320.jpg)
![International Journal of Computer Science and Business Informatics
IJCSBI.ORG
ISSN: 1694-2108 | Vol. 14, No. 2. AUGUST/SEPTEMBER 2014 131
there is not any general definition of community yet; however some accepted
measurable parameters are investigated to recognize these kinds of community
structure and their importance in determined networks to improve the efficiency
and the time of implementation [2]. But in this research study we believe that to
realize the detection of communities in social networks the priority should not be
given to the time of implementation. Of course, known that clustering is a NP
HARD algorithm, a kind of algorithm should be introduce that when we have
polynomial it can solve the problem. Therefore, giving priority to and much
attention the time of implementation can reduces the accuracy in community
detecting and will result in the fact that a number of communities that are really
present in social network be lost due to the improvement of the time of
implementation. Structure of the present paper is as follow: Next part is assigned
to review of literature. In part 3, edge betweenness centrality algorithm and its
characteristics have been described. Proposed method is presented in part 4, and
description of Simulation is presented in part 5. Finally, part 6 includes
conclusion and some future works.
2. RELATED WORKS
Clustering, put it in another term, the recognition of communities as one of
interests to the science of data mining has been investigated and studied. Usually,
a community in network is a group of nodes that their connection in intra-
community arrangement is more than to the rest of the network [3].This intuitive
definition has been formalized in a number of competing ways, usually by way of
a quality function, which quantifies the goodness of a given division of the
network into communities. Some of these quality functions measures like
modularity and normalized cuts are more common than other cases but none of
them has gained public acceptance since one criterion in all situations is not
workable. Algorithms for community discovery deal to problem as well as the
features of efficiency from different perspectives. However, this will obviously
improve a particular quality criterion. Spectral methods, Kerighan-lin (KL)
algorithm and flow-based postprocessing are examples of algorithm that attempt
obviously to particular standard quality[4].Hierarchical methods are one of the
traditional methods of community clustering. In this hierarchical clustering
method, a hierarchical structure in a tree model is dedicated to the final clusters
according to the amount of their commonness. This hierarchical tree is called
dendrogram. The methods of hierarchical clustering techniques are usually
according to Greedy and Stepwise-optimal algorithms. The clustering methods
according to productive hierarchical structure through them are usually divided
into Bottom-Up (agglomerative) and Top-Down (Divisive) algorithms[5].
Agglomerative algorithms begin to function with a node as a community in the
network and they merge similar communities in each stage. This repetitive
process continues until an ideal number of communities emerge up or the other
nodes for merging are dissimilar to one another. The divisive algorithms operate
in regressive manner, they commence to function with a complete network as a
community and in each stage determine one community then divided it into two](https://image.slidesharecdn.com/vol14no2-september2014-171208072404/85/Vol-14-No-2-September-2014-134-320.jpg)
![International Journal of Computer Science and Business Informatics
IJCSBI.ORG
ISSN: 1694-2108 | Vol. 14, No. 2. AUGUST/SEPTEMBER 2014 132
parts and this procedure will continue until culminating in clusters containing one
member. Clauset and his associates [6] introduced a hierarchical method through
that the nodes of graph are divided according to a greedy algorithm that the
modularity resulted from this division reaches its maximum. Another method of
clustering is partitioning method. The algorithm of partitioning clustering will
gains one partition from data instead of the structure that dendrogram produces
through a hierarchical technique. The partitioning method is useful as well as in
total data collections this is one of the advantages of this method since prevents
the dendrogram structure that involves a lot of computations. One of the
problems relevant to the algorithms of partitioning is the selection of ideal
clusters number and preliminary [7]. Most of the community discovery
algorithms discussed in this section were designed with the implicit assumption
that the underlying network is unchanging. This is in the case that in real social
networks the relation among nodes changes by the pass of time and consequently
their membership in different communities will as well as change [8].
3. EDGE BETWEENESS CENTRALITY ALGORITM
In the traditional hierarchy methods, the structures with high degree joints are
gradually created and develop in graph. These methods are prosperous in
detecting communities only in limited cases. One of the main problems of these
methods is that there may be nodes in the graph which connect to the other nodes
only via an edge. These nodes by algorithm will have no place in any community.
But it is clear that these nodes are belonged to the community through that mono-
edge is connected to that the same community. To solve the problems of
hierarchical methods Newman and Girvan [9] proposed a divisive algorithm for
community discovery, using ideas of edge betweenness. In this method the border
of community is delineated through the criterion of edge betweenness. The
centrality of an edge is the number of the shortest path that exists among nodes
that pass through this edge. In the other word, the centrality of edge means that
what measure of edge exists across the paths between two collections of
connected nodes. While conducting this method in each stage the edge having the
most centrality will be deleted from the graph, then the centrality of other edges
will again be computed. While conducting this method in each stage the edge
having the most centrality will be deleted from the graph, then the centrality of
other edges will again be computed. As a result of the repetition of this
procedure, a collection of isolated categories will be created in graph that each of
them is the representative of communities in graph. The reason for the
recalculation step is as follows: if the edge betweenness are only calculated once
and edges are then removed by the decreasing order of scores, these scores won’t
get updated and no longer reflect the new network structure after edge removals.
4. METHODOLOGY
This section deal with the introduction of a method applied for community
clustering in the social network graphs. Of course the intended graph in our](https://image.slidesharecdn.com/vol14no2-september2014-171208072404/85/Vol-14-No-2-September-2014-135-320.jpg)
![International Journal of Computer Science and Business Informatics
IJCSBI.ORG
ISSN: 1694-2108 | Vol. 14, No. 2. AUGUST/SEPTEMBER 2014 133
suggested method is a kind of directed and weighted graph. The method
introduced in this research study is based on a divisive algorithm. As well as, our
suggested method is verbalized through the algorithm of edge betweenness
centrality. Considering the issue that in social network edge is the representative
of relationship between two individuals, it can be concluded that edges, the most
frequently used to compute the shortest paths pass through them, are the bridges
which much density is available on their two ends under the graph. The
difference here creates in Newman -Girvan algorithm is that the value between
two nodes will no longer be identical, but by accepting one fuzzy degree in the
[0,1] interval in proportion to other edges will be more valuable and consequently
the proportion of this edge in the edge betweenness centrality will be different. It
should be added that the degree of fuzzy membership is attributed to each edge
on the premise of the measure of the relationship among individuals in social
network. If the detecting of these edges is conducted by using the shortest paths
under created graphs in the first stage is regressively continuing, almost the
maximum of communities in graph can be detected. The stages of conducting the
suggested method are as the following:
ALGORITHM 1:BREADTHFIRSTSEARCH
1. The initial node called A, da=0 and gained the weight Wa=1.
2. Each node i in the neighborhood of A will gain the distance ofd=da+1=1 and
the weight of Wi= Wa= 1.
3. One of the three following choices will be performed for each node j in the
neighborhood of node i:
If the node j has not receive distance to which the distance of dj= di+ 1=
1and the weight of Wj= Wi will be dedicated.
If the node j already has received the distance and dj= di+ 1, the weight of
node will Wi be increased. It means that Wj= Wj+ Wi .
If the node j has already received and dj< di+1 no operation will be
performed.
4. From the stage (3) the algorithm will be repeated as long as no node is
remained to investigate.
The weight attributed to node i, in fact, verbalize the number of independent
paths of initial node to node i. These weights are necessary to compute edge
betweenness centrality, for two connected nodes i and j (that j is more far that i
from the resource A) a fraction of the shortest paths between i and j nodes that
passes through i is determined via Wi/ Wj. Now, the following stages will be
conducted to compute edge betweenness through the all shortest paths from
resource A.
ALGORITHM 2: THE COMPUTATIONOFEDGE BETWEENESS
1. All the leaves under the title node B should be searched.
2. The amount of Wi/ Wj will be dedicated to the edges between i and j.
3. Now, the movement is performed from the farthest edges from the source A, it
means lowest level to up, towards node A. The amount of one plus the total](https://image.slidesharecdn.com/vol14no2-september2014-171208072404/85/Vol-14-No-2-September-2014-136-320.jpg)

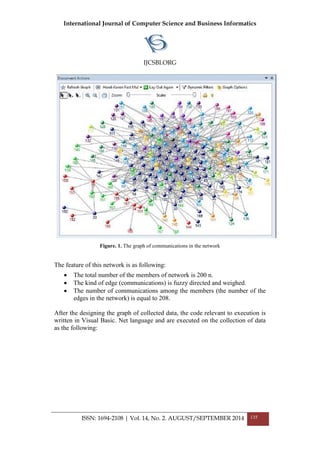

![International Journal of Computer Science and Business Informatics
IJCSBI.ORG
ISSN: 1694-2108 | Vol. 14, No. 2. AUGUST/SEPTEMBER 2014 138
could also reduce to much extent the number of mono-node clusters which have
undesirable effects on creating earned clusters and the average density.
FUTURE WORKS: To detect the nodes located at high degree centrality or the
nodes located to the high closeness centrality rather than the other nodes in social
network and introduce them as the centers of clusters in the algorithm of edge
centrality in Newman’s algorithm. Also, the amount of the influence of a node,
called Eigenvector centrality in the graph of a social network can be introduced
and determined as the core of clusters and the leader node in the graph.
REFERENCES
[1] U. Brands, D. Delling, M. Gaertler, R. Gorki, M. Hoofers, Z. Mikulski, D. Wagner 2008. On
modularity clustering.IEEE Transactions on Knowledge and Data Engineering. 20, 2, pp. 172-
188.
[2] R. Xu 2005.Survey of Clustering Algorithms. In: IEEE Transactions on NeuralNetwork, vol.
16, no. 3:645–678.
[3] M. Girvan, M.E.J. Newman 2002. Community structure in social and biological networks.
Proceedings of the National Academy of Sciences USA. 99, 12, pp. 7821–7826.
[4] L. Freeman 1979. Centrality in social networks: Conceptual clarification. Social Networks.
Elsevier Sequoia S.A., Lausanne - Printed In the Netherlands. 2, 2, pp. 215-239.
[5] M.E.J. Newman 2010. Networks: An Introduction. Oxford University Press; 1 edition. pp. 1-
34.
[6] A. Clauset, M.E.J. Newman, C. Moore 2004. Finding community structure in very large
networks. Physical Review E, 70, 6, pp. 66-111.
[7] P. Zhao, C. Zhang, S. Chatterjee 2011. A new clustering method and its application in social
networks, Pattern Recognition Letters, Elsevier, 32, 2109-2118.
[8] O. Green, D. Bader 2013. Faster betweenness centrality based on data structure
experimentation.International Conference on Computational Science, ICCS. Available online at
www.sciencedirect.com. Volume 18, pp. 399-408.
[9] M.E.J. Newman, M. Girvan 2004. Finding and evaluating community structure in networks.
Phys. Rev. E, 69(2):026113-026120.
This paper may be cited as:
Saed, N., Sadeghzadeh, M. and Yektaie, M. H., 2014. Presentation of Fuzzy
Model to Compute the Edge Betweenness Centrality in Social Networks.
International Journal of Computer Science and Business Informatics, Vol. 14,
No. 2, pp. 130-138.](https://image.slidesharecdn.com/vol14no2-september2014-171208072404/85/Vol-14-No-2-September-2014-141-320.jpg)
![International Journal of Computer Science and Business Informatics
IJCSBI.ORG
ISSN: 1694-2108 | Vol. 14, No. 2. AUGUST/SEPTEMBER 2014 153
A Lightweight Authentication Scheme
for Mobile Cloud Computing
Mohammad Rasoul Momeni
Department of Computer Engineering,
Imam Reza International University of Mashhad, Iran
ABSTRACT
The ABI Research believes that the number of mobile cloud computing users is expected to grow
from 42.8 million (1.1% of total mobile users) in 2008 to 998 million (19% of total mobile users) in
2014. The security risks have become a hurdle in the rapid adaptability of the mobile cloud computing
technology. Significant efforts have been devoted in research organizations and academia to securing
the mobile cloud computing technology. In this paper we proposed a lightweight authentication
protocol for mobile cloud environment. Our proposed protocol has many advantages such as:
supporting user anonymity, local authentication and also resistance against related attacks such as
replay attack, stolen verifier attack, modification attack, server spoofing attack and so on.
Keywords
mobile cloud computing, security risks, lightweight authentication, local authentication.
1. Introduction
Due to inherent challenges of wireless communications such as insecure nature and
problems related to heterogeneity, security and privacy issues are too complex in
mobile cloud computing. And also due to energy constraints in mobile devices,
mobile users need to lightweight security mechanisms. As a security factor,
authentication methods are grouped to four classes. 1. what you are? (e.g.
fingerprint), 2. what you have? (e.g. smart cards), 3. what you know? (e.g.
passwords) and 4. what you do? or implicit authentication. Authentication is the
most important factor to protect systems against attacks. Especially in wireless
mobile communications, authentication methods should be lightweight, also
computation and communication costs should be little. Firstly lamport in 1981
proposed an authentication scheme over an open channel [1]. Chang and Wu
proposed smart cards for remote user authentication protocols [2]. Then many two
factor authentication protocols have been proposed [3-7]. Chow et al proposed an
authentication framework for mobile cloud users [8]. Their proposed authentication
scheme was implicit authentication. Schwab and li proposed an entity authentication
scheme for mobile cloud environment [9]. They used fuzzy password authentication
in their scheme. Hoon and Euiin also proposed an authentication scheme using](https://image.slidesharecdn.com/vol14no2-september2014-171208072404/85/Vol-14-No-2-September-2014-142-320.jpg)
![International Journal of Computer Science and Business Informatics
IJCSBI.ORG
ISSN: 1694-2108 | Vol. 14, No. 2. AUGUST/SEPTEMBER 2014 154
profiling technique in mobile cloud computing [10]. The rest of the paper is
organized as follows: in Section 2, we propose our scheme. Section 3 and 4 describe
the security and performance analysis respectively. And finally section 5 concludes
the paper. The notations to be used in this paper are in Table 1.
Table 1. Notations
2. Proposed authentication Protocol
In this section our protocol is presented. The time for remote authentication protocol
is long, especially in the wireless mobile communications. Hence this protocol
provides local authentication. In this protocol mobile user is authenticated in his/her
mobile network, hence this mechanism provides low latency and saves bandwidth. In
the end of authentication phase mobile user receives a CertMU from mobile service
provider that presents it to the cloud service provider. Note that mobile service](https://image.slidesharecdn.com/vol14no2-september2014-171208072404/85/Vol-14-No-2-September-2014-143-320.jpg)

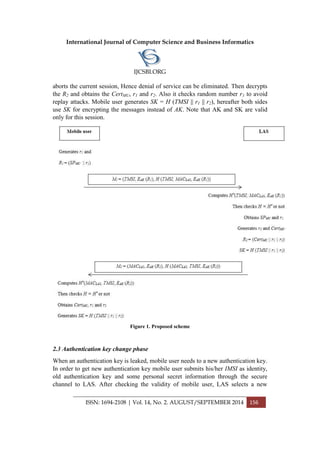
![International Journal of Computer Science and Business Informatics
IJCSBI.ORG
ISSN: 1694-2108 | Vol. 14, No. 2. AUGUST/SEPTEMBER 2014 157
random number X* and generates the new authentication key AK* = H (X* || IMSI).
Now LAS sends AK* to mobile user through the secure channel.
3. Security analysis
In this section security features of our proposed protocol is presented and we
demonstrate proposed protocol can withstand against related security attacks.
3.1 No clock synchronization problem: many proposed authentication protocols use
timestamps to avoid replay attacks but timestamp mechanism is difficult and
expensive in wireless mobile communications [11] and distributed networks
[12,13,14]. Our proposed protocol is nonce-based and does not have clock
synchronization problem.
3.2 Session key agreement: in our proposed protocol a session key is generated
which uses random numbers like r1 and r2. This session key provides secure
communications over open channel by encrypting the exchanged messages.
3.3 Modification attack resistance: to avoid modification attacks in our proposed
protocol, collision-free one-way hash function is used. If an adversary sends a
modified message, recipient can easily detect it by checking the hash values.
3.4 Replay attack resistance: our proposed protocol includes random numbers to
avoid replay attacks. Guessing the value of random numbers is very hard for
attackers because they are refreshed in each session and authentication time.
3.5 Authentication key change phase: When an authentication key is leaked, mobile
user needs to a new authentication key. Our proposed protocol supports
Authentication key change phase. As mentioned after checking the validity of mobile
user, LAS selects a new random number X* and generates the new authentication
key AK* = H (X* || IMSI). Now LAS sends AK* to mobile user through the secure
channel.
3.6 Stolen verifier attack resistance: our proposed protocol is robust against stolen
verifier attack because server does not keep any secret table or any pre-shared secret
key. Hence adversary cannot gain any valuable information from this attack.
3.7 Server spoofing attack resistance: our proposed protocol provides mutual
authentication for both participants. Mobile user authenticates the LAS and also LAS
can authenticate the mobile user. Hence sever spoofing attack is ineffective.
3.8 Local authentication: as mentioned proposed scheme implements local
authentication. Local authentication has two big advantages: it saves bandwidth and](https://image.slidesharecdn.com/vol14no2-september2014-171208072404/85/Vol-14-No-2-September-2014-146-320.jpg)
![International Journal of Computer Science and Business Informatics
IJCSBI.ORG
ISSN: 1694-2108 | Vol. 14, No. 2. AUGUST/SEPTEMBER 2014 158
removes latency.
3.9 User anonymity: user anonymity means protecting real identity of user against
public, no server [15]. Our proposed scheme satisfies user anonymity, because in the
registration phase IMSI (real identity of user) transmits through secure channel. In
the authentication phase instead of IMSI, TMSI transmits to LAS.
3.10 Parallel session attack resistance: both two identities of mobile user and LAS
exist in the hash functions of exchanged messages M1 and M2. This mechanism
prevents parallel session attack and our proposed scheme is robust against parallel
session attack.
3.11 Known plaintext attack resistance: the attacker does not know AK = H (X ||
IMSI), because IMSI transmits through secure channel in the registration phase and
in the authentication phase TMSI transmits to LAS instead of IMSI. Also X is a high
entropy secret random number that attacker cannot access it. Hence our proposed
protocol is robust against Known plaintext attack.
4. Performance analysis
In this section we evaluate the performance of our proposed protocol. Note that a
good authentication scheme for mobile cloud computing must be lightweight. In
order to be lightweight we used symmetric encryption, since it has very low
computation cost. Our proposed scheme analysis is shown in
Table 2.
Table 2. Computation cost of our scheme
Also computation cost of LMAM [16] is shown in Table 3.](https://image.slidesharecdn.com/vol14no2-september2014-171208072404/85/Vol-14-No-2-September-2014-147-320.jpg)
![International Journal of Computer Science and Business Informatics
IJCSBI.ORG
ISSN: 1694-2108 | Vol. 14, No. 2. AUGUST/SEPTEMBER 2014 159
Table 3. Computation cost of LMAM [16].
Comparing the two tables, it is clear to see our proposed scheme is more
efficient than LMAM. Respectively CH, CR and CSYM are hash functions cost,
random numbers cost and also symmetric encryptions cost.
5. Conclusion
In this paper we proposed a lightweight authentication protocol for mobile
cloud computing. The time for remote authentication protocol is long,
especially in the wireless mobile communications. Hence this protocol provides
local authentication. In this protocol mobile user is authenticated in his/her
mobile network, hence this mechanism provides low latency and saves
bandwidth. Also our proposed protocol satisfies user anonymity, mutual
authentication and so on. In terms of resistance against related attacks, our
proposed protocol is robust against replay attack, stolen verifier attack,
modification attack, server spoofing attack and so on. It is important to note
that, proposed protocol is according to real communication scenarios.
References
[1] L. Lamport, Password authentication with insecure communication, Communications of
the ACM 24 (11) (1981) 770–772.
[2] C. Chang, T. Wu, Remote password authentication with smart cards, IEE Proceedings-
Computers and Digital Techniques 138 (3) (1991) 165–168.
[3] J. Shen, C. Lin, M. Hwang, A modified remote user authentication scheme using smart
cards, IEEE Transactions on Consumer Electronics 49 (2) (2003) 414–416.
[4] I. Liao, C. Lee, M. Hwang, A password authentication scheme over insecure networks,
Journal of Computer and System Sciences 72 (4) (2006) 727–740.
[5] C. Lee, M. Hwang, I. Liao, Security enhancement on a new authentication scheme with
anonymity for wireless environments, IEEE Transactions on Industrial Electronics 53 (5)
(2006) 1683–1687.
[6] J. Xu, W. Zhu, D. Feng, An improved smart card based password authentication scheme
with provable security, Computer Standards & Interfaces 31 (4) (2009) 723–728.](https://image.slidesharecdn.com/vol14no2-september2014-171208072404/85/Vol-14-No-2-September-2014-148-320.jpg)
![International Journal of Computer Science and Business Informatics
IJCSBI.ORG
ISSN: 1694-2108 | Vol. 14, No. 2. AUGUST/SEPTEMBER 2014 160
[7] K. Yeh, C. Su, N. Lo, Y. Li, Y. Hung, Two robust remote user authentication protocols
using smart cards, Journal of Systems and Software 83 (12) (2010) 2556–2565.
[8] R. Chow, M. Jakobsson, R. Masuoka, J. Molina, Y. Niu, E. Shi, and Z. Song,
“Authentication in the clouds: a framework and its application to mobile users,” in
Proceedings of the 2010 ACM workshop on Cloud computing security workshop (CCSW),
pp. 1 - 6, 2010.
[9] David Schwab, Li Yang, Entity Authentication in a Mobile-Cloud Environment, CSIIRW
'12, Oct 30 - Nov 01 2012, Oak Ridge, TN, USA ACM 978-1-4503-1687-3/12/10.
[10]Hoon jeong, Euiin choi, user authentication using profiling in mobile cloud computing,
AASRI Procedia 2 (2012) 262 – 267, Doi: 10.1016/j.aasri.2012.09.044.
[11]A. Giridhar, P. Kumar, Distributed clock synchronization over wireless networks:
algorithms and analysis, in: Proceedings of the 45th IEEE Conference on Decision and
Control, IEEE, 2006, pp. 4915–4920.
[12]D. Mills, Internet time synchronization: the network time protocol, IEEE Transactions on
Communications 39 (10) (1991) 1393–1482.
[13]J. Han, D. Jeong, A practical implementation of IEEE 1588–2008 transparent clock for
distributed measurement and control systems, IEEE Transactions on Instrumentation and
Measurement 59 (2) (2010) 433–439.
[14]R. Baldoni, A. Corsaro, L. Querzoni, S. Scipioni, S. Piergiovanni, Coupling-based internal
clock synchronization for large-scale dynamic distributed systems, IEEE Transactions on
Parallel and Distributed Systems 21 (5) (2010) 607–619.
[15]D. Wanga, Chun-guang, Cryptanalysis of a remote user authentication scheme for mobile
client–server environment based on ECC, Information Fusion 14 (2013) 498–503.
[16]D. He, M. Ma, Y. Zhang, C. Chen, J. Bu, A strong user authentication scheme with smart
cards for wireless communications. Computer Communications, 34 (2011) 367–374.
This paper may be cited as:
Momeni, M. R., 2014. A Lightweight Authentication Scheme for Mobile Cloud
Computing. International Journal of Computer Science and Business
Informatics, Vol. 14, No. 2, pp. 153-160.](https://image.slidesharecdn.com/vol14no2-september2014-171208072404/85/Vol-14-No-2-September-2014-149-320.jpg)